All published articles of this journal are available on ScienceDirect.
Surface Roughness of Initial Enamel Caries Lesions in Human Teeth After Resin Infiltration
Abstract
Background:
Low viscosity resin infiltration of initial caries lesions is a modern microinvasive method to treat initial cries lesions. However, only scarce information is available about the long-term surface alterations of infiltrated lesions.
Methods:
Twenty-eight premolar teeth exhibiting non-cavitated initial caries lesions (International Caries Detection and Assessment System (ICDAS code 1&2)) were divided into two groups, one of which was infiltrated with resin, and the other remained untreated. The teeth underwent two thermocycling procedures. The surface roughness was determined quantitatively, and the results were evaluated statistically. In addition, the surfaces of the lesions were investigated by scanning electron microscopy (SEM), and the surface was analyzed visually with respect to surface irregularities.
Results:
The results showed a reduction in the surface roughness that was significant after 2500 thermocycles compared to the untreated surface. In the control specimens, no change in the surface roughness was found. The qualitative SEM data also showed a smooth surface after thermocycling, which supported the statistical findings.
Conclusion:
After thermocycling, resin-infiltrated enamel surfaces become smoother and had no additional risk for plaque accumulation.
BACKGROUND
Since the invention of a low-viscosity resin for the infiltration of initial caries lesions [1, 2], this method has become a promising minimally invasive treatment for non-cavitated initial caries lesions (International Caries Detection and Assessment System (ICDAS code 1&2)). Several studies have shown that ICDAS code 1&2 caries lesions are deeply infiltrated by the resin, preventing further caries progression [2-10]. IDAS code 1&2 natural enamel caries lesions are characterized by a pseudo-intact surface layer and a demineralized subsurface body of the lesion [1, 3, 11-14]. This layer hampers resin infiltration [2, 4, 15]. Therefore, the enamel surface must be conditioned with 15% hydrochloric acid, which results in a mild surface destruction between a depth of 35 and 50 µm and roughening of the enamel surface [15-18]. During infiltration and polymerization, the lesion is almost filled with the resin [2-4, 13]. The infiltration depth of the resin into the lesion is dependent on the activity of the lesion and is also dependent on the acid pretreatment [17]. However, whether the surface destruction is completely filled with the resin is still a matter for debate [19]. Rough surfaces are retention sites for plaque and risk factors for secondary caries development. Furthermore, rough surfacess are vulnerable to dye uptake from coffee, tea or red wine and become darker over time. In bovine enamel, resin infiltration into the enamel surface has been shown to primarily result in a smoothening of the surface [20].
To date, little information is available on the long-term results of resin infiltration. One three-year randomized clinical trial demonstrated good results in the prevention of further caries progression [21]. A recent systematic review came to a similar conclusion [22]. Not much is known about the long-term stability of the resin and the possible effects of the surface alterations. Resin degradation might result in surface destruction and the development of plaque on these sites [23]. Therefore, resin degradation may be a risk factor for increased plaque accumulation and the development of secondary caries.
The aim of this study was to investigate the short and long-term thermal stress influences of alternating temperatures on the surface roughness of resin-infiltrated natural initial caries lesions through an in vitro experiment. The null hypothesis was to find no changes in the surface roughness after the long-term application of alternating temperatures.
OBJECTIVE
It was the aim of this study to determine changes in roughness for resin infiltrated enamel lesions after short-term thermocycling. The null hypothesis of the study was that there will be no difference in the surface morphology and surface roughness after thermocycling.
MATERIALS AND METHODS
Twenty-eight human premolar teeth that were extracted for orthodontic reasons and showed white or brown spot proximal initial caries lesions (ICDAS code 2 with distinct lesions) were used for this study. This research was conducted strictly in accordance with the current version of the World Medical Association Declaration of Helsinki. Collection of the teeth was approved by the ethical committee of Witten/Herdecke University (Nr. 116/2013). Verbal consent of the donors of the teeth was obtained prior to their use. According to the ethical committee’s statement, no written consent was necessary for the use of the teeth. All of the teeth were thoroughly cleaned with a commercially available toothbrush (Dr. Best hoch-tief, medium, Dr. Best, Bühl, Germany) under rinsing water for three minutes and stored in 0.9% NaCl containing a 0.1% thymol solution according to ISO TS 11405 2015. All caries lesions were documented using a Nikon D50 camera (Nikon, Düsseldorf, Germany) attached to a Leica Wild M3Z microscope (Leica, Wetzlar, Germany). In addition, the initial lesions were checked under the microscope at 40x magnification to verify the initial caries lesion. The original surface roughness of the lesions was documented with a profilometer (see below). Then, the teeth were randomly divided into two groups of fourteen teeth each. In the first group, the lesions were infiltrated with resin, and the teeth in the second group remained untreated to serve as a control. Subsequently, two thermocycling steps were performed, and the surface roughness of the lesions was determined after each thermocycle. The experimental procedure is summarized in Fig. (1).
RESIN INFILTRATION
For resin infiltration of the initial caries lesions, Icon (DMG Chemisch-Pharmazeutische Fabrik, Hamburg, Germany) was strictly used according to the manufacturer’s instructions. Icon is a methacrylate-based, light curing, low-viscosity resin. The infiltration procedure is summarized in Table 1.
Thermocycling
All teeth received two alternating thermocycling steps to simulate different aging intervals. The first step was at 5˚C for 30 s, and the second step was at 55˚C for 30 s. The first thermocycle was comprised of 120 alternating cycles representing a short-term thermal stress period, and the second thermocycle was comprised of 2380 cycles, which resulted in a total of 2500 cycles, which represented a long-term thermal stress period. A THE-1100 thermocycler (SD Mechatronik, Feldkirchen-Westerham, Deutschland) was used. Between the different thermocycling steps, the teeth were kept in artificial saliva. The composition of artificial saliva has been previously described [24].
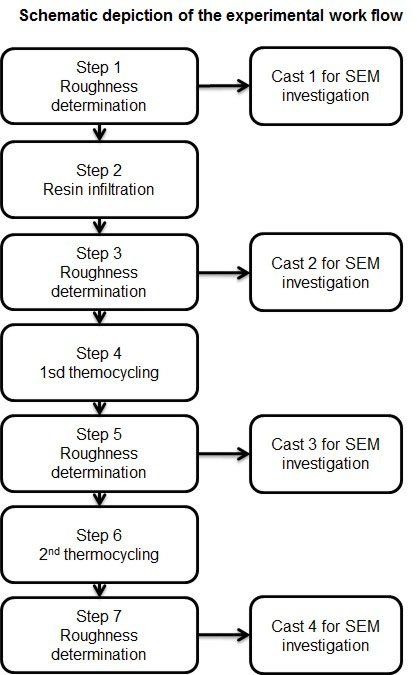
Each surface alteration was followed by a roughness determination and SEM documentation
| Step | Applied Substance |
|---|---|
| Cleaning | Water |
| Surface conditioning | Icon-Etch (15% HCl) for 2 min |
| Cleaning | Water for 30 s |
| Drying | Dry air |
| Drying | Icon-Dry (99% ethanol) |
| 1st infiltration | Icon Infiltrant 3 min |
| Hardening | Light hardening with Tanslux Power Blue 40 s (Heraeus Kluzer, Hanau, Germany) |
| 2nd infiltration | Icon Infiltrant 1 min |
| Hardening | Light hardening with Tanslux Power Blue 40 s (Heraeus Kluzer, Hanau, Germany) |
| Polishing | Epitex polishing strip 1200 (GC Germany, Bad Homburg, Germany) |
Replica Production
Casts were made from all surfaces of the initial caries lesion with a low viscosity polysiloxane precision impression material (Xantopren green, Heraeus Kulzer, Hanau, Germany). The casts were washed and dried for 24 hours at room temperature and then filled with a low viscosity polyurethane resin (Mirapont, Hager & Werken, Duisburg, Germany). After polymerization, the replicas were isolated and prepared for scanning electron microscopy (SEM).
SCANNING ELECTRON MICROSCOPY
All of the replicas were mounted on specimen holders, sputtered with gold-palladium at 40 mV for 80 s (Baltec sputter coater, Balzers, Liechtenstein) and investigated with SEM. SEM of the replicas of steps 1 and 3 (Fig. 1) was carried out with a Philips XL 30 FEG (Philips, Eindhoven, The Netherlands), and the replicas of steps 5 and 7 (Fig. 1) were evaluated with a Sigma VP (Carl Zeiss AG, Oberkochen, Germany) scanning electron microscope. The acceleration voltages were 20 and 15 kV, respectively, as measured by a secondary electron detector. Surface morphology was determined by visual inspection with respect to irregularities. After finishing the roughness measurements of 7 of the infiltrated lesions, horizontal sections were cut through the lesions with a saw microtome (Leica 1600, Leitz Microsystems, Wetzlar, Germany). From each tooth, one section was investigated with energy dispersive X-ray spectroscopy (EDS). EDS spectroscopy was performed with an EDAX Apollo XL system (EDAX Ametec, Mahwah, NJ, USA) with an active area of 30 mm2 and Team V3.3 software (EDAX Ametec, Mahwah, NJ, USA). Reading of the line scans was performed with a dwell time of 25 ms and an amplification time of 12.8 µs with a distance between each reading point of 1 µm. The EDS mappings were measured with a dwell time of 200 µs per reading point and a frame resolution of 512 × 40 pixels. One hundred and twenty-eight frames were recorded, which resulted in a scan time of approximately 1½ hours. The Carbon X-ray signal served as a marker for resin infiltration [25, 26].
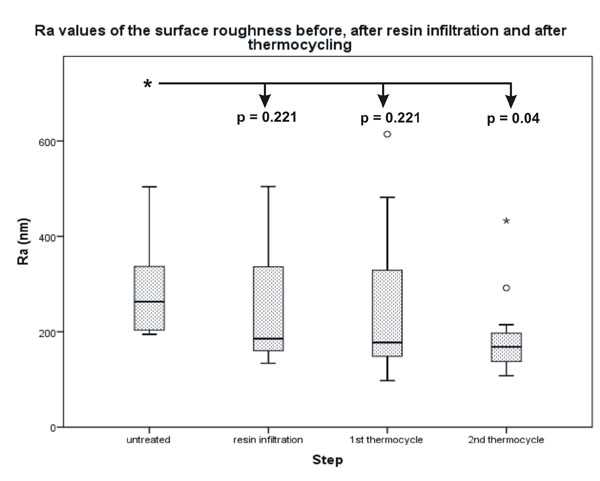
The difference between the untreated surface and the infiltrated surface after 2500 thermocycles was significant.
| Step | Median | Minimum | Maximum | Interquartile range |
|---|---|---|---|---|
| Untreated | 263.25 | 194.76 | 504.02 | 152.5 |
| After resin infiltration | 185.78 | 134.23 | 504.69 | 178.06 |
| After 1st thermocycling | 177.76 | 97.76 | 614.41 | 207.74 |
| After 2nd thermocycling | 168.5 | 108 | 433 | 67.05 |
| Control untreated | 179.72 | 70.94 | 268.09 | 197.15 |
| Control after 1st thermocycling | 145.22 | 89.45 | 239.58 | 150.13 |
| Control after 2nd thermocycling | 115.8 | 82.47 | 199.49 | 117.01 |
ROUGHNESS MEASUREMENT
The surface roughness was determined with an Infinite Focus G3 optical profilometer (Alicona Imaging GmbH, Raaba/Graz, Austria). Roughness was measured as Ra (average roughness of profile) and asfc (area-scale-fractal-complexity). Overview scans were made first to determine the exact areas for repeated measurements after the different thermocycling steps. Five measurements were made on each enamel lesion surface and in each step (Fig. 1). The mean values of the five measurements in steps 1, 3, 5 and 7 (Fig. 1) were used for statistical evaluation.
STATISTICS
Because the measured Ra values and the asfc values did not show a normal distribution, the non-parametric Wilcoxon ranked sign test was used for related variables. The level of significance was p < 0.05. The results were expressed as boxplot graphs calculated with the computer program SPSS Rel. 21 (IBM Corporation, Armonk, NY, USA). Power analysis was carried out with an alpha of 0.05 and a power of 0.8 (sigma 1 = 100.65, sigma 2 = 85.34; mean 1 = 288.981, mean 2 = 188.656). Power analysis was calculated using Axum 7 (Mathsoft, Cambridge, Massachusetts, USA). The data for the power analysis were acquired from a preliminary study for this investigation using 4 teeth.
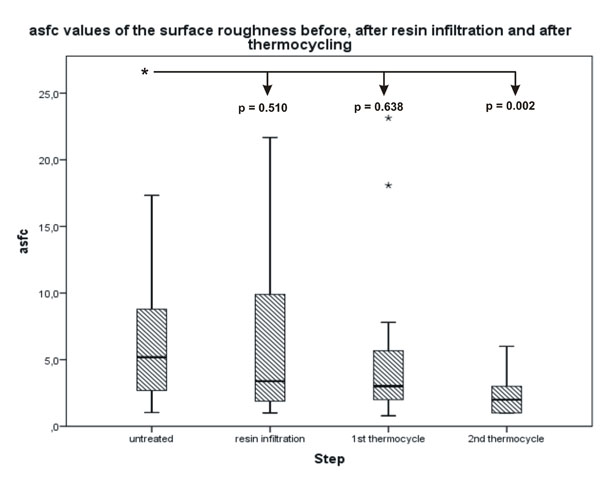
The difference between the untreated surface and the infiltrated surface after 2500 thermocycles was significant.
RESULTS
All investigated lesions were distinct lesions, ICDAS code 2, with a size between 2 × 2 mm, 3x3 mm or 3 × 2 mm (length × width). The power analysis resulted in a minimum sample size of 14.
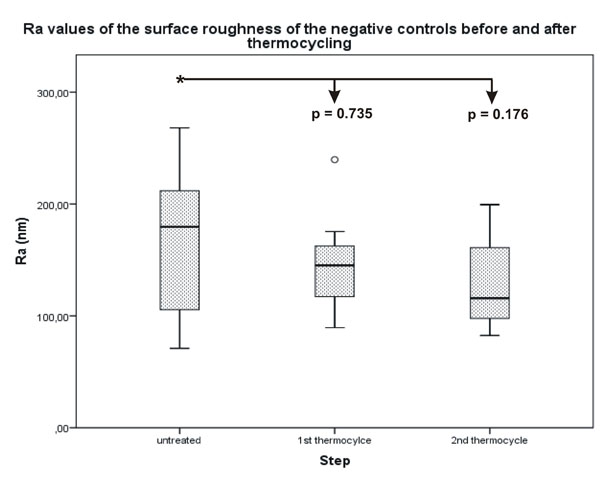
No statistically significant difference was determined for the Ra values between the untreated surface of the lesions and the thermocycled surface.
SURFACE ROUGHNESS
Statistical analysis of the Ra and asfc values showed similar results with a decrease in roughness values after each surface alteration. The Ra decreased from an original median value of 263.25 nm to a final median value of 168.50 nm with a significant difference of p = 0.04 (Fig. 2). The asfc value decreased from 5.1870 to 2.0000, which was also significant with a p-value of p = 0.002 (Fig. 3). The differences between the untreated surface and the surfaces after resin infiltration as well as the first thermocycle were not significant. No significant differences were found in the negative control surfaces (Figs. 4 and 5). All quantitative data are summarized in Tables 2 and 3.
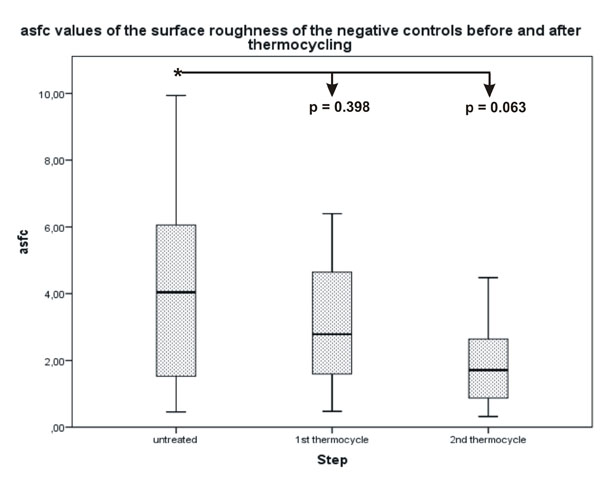
No statistically significant difference was determined for the asfc values between the untreated surface of the lesions and the thermocycled surface.
| Step | Median | Minimum | Maximum | Interquartile range |
|---|---|---|---|---|
| Untreated | 5.187 | 1.0388 | 17.3314 | 7.1263 |
| After resin infiltration | 3.3854 | 1 | 21.6714 | 8.2898 |
| After 1st thermocycling | 3.015 | 0.79 | 23.131 | 4.298 |
| After 2nd thermocycling | 2.00 | 1.00 | 6.00 | 2.00 |
| Control untreated | 4.0396 | 0.46 | 9.94 | 9.48 |
| Control after 1st thermocycling | 2.7864 | 0.48 | 6.39 | 5.92 |
| Control after 2nd thermocycling | 1.7092 | 0.32 | 4.48 | 4.16 |
SEM DOCUMENTATION
SEM investigation showed a relatively irregular surface for the untreated initial caries lesions. After resin infiltration, the surface was still irregular. After the second thermocycling, the surface appeared smooth. The SEM surface microphotographs are displayed in Fig. (6). EDS analysis of the sectioned infiltrated lesions revealed resin infiltration into the demineralized lesion zones. This result was shown by an increase of the C signal in the line scans (Fig. 7) and also in the EDS mappings (Fig. 8).
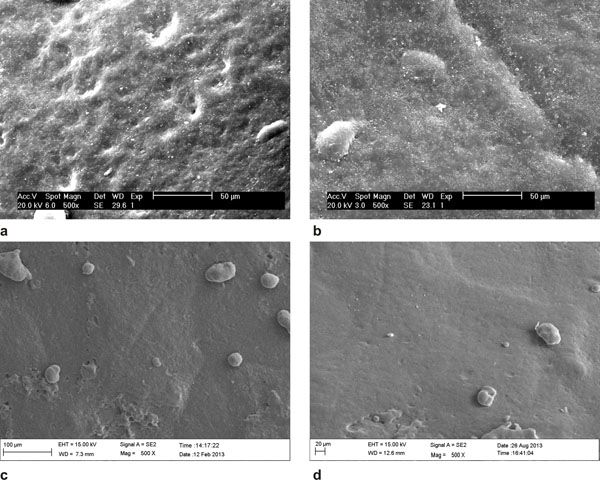
(a) untreated surface of the lesion; (b) after resin infiltration; (c) after the first thermocycle; (d) after the second thermocycle.
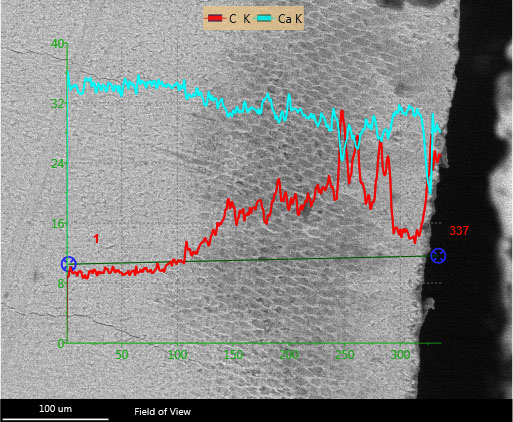
The lesion is clearly visible as a dark area within the enamel. The Ca line shows a decreasing Ca content within the lesion, whereas the Ca content representing the resin is increasing. The K behind the element symbol indicates the measured x-ray energy of the K electron-orbital.
DISCUSSION
In the present study, two different surface roughness evaluation methods were used. Determination of the roughness Ra values is a two- dimensional method that measures the roughness of a specific profile. The advantage of this two-dimensional method is the precise determination of the surface roughness profile. The disadvantage of this two-dimensional method is that in repeated measurements, it is almost impossible to determine the exact profile several times. Calculation of the asfc values is a mathematical method that is based on the chaos theory of B. Mandelbrot [27] and uses fractal geometry. This method produces a 3D calculation of the surface roughness by calculation of the dimensionless asfc value, which precisely describes the surface roughness of a selected area [28, 29]. The use of fractal geometry for surface roughness determination is regulated by the American Society of Mechanical Engineering (ASME) in AMSE B46.1-2002 [30]. In contrast to the determination of the average surface roughness of an area (Sa value), which is similar to the Ra value and has been used recently for 3D determination of the surface roughness [23], the asfc value is more exact and reproducible.

Resin infiltration of the initial enamel caries lesion not only results in smoothing the surface [20] but also protects the enamel from further demineralization [10]. Another study, however, showed no significant change in the surface roughness after resin infiltration [23], which was similar to the results of a study that also found no significant change in the surface roughness before and after resin infiltration. Although initial enamel caries lesions are covered with a pseudo-intact surface layer, they exhibit a rougher surface compared to the sound enamel surface [20]. This difference may result in further plaque accumulation on the surface of the initial caries lesion and promote surface demineralization and further caries progression. Another study tested two different resins and studied the surface with atomic force microscopy. No differences were found between the three groups. However, these experiments were carried out on sound enamel without any demineralization [31].
The surface of initial caries lesions is covered by a pseudo-intact surface layer, which must be removed before resin infiltration, and the enamel surface becomes rougher as a result [16]. The surface is pseudo-intact because all stages of the initial caries lesions showed cavitation under an electron microscope [32]. It is well known that the body of initial caries lesions has a sponge-like structure with an increased porous volume, which might be infiltrated by low viscosity resins [1, 2, 33]. More or less complete infiltration has been observed in several studies [13, 14, 17, 25, 26, 34]. In this study, the EDS results of the line scans as well as of the EDS element mapping clearly demonstrated infiltration of the resin into the pores of the demineralized enamel. The resin infiltration resulted in smoothing of the acid-etched enamel surface. This smooth surface should last and prevent further plaque accumulation. It may be speculated that degradation of the resin after some time results in a rougher surface. The infiltrant of the resin used in this study was Triethylen-glycol-dimethacrylate (TEGDMA). TEGDMA has been shown to have a relatively high solubility that influences the water absorption and the degradation of the polymer [35]. Surface properties of the resin influence the adhesion and growth of cariogenic biofilms on their surfaces [36]. However, the results of this study demonstrated that the infiltrated enamel surface became smoother after 2500 thermocycles. The results of the roughness measurements also showed a similar smoothing effect of non-infiltrated enamel surface. The reason why the surface gets smoother is open to speculation. In non-infiltrated enamel, smoothing may occur due to an abrasive effect of the thermocycling procedure because demineralized enamel is more susceptible than sound enamel. After application, the surface may be rougher due to the curing procedure. These results contrast results from another study, which described roughening of the surface after resin infiltration [34]. In this investigation, qualitative methods have been used for roughness determination. However, the combination of the caries infiltration technique with a conventional adhesive protects enamel demineralization better than the application of the caries infiltrate alone [10]. According to the literature, 2500 thermocycles mimic 24 months of in vivo conditions [37, 38]. A longer experiment that mimics 5 years of in vivo conditions might deliver more accurate results about the long-term stability of the infiltrate. In other studies, infiltrated lesions were subjected to thermocycling combined with acid challenges to test the surface stability [10, 39]. The results of these studies were similar to the findings in this study.
In several studies, the resin infiltrated the initial enamel caries lesion almost completely [3, 4, 13, 14, 40]. Removal of the pseudo-intact enamel surface layer resulted in enamel surface destruction of approximately 35 to 50 µm in depth and an increase in surface roughness [16]. This surface destruction was filled with polymerized resin [26].
The threshold level for plaque retention of the enamel surface is 200 nm. Plaque retention cannot be reduced below this value [41]. The surface roughness of the untreated initial caries lesion was 263 nm, which indicated a higher risk for plaque accumulation and further caries progression. In this study, the median roughness Ra value was 185 nm immediately after infiltration. After 2500 thermocycles, the median Ra value was 168 nm, which was below the threshold for plaque retention. Patients usually regard surfaces to be rough when the Ra value is more than 0.5 µm [42]. It may be assumed from this study that patients would regard the infiltrated enamel surface as smooth and feel no discomfort.
CONCLUSION
It was concluded that after resin infiltration into initial enamel caries lesions, surface roughness decreased after the long-term application of alternating temperatures. The null hypothesis was therefore rejected.
AUTHORS CONTRIBUTION
WHA: wrote the manuscript and calculated the statistics
A-KM: conducted the experiments
EAN: responsible for final correction of the manuscript and supervised the experiments
CONFLICT OF INTEREST
The authors confirm that this article content has no conflict of interest.
ACKNOWLEDGEMENTS
The authors would like to thank Mrs. Susanne Haußmann for her technical support regarding the specimen preparation for SEM. Icon was kindly provided by DMG Chemisch-Pharmazeutische Fabrik GmbH, Hamburg, Germany. This study was funded by the institutional budget of Witten/Herdecke University.


