All published articles of this journal are available on ScienceDirect.

Evaluation of a Mathematical Model for Digital Image Enhancement
Abstract
Objective : The purpose of this study is to compare the detected number of holes on a stepwedge on images resulting from the application of the 5th degree polynomial model compared to the images resulting from the application of linear enhancement. Material and Methods : A 10-step aluminum step wedge with holes randomly drilled on each step was exposed with three different kVp and five exposure times per kVp on a Schick33® sensor. The images were enhanced by brightness/contrast adjustment, histogram equalization and with the 5th degree polynomial model and compared to the original non-enhanced images by six observers in two separate readings. Results : There was no significant difference between the readers and between the first and second reading. There was a significant three-factor interaction among Method, Exposure time, and kVp in detecting holes. The overall pattern was: “Poly” results in the highest counts, “Original” in the lowest counts, with “B/C” and “Equalized” intermediate. Conclusion : The 5th degree polynomial model showed more holes when compared to the other modalities.
INTRODUCTION
Digital image technology offers a multitude of options for improving the visual quality of diagnostic images, with the most appropriate enhancement technique varying according to imaging modality, viewing conditions and the specific diagnostic task at hand [1, 2].
Since digital radiographs are composed of a set of numbers arranged as a grid of rows and columns, the dentist can perform mathematical operations on these numbers to create a new image in which certain characteristics are enhanced, thus making interpretation of the image easier [3].
The most common image enhancement algorithms are based on linear adjustments such as brightness and contrast adjustment, and negative mode. Other algorithms are based on non-linear adjustments such as gamma correction [4-10].
Digital radiography has created a growing opportunity for computer-aided diagnostic tools that enable dentists to obtain more information from dental digital radiography than is possible with the unaided eye, leading to improved patient care [11].
Based on the use of image processing methods, various digital images with different image characteristics can be obtained for the same structure. Generic image enhancement methods can improve the diagnostic performance and subjective image quality in one task but does not always lead to a better outcome. For example, increasing the contrast between enamel and dentin might improve diagnosing interproximal caries but excess of contrast can cause false positive diagnosis of caries and will definitely create an unfavorable image for the diagnosis of periodontal diseases [12].
A new digital image processing algorithm is being developed. It is based on a 5th degree polynomial model, where grey values are converted to thickness values. By applying this algorithm, equal steps in object thickness will be perceived as equal steps in brightness change when digital radiographs are viewed.
Relating the changes of grey values to changes of absorber thicknesses gives this algorithm the advantage of using the examined structures as their own reference making this type of processing a more task/patient based enhancement method [13].
The purpose of this study is to compare the detected number of holes on a step wedge on images resulting from the application of the 5th degree polynomial model compared to the images resulting from the application of linear enhancement.
If proven effective, this enhancement method will be tested in pre-clinical/in vitro studies to assess its effectiveness in improving the detection of interproximal caries, root fracture and periodontal lesions by using a task specific calibration proper to each one of the latter situations.
MATERIAL AND METHODS
The test object was a customized 10-step aluminum step wedge at 1.5 mm increment and with five holes randomly drilled on each step at a depth varying from 0.2 to 1 mm (Fig. 1). The digital receptor used was a Size 2 Schick33® (Sirona Dental Systems, Inc. Long Island City, NY, USA). The radiographs were exposed with the Planmeca Intra (Plane mcaOy, Helsinki, Finland)intraoral X-ray machine operating at 63, 66 and 70 kVp at 8 mA, with 5 exposure times per kVp: from 0.016s to 0.064s totaling 15 exposures. The distance between source and receptor was fixed at 12 inches (30 cm).
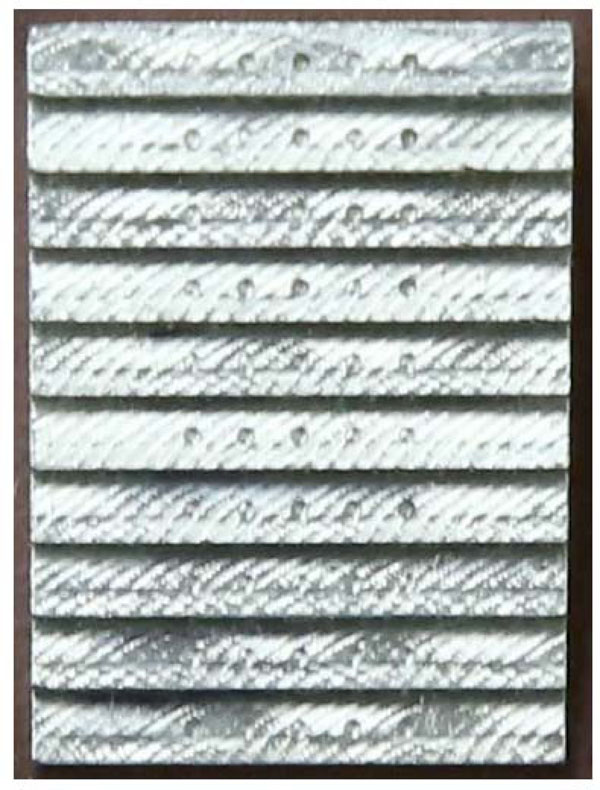
Step-wedge with holes used in the study.

Images compared on exposure settings: 66 kVp and 0.04s
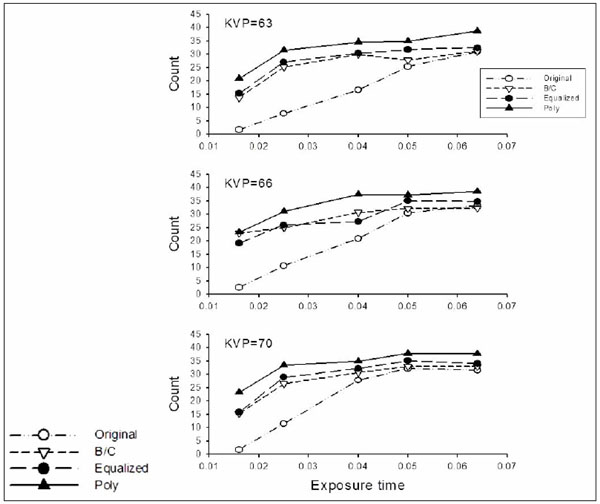
Mean number of counts by Method, Exposure time and kVp averaged over Observer and Reading.

Mean number of counts by Method and Exposure, averaged over kVp, Observer and Reading.
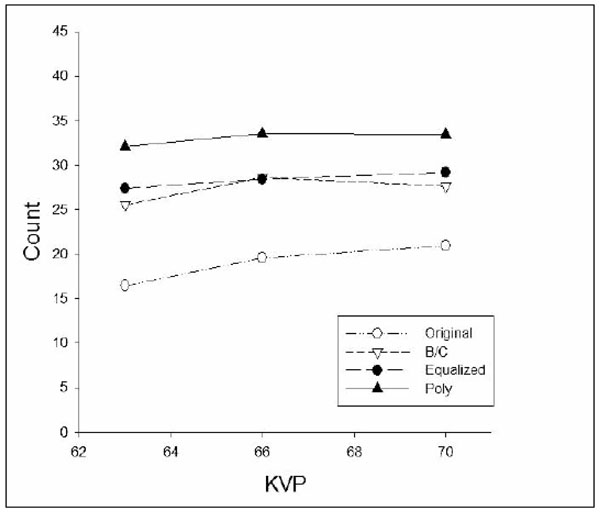
Mean number of counts by Method and kVp, averaged over Exposure time, Observer and Reading.
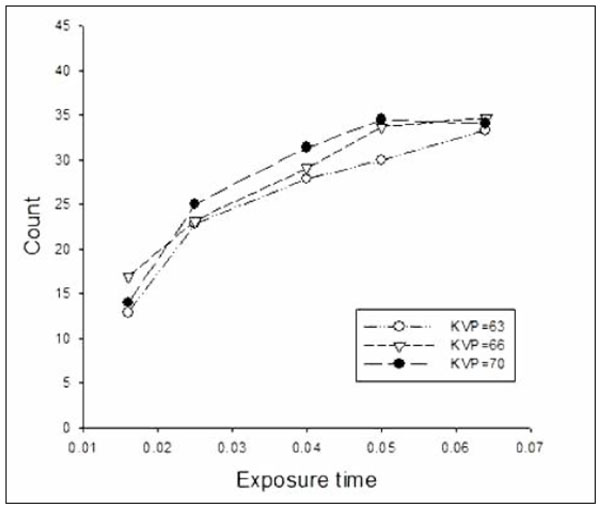
Mean number of counts by Exposure time and kVp, averaged over Method, Observer and Reading.
The original 12-bit raw data was located in the image root folder. The images were transferred as tagged image file format files (TIFF) to a personal computer with a MicrosoftWindows®7 operating system.
The software used for image analysis was ImageJ® (National Institute of Health, Bethesda, MD) and MicrosoftExcel® (Seattle, WA). ImageJ® provided the numerical values from the original images of the step wedge and Microsoft® Excel® provided the regression formulas and was used for converting the grey values to aluminum thickness values.
Images were opened in ImageJ®, and from each image the histogram of a 100 × 300 pixel region of interest from each step was evaluated, and the mean grey value from this histogram was exported to Microsoft Excel® and plotted against the thickness of its corresponding step. This generated the 5th degree polynomial fit (Poly) representing the change in grey values relative to the increasing step thickness. All images were converted based on this model.
The images were viewed as “original images” (Original), automatically adjusted brightness and contrast images (B/C), auto equalized images (Equalized) and images adjusted based on the 5th degree polynomial fit. A total of 60 images were viewed independently by six observers: Two Oral and Maxillofacial Radiologist (OMR) faculty, two OMR Residents and two Advanced Education in General Dentistry (AEGD) residents. The observers were asked to count the numbers of holes visible on each image. The reading was repeated after 2 weeks (Fig. 2).
Statistical Analysis
Data were analyzed using analysis of variance (ANOVA) for repeated measurements [14]. Observer classification was tested against a between-observer error; method, exposure time, and kVp were tested against a within-observer error. Comparisons among means following the ANOVA were Bonferroni adjusted. Residual analyses indicated that the data were in reasonable accord with the assumptions underlying the analysis of variance.
RESULTS
There was no significant difference (P=0.5017) between the observer classifications (OMR Faculty, OMR resident, and AEGD resident). Furthermore, there was no significant difference between the first and second reading by the observers (P=0.1217).
The average counts by Method, Exposure time and kVp, averaged over Observer and Reading, are shown in Fig. (3). There was a significant three-factor interaction among Method, Exposure time, and kVp. This three factor interaction indicated that the difference between Methods varied with Exposure time and kVp. Although differences among Methods vary, the overall pattern was the same, that is, “Poly” results in the highest counts, “Original” in the lowest counts, with “B/C” and “Equalized” intermediate.
Fig. (4) shows the average counts by Method and Exposure time, averaged over kVp, Observer, and Reading. The two-factor interaction was statistically significant. This is shown in the figure in which the differences between Methods vary with Exposure time. As indicated in the figure, average counts using Poly were significantly higher than obtained with the other methods for all exposure times. Average counts were lower using Original compared to the B/C and Equalized at all exposure times other than 0.064. B/C and Equalized were not significantly different at exposure times 0.016 and 0.04; at exposure time 0.025, 0.05, and 0.064, Equalized was significantly higher than B/C.
Fig. (5) shows the average counts by Method and kVp, averaged over Exposure time, Observer, and Reading. The two-factor interaction was statistically significant. However, the changes with kVp indicate that the effect of kVp was small relative to the size of the effect of Method.
Fig. (6) shows the average counts by Exposure time and kVp, averaged over Method, Observer, and Reading. The two-factor interaction was statistically significant. However, the changes with kVp again indicate that the effect of kVp was small relative to the size of the effect of Exposure time.
Within each set of observations of Exposure time, kVp, Observer, and Reading, we ranked the number of counts obtained by each of the four methods from 1 (lowest) to 4 (highest). Observations of the same count were assigned the average rank. Clearly use of Poly achieved the highest number of counts and Original the lowest; B/C and Equalized were intermediate. These results are in line with the results obtained by examining the average counts.
DISCUSSION
In the present study, images resulting from enhancement based on a 5th degree polynomial model was compared to non-enhanced images and images enhanced with adjustment of brightness and contrast and with auto equalization. The results show that images enhanced with the polynomial model enabled higher number of visible holes on the step wedge. It was noted that the application of contrast/brightness and histogram equalization performed better than the original unenhanced images. This follows the results from Li et al., and Alpoz et al. [15, 16].
As can be expected, higher number of holes was observed on images obtained with higher kVp and longer exposure times before enhancement. When interactions are present, we should be extremely careful in presenting effects averaging over the factors involved in the interactions. Because of the statistically significant three-factor interactions above, this rule applies and we must be cautious in presenting the data as we have done in Figs. (4-6). However, it was evident that no further benefit could be achieved with the use of processing algorithms, mainly the “poly” algorithm, when the kVp was increased. This result means that none of the processing algorithms used in this study had a negative impact on the counting visible holes, since no degradation in image content was noticed with any of the processing algorithms and that both the effects of Method and Exposure time are much larger than the effect of kVp.
It has been shown by many studies that contrast/brightness enhancement is effective for the perception of small contrast details. Similar findings were observed in this study [17-19]. The histogram equalization algorithm converts the histogram of an original image to an equalized histogram; in other words, it changes the use of available grey values and the characteristics of the histogram [3]. The image parts with more frequency variation will be more enhanced, while parts of the image with less frequency will be neglected.
Our results clearly demonstrated that histogram equalization is effective in increasing the number if counted holes even at lower exposures. This also was proven in previous studies [16, 20-23].
The “Poly” algorithm showed the maximum number of counted holes, both the lowest and widest exposure ranges. By re-distributing the grey levels based on the actual thickness of each step with holes, a uniform re-distribution of grey levels in the output range is obtained, and the contents of the image accordingly became clearer to the observers [13].
The difference between number of holes detected at 0.05s and 0.064s is not statistically significant in the images processed with the polynomial algorithm; this means that almost a 20% decrease in exposure time did not affect the image quality, this is consistent with other studies done in the medical field showing that low dose images can be enhanced with post processing, making exposure at high doses unnecessary [23].
CONCLUSION
This study compared the number of visible holes on a step wedge with three different image processing algorithms. The goal was finding the best enhancement algorithm to reliably increase the number of visible holes. Among the algorithms used, the 5thdegreepolynomial model provided subjectively superior images. Further clinical studies needs to be done to confirm the correlation between perceptibility of subtle changes in anatomic structures (e.g. caries, root canal and periapical lesion) and diagnostic accuracy. This might result in reducing the patient’s dose and in simplifying observer performance. This might also facilitate in vivo evaluations of new applications in digital imaging.
CONFLICT OF INTEREST
The authors confirm that this article content has no conflict of interest.
ACKNOWLEDGEMENTS
Declared none.

