All published articles of this journal are available on ScienceDirect.

Relationship Between the Thickness of Cortical Bone at Maxillary Mid-palatal Area and Facial Height Using CBCT
Abstract
Introduction : Orthodontic mini-implants have been incorporated into orthodontic treatment modalities. Adequate bone at mini-implant placement site can influence the success or failure of anchorage. The present study was to determine the thickness of cortical bone in the maxillary mid-palatal area at predetermined points for the placement of orthodontic mini-implants using Cone Beam CT technique in order to evaluate the relationship of these values with the facial height. Materials and Methods : A total of 161 patients, consisting of 63 males (39.13%) and 98 females (60.87%), were evaluated in the present study; 38% of the subjects had normal facial height, 29% had short face and 33% had long face. In order to determine which patient belongs to which facial height category, i.e. normal, long or short, two angular and linear evaluations were used: the angle between S-N and Go-Me lines and the S-Go/N-Me ratio. Twenty points were evaluated in all the samples. First the incisive foramen was located. The paracoronal cross-sections were prepared at distances of 4, 8, 16 and 24 mm from the distal wall of the incisive foramen and on each cross-section the mid-sagittal and para-sagittal areas were determined bilaterally at 3- and 6-mm distances (a total of 5 points). The thicknesses of the cortical plate of bone were determined at the predetermined points. Results : There was a significant relationship between the mean cortical bone thickness and facial height (p<0.01), with significantly less thickness in long faces compared to short faces. However, the thickness of cortical bone in normal faces was similar to that in long and short faces. Separate evaluation of the points showed that at point a16 subjects with short faces had thicker cortical bone compared to subjects with long and normal faces. At point b8 in long faces, the thickness of the cortical bone was significantly less than that in short and normal faces. At point d8, the thickness of the cortical bone in subjects with short faces was significantly higher than that in subjects with long faces. Conclusion : At the point a16 the cortical bone thickness in short faces was significantly higher than normal and long faces. The lower thickness of the cortical bone in the palatal area at points b8 and d8 in subjects with long faces might indicate a lower anchorage value of these points in these subjects.
INTRODUCTION
Provision of anchorage is one of the most challenging aspects of orthodontic treatment planning. Routine and conventional anchorage techniques are generally dependent on patient compliance and usually result in untoward reciprocal tooth movements. To overcome such a problem, orthodontic mini-implants have been incorporated into orthodontic treatment modalities. Adequate bone at mini-implant placement site can influence the success or failure of anchorage; therefore, a large number of studies have been carried out to determine appropriate locations for stability of mini-implants. It is necessary to have knowledge about the thickness of bone to select a proper length for mini-implants to avoid perforation of the nasal cavity. Palatal area is probably the best site for placement of mini-implants, for easy access to that area and a lower risk of injury to important anatomic structures. There are keratinized adhesive tissues in all areas. Moreover, mini-implants placed in this area have the advantage of not interfering with tooth movements [1-9].
Since the facial height is related to morphologic changes induced by genetics and oral breathing during childhood, it is rational that the thickness of bone in patients with different facial heights will be different [10-11]. In a clinical study, one of the parameters determining the success of mini-implants was reported to be the facial height [12].
The aim of the present study was to determine the thicknesses of cortical bone in the mid-palatal area of the maxilla with the use of Cone beam CT technique in patients with different facial heights. Such a study with this sample size has not been carried out to date and the present study was carried out in a population of Iranian patients, referred to the Department of Radiology, Faculty of Dentistry, Tabriz University of Medical Sciences.
MATERIALS AND METHODS
The present descriptive study was carried out on Cone beam CT images of patients referred to the Department of Radiology, Tabriz Faculty of Dentistry, in 2013-2014. The inclusion criteria consisted of all the patients referred to the Radiology Department for any reasons necessitating Cone beam CT imaging, with favorable image quality. The exclusion criteria consisted of the following: malformations or syndromes, anomalies with potential effects on facial height, systemic diseases, history of trauma and surgery of the study area, patients in the mixed dentition period and presence of impacted teeth in the palatal area.
The Cone beam CT images of all the subjects were taken using a NewTom VGI Cone beam CT unit with the following specifications: 15×15-cm field of view; 110 kVp, 1-20 mA, scan time = 18 seconds and voxel size: 0.3 mm. Then the images were reconstructed with NNT viewer software. Twenty points were evaluated in all the samples (Fig. 1).
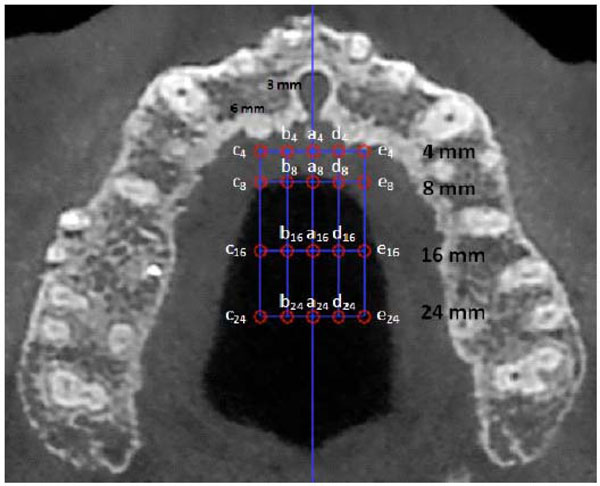
Reference points and lines for measuring the bone thicknesses.
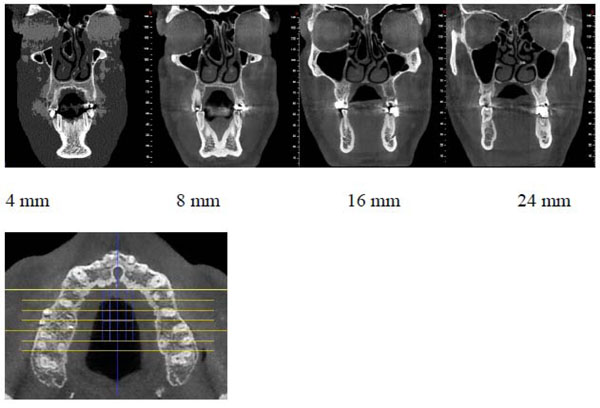
Reconstructed coronal cross-sections at 24-, 16-, 8- and 4- mm distances distal to the posterior wall of the incisive foramen.
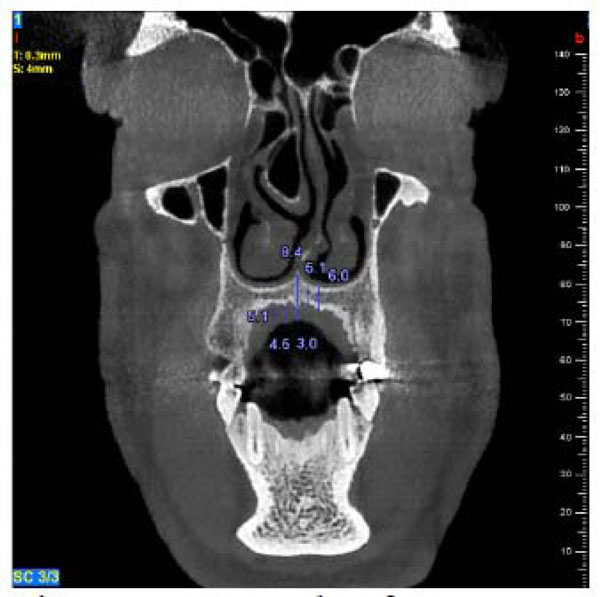
A sample of measurements on each cross-section.
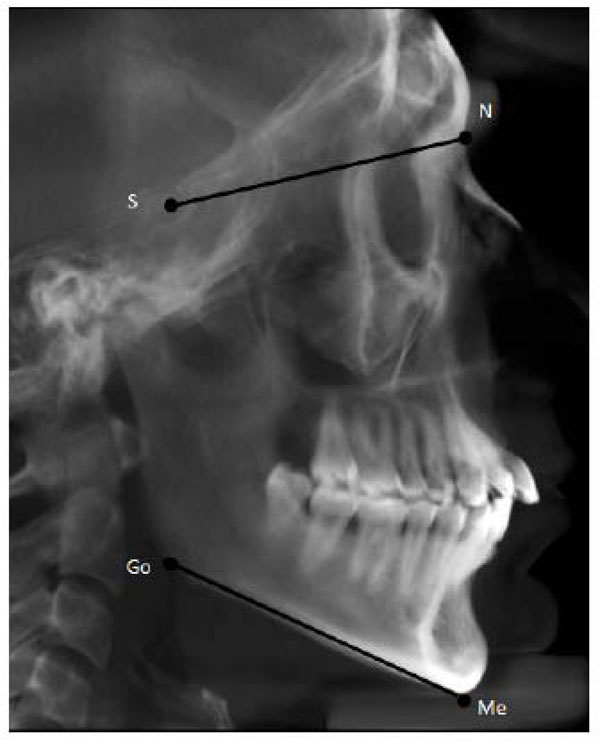
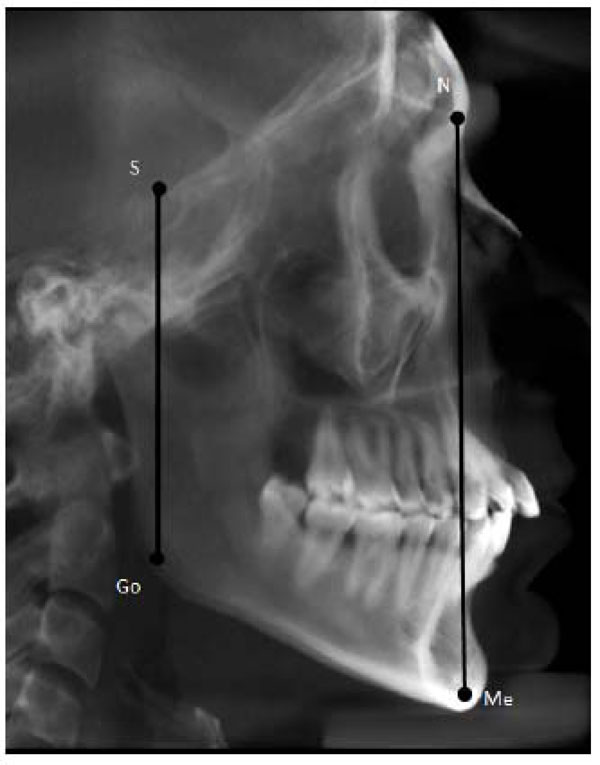
Lateral scout view with it`s angular measurements.
Lateral scout view with it`s linear measurements.
Comparison of cortical bone thickness at the predetermined points in terms of facial height.
| Normal | Short | Long | ANOVA | ||
|---|---|---|---|---|---|
| Mean± SD | Mean± SD | Mean± SD | f | p value | |
| a4 | 1.66±0.60 | 1.66±0.54 | 1.69±0.54 | 0.07 | 0.93 |
| a8 | 1.39±0.45 | 1.53±0.53 | 1.31±0.38 | 3.05 | 0.05 |
| a16 | 1.3±0.43 | 1.52±0.53 | 1.29±0.45 | 3.53 | 0.03 |
| a24 | 1.38±0.52 | 1.36±0.43 | 1.3±0.42 | 0.43 | 0.65 |
| b4 | 1.46±0.48 | 1.43±0.57 | 1.33±0.40 | 1.06 | 0.35 |
| b8 | 1.22±0.32 | 1.19±0.33 | 1.14±0.310 | 3.24 | 0.041 |
| b16 | 1.05±0.41 | 1.17±0.41 | 0.97±0.41 | 2.86 | 0.06 |
| b24 | 1.06±0.44 | 1.14±0.41 | 1.06±0.44 | 0.61 | 0.55 |
| c4 | 1.57±0.54 | 1.54±0.64 | 1.51±0.52 | 0.16 | 0.85 |
| c8 | 1.1±0.42 | 1.06±0.41 | 0.94±0.26 | 2.99 | 0.05 |
| c16 | 0.78±0.36 | 0.83±0.36 | 0.71±0.25 | 1.74 | 0.18 |
| c24 | 0.67±0.30 | 0.71±0.32 | 0.65±0.27 | 0.47 | 0.62 |
| d4 | 1.55±0.56 | 1.52±0.60 | 1.41±0.45 | 0.92 | 0.40 |
| d8 | 1.13±0.40 | 1.22±0.48 | 1.02±0.34 | 3.08 | 0.04 |
| d16 | 1.04±0.37 | 1.12±0.46 | 0.96±0.31 | 2.15 | 0.12 |
| d24 | 1.08±0.45 | 1.09±0.55 | 1±0.33 | 0.66 | 0.52 |
| e4 | 1.53±0.56 | 1.53±0.58 | 1.73±0.69 | 1.86 | 0.16 |
| e8 | 1.02±0.38 | 1.04±0.39 | 1.04±0.36 | 0.07 | 0.94 |
| e16 | 0.79±0.37 | 0.88±0.42 | 0.71±0.29 | 2.49 | 0.09 |
| e24 | 0.67±0.29 | 0.72±0.40 | 0.65±0.27 | 0.66 | 0.52 |
| Cortical bone thickness | 1.17± 0.53 | 1.21± 0.55 | 1.12± 0.51 | 7.548 | .001 |
The results of Tukey`s Honestly significant difference (HSD) tests to evaluate the groups at sample points.
| (I) | (J) | p value | |
|---|---|---|---|
| a16 | Normal | Long | 0.733 |
| Normal | Short | 0.029 | |
| Short | Long | 0.015 | |
| b8 | Normal | Long | 0.022 |
| Normal | Short | 0.134 | |
| Short | Long | 0.043 | |
| d8 | Normal | Long | 0.127 |
| Normal | Short | 0.295 | |
| Short | Long | 0.015 | |
| Cortical bone thickness | Normal | Long | 0.05 |
| Normal | Short | 0.20 | |
| Short | Long | <0.001 |
First, the incisive foramen was located by placing the sagittal and axial views next to each other. The para-coronal cross-sections were prepared at 4-, 8-, 16- and 24-mm distances, respectively, from the posterior wall of the incisive foramen. On each cross-section, the mid-sagittal and para-sagittal areas were determined bilaterally at 3- and 6-mm intervals (5 points on the whole) (Fig. 2). At the pre-determined areas the thicknesses of cortical bone were determined (Fig. 3). All the measurements were made perpendicular to the tissue surface, in mm.
The images were displayed on a 19-inch Philips LCD (liquid crystal display) monitor of a desktop computer, with a resolution of 1024 ×1024 and 32-bit and visualized by an observer twice with an interval of 2 weeks in a windowless dimly lit room.
Patients’ lateral views taken as a scout (Fig. 4 and Fig. 5) were used to assign patients to normal, long and short face groups with the use of angular (the angle between Sella-Nasion and Gonion-Menton lines) and linear (the ratio of Sella-Gonion/Nasion-Menton) evaluations. In relation to linear evaluation, subjects in which the Sella-Gonion/ Nasion-Menton ratio was less than 61% were assigned to the long face group; subject with a ratio between 61 and 69 percent were assigned to the normal group; and subjects in which this ratio was over 69% were placed in the short face group. In relation to angular evaluation, subjects in which the angle between Sella-Nasion and Gonion-Menton lines was less than 27° were placed in the short face group; subjects with a degree between 27 and 37 were placed in the normal face group; and patients with a degree greater than 37° were placed in the long face group [13].
Subjects who were placed in two different groups by the angular and linear evaluations were excluded from the study.
Statistical analysis were carried out with software SPSS 171-way analysis of variance was used for intergroup comparisons, and Tukey`s Honestly significant difference (HSD) tests was used for subgroup comparisons.
Cronbach’s alpha was used to evaluate intra-group correlation to test the validity of the measurement tool. Cronbach’s alpha was calculated for all the 20 points on palatal bone so that the reproducibility of measurements could be determined for evaluation of the accuracy of measurement tool. Alpha values greater than 0.75 indicate the validity of measurement tool, which was >0.75 in the present study for intra-group correlation, indicating that the measurement tool was adequately accurate for measurements (0.89).
RESULTS
A total of 63 (39.13%) of the subjects were male and 98 (60.87%) were female. There was almost a uniform distribution of different facial heights, with 38% of the subjects with normal face, 29% with short face and 33% with long face.
In the present study, the thickness of cortical bone was determined at 20 points in 161 subjects. Table 1 presents the characteristics of cortical bone at the above-mentioned points.
At the point a16 the cortical bone thickness in short faces with a mean of 1.53 mm was significantly higher than normal and long faces (1.30 and 1.29 mm respectively).
In addition, based on the results of post hoc Tukey tests (Table 2), There was no significant difference between long and normal faces. At point b8, the cortical bone thickness, in long faces with a mean of 1.14 mm, was significantly less than that in short faces with a mean of 1.19 mm and in normal faces with a mean of 1.22 mm; however, the cortical bone thickness was similar in subjects with normal and short faces. At the point d8 the cortical bone thickness in long faces with a mean of 1.02 mm, was significantly less than that in short faces with the mean of 1.22 mm. But normal face group has not significant differences with two other facial height groups. In addition, Table 1 shows that cortical bone thickness (the mean of 20 points) was significant in terms of facial height (P<0.01). Based on the results of Tukey test, the thickness with a mean of 1.12 in long faces was significantly less than that in short faces with a mean of 1.21; however, in normal faces with a mean of 1.17, the cortical bone thickness was similar to that in long and short faces.
DISCUSSION
Use of mini-screws has ever-increasingly been advocated in orthodontics in recent years. This type of anchorage has many advantages over conventional anchorage, including an increase in the range of orthodontic movements without application of force on other teeth, an easy scheme to produce force, a decrease in the need for patient’s compliance and ease of placement and removal [5, 6].
Various factors influence the success of mini-implants, including anatomic factors, mini-implants design, oral hygiene, the technique used and the force applied; based on the results of various studies, cortical bone thickness has a specific effect on the success of mini-implants [13].
In the present study, Cone beam CT technique was used to evaluate the thickness and volume of palatal cortical bone. Cone beam CT provides high-resolution images with low radiation dose compared to the CT technique. Cone beam CT provides images of anatomic structures without any superimposition and these images can be used for secondary reconstructions (sagittal, coronal and para-coronal in 3-dimensional images) [14-18]. In the present study, cortical bone thickness was determined at 20 points in the palate and the relationship between cortical bone thickness at these points with the facial height was evaluated; only at 3 points a definite statistical relationship was established. There are few number of studies available on the relationship between cortical bone thickness and the facial height and none of these studies evaluated the relationship between the facial height and cortical bone thickness of maxillary palatal bone.
Ozdemir et al. [13] evaluated the mandibular buccal, maxillary buccal and the alveolar bone of maxillary palate and reported that in all the areas measured in low angle cases cortical bone thickness was clearly higher than that in high angle cases. Tsunori et al. [19] and of Masumoto et al. [20] carried out studies on Asian cadavers and reported a relationship between facial type and the thickness of mandibular cortical bone. They carried out measurements only in the mandible. The discrepancies between the results of different studies might be attributed to factor such as differences in racial traits, evaluations on live subjects or on dry skulls and differences in measurement points.
In the present study the thickness of the cortical bone in the palatal area was measured at 20 points using Cone beam CT technique, similar to other studies, because it is important to correctly and precisely determine cortical bone thickness for the success of mini-implants. Masumoto et al. [20] measured 10 points in the mandible and showed that some of these points have a relationship with the facial type rather than all the points. The results of the present study showed that at point a16 short face subjects had thicker cortical bone compared to subjects with long and normal faces. In addition, at points b8 and d8 subjects with short faces had thicker cortical bone compared to subjects with long faces; however, the thickness was similar in patients with short and normal faces. The lower cortical thickness in long faces patients, might be a reason for a higher risk for loss of mini-implants in at these points”
CONCLUSION
At the point a16 the cortical bone thickness in short faces was significantly higher than normal and long faces. The cortical bone thickness was lower at points b8 and d8 in subjects with long faces, which might indicate a lower anchorage value in these areas. Further studies with a great sample size are necessary to evaluate the relationship between the thickness of cortical bone and facial height.
CONFLICT OF INTEREST
The authors confirm that this article content has no conflict of interest.
ACKNOWLEDGEMENTS
Declared none.

