All published articles of this journal are available on ScienceDirect.

Bacterial 16S rRNA/rDNA Profiling in the Liquid Phase of Human Saliva
Abstract
Human saliva can be separated by centrifugation into cell pellet and cell-free supernatant, which are called cellular phase and liquid phase in this study. While it is well documented that the cellular phase of saliva contains hundreds of oral bacteria species, little is known whether the liquid phase of saliva contains any information related to oral microbiota. In this study, we analyzed the bacterial nucleic acid contents of the liquid phase of saliva. Using primers universal to most eubacterial 16S rDNA, we detected large amounts of bacterial 16S rRNA and rDNA in the cell-free phase of saliva. Random sequencing analysis of forty PCR amplicons from the cell-free phase of saliva led to 15 operational taxonomic unit (OTU) groups. Furthermore, using denaturing gradient gel electrophoresis (DGGE), we compared 16S rRNA/rDNA profiles derived from liquid phases and cellular phases of saliva samples, and found positive correlations (Pearson Correlation=0.822, P<0.001) between these sample groups. These findings indicate that the liquid phase of saliva contains numerous bacterial 16S rRNA/rDNA molecules that have correlations with bacteria existing in the cellular phase.
INTRODUCTION
The oral cavity harbors over 700 microbial species [1, 2]. While the majority of them are normal/commensal bacteria, some of them are opportunistic pathogens responsible for the development of oral microbial infectious diseases such as dental caries and periodontitis [3]. Saliva as an oral circulating fluid is heavily laden with bacteria (108 – 109 cfu/mL) [4]. These salivary bacteria reflect the oral microbiota composition and could serve as an indicator of the health and disease status of oral cavity. For example, salivary bacteria counts have often been used for caries risk assessment [5-7].
Various techniques have been developed to obtain the counts of salivary pathogenic bacteria. As the advances in understanding of bacterial genetics, nucleic acid based detection techniques, including PCR based detection method [8-14] and the “checkerboard” method [15-18], are starting to enjoy more applications. Most nucleic acid based detection methods rely on analyzing bacterial 16S rDNA or rRNA, which has high specificity and sensitivity. Previously, all 16S rDNA or rRNA based saliva studies had been performed using cell pellets derived from whole saliva via centrifugation or filtration (called cellular phase in this study). The subsequent analysis involved bacterial lysis, which may attract some critics that certain bacterial species may be more susceptible to the lysis method than the others. Recently, there have been reports that cell-free supernatants of human saliva after centrifugation or filtration (called liquid phase of saliva in this study) contained extensive viral and human DNAs and RNAs [19-21], which could be detected by some sensitive microelectromechanical systems (MEMS) [22]. These findings prompted us to initiate this study to examine the existence of bacterial 16S rDNA/rRNA in the liquid phase of saliva and their possible correlations with intact bacterial cells in saliva.
MATERIALS AND METHODS
Saliva Collection and Processing
Three male and six female healthy adults aged between 20 to 40 years were recruited (University of California at Los Angeles IRB #04-10-016-01). One milliliter of non-stimulated whole saliva sample was collected from each individual by asking the subject to expectorate into a sterile disposable plastic cup. The saliva samples were then centrifuged at 13.2 ×1000 rpm for 30 min. The supernatant was filtered through a 0.2 µm filter (Millipore Inc., Billerica, MA). Both the cell pellet (cellular phase) and the supernatant (liquid phase) of the whole saliva were processed for nucleic acid isolation.
Nucleic Acid Isolation
To isolate nucleic acids from the cellular phase of saliva, cell pellets were re-suspended in 0.5 ml TE buffer (Tris-EDTA, pH7) containing 0.1 ml phenol. The resuspended cells were mechanically disrupted by using a homogenizer for 2 min at 4°C. Cell debris was removed by centrifugation, and the supernatant was used to extract the nucleic acids. Proteins within the supernatant were removed with phenol-chloroform extraction and the total nucleic acids within the supernatant were precipitated by isopropanol in the presence of 0.3 M sodium acetate, air dried, and resuspended in 50 µl of TE buffer. To isolate nucleic acids from the liquid phase of saliva, the filtrate was extracted once with phenol-chloroform to remove protein components, and the supernatant was precipitated with isopropanol in the presence of 0.3 M sodium acetate. The pellet was washed with 70% ethanol, air-dried, and resuspended in 20 μl TE buffer.
Detection of Bacterial 16S rRNA and rDNA
PCR and RT-PCR assays were used to detect bacterial 16S rDNA and rRNA in the cellular and liquid phases of saliva, respectively. For detection of 16S rDNA, the nucleic acid preparations were directly used as templates for PCR reactions without reverse transcription. For detection of 16S rRNA, the nucleic acid preparations were reverse transcribed to cDNA using Superscript II Reverse Transcriptase (RT) (Invitrogen, Carlsbad, CA) and random hexamer primers (Invitrogen) following the manufacture’s instruction before served as templates for PCR reactions. The rRNA profiles were obtained via comparison between samples treated with PCR and RT-PCR.
The primer pair BA968F/BA1401R (5’-AACGCGAAG AACCTTAC -3’/ 5’-CGGTGTGTACAAGACCC -3’) [23] was used to detect 16S rDNA/rRNA. The PCR reaction mixture (50 µl) contained 0.1 to 1 ng of template DNA/cDNA, 200 µM of each dNTP, 40 pM of each primer, 4.0 mM of MgCl2, 5 μL of 10 × PCR buffer II, and 2.5 U of Taq DNA polymerase (PE Applied Biosystems). The PCR conditions were as follows: initial denaturation at 94°C for 3 minutes and 35 cycles consisting of 1 minute at 94°C, 1 minute at 56°C, and 2 minutes at 72°C, plus an additional cycle of 7 minutes at 72°C for chain elongation.
The resulting PCR fragments using the nucleic acids isolated from the cellular phase as the templates were labeled as Sample Group 1 (#1-9). The nucleic acids isolated from the liquid phases were subjected to reverse transcription first, then subjected to regular PCR reactions, resulting Sample Group 2 (#11-19). For Sample Group 3, the nucleic acids isolated from the liquid phases were directly subjected to PCR reactions, resulting samples (#21-29).
PCR-Based Denaturing Gradient Gel Electrophoresis (DGGE) Assay
A set of 16S rDNA universal primers, BAC1 and BAC2 [24] was used to generate PCR product for DGGE analysis. A 40-nucleotide GC-clamp was added to the 5’ end of BAC1 [25, 26]. BAC1-GC (5-CGCCCGCCGCGCCCCGCGCCCGTCCCGCCGCCCCCGCCCGCCTACGGG-AGGCAGCAG-3’) corresponds to nucleotide position 341 in the E. coli sequence [24], and BAC2 (5’-GGACTACCAGGGTATCTAATCC-3’) corresponds to position 730 in the E. coli sequence (EF418614). PCR reactions were performed using the same condition as described above. The PCR products were evaluated by electrophoresis in 1.0% agarose gels run at 100 V for 60 minutes, and the size of all amplicons (300 bp) was confirmed according to a standard control described in Li et al. [27].
20 µl of each PCR-amplified product was loaded on the DGGE gel and was separated with the Bio-Rad DCode System (Bio-Rad, Hercules, CA). The same system was used for all DGGE experiments of this study. A 30% to 70% linear DNA denaturing gradient (100% denaturant is equivalent to 7 M/l of urea and 40% deionized formamide) was formed in 8% (w/v) polyacrylamide gels. PCR products were directly loaded in each lane, and electrophoresis was performed at a constant 60 V at 58°C for 16 hours in 1 × Tris-Acetate-EDTA (TAE) buffer (pH, 8.5). After electrophoresis, the gels were rinsed and stained for 15 minutes in water containing 0.5 μg/ml of ethidium bromide followed by 15 minutes of destaining in water. DGGE images were digitally captured and recorded with the AlphaImager 3300 System (Alpha Innotech Corporation, San Leandro, CA).
Analysis of Microbial Profiles by DGGE
DGGE gel images were converted and transferred into a microbial profile database with Fingerprinting II Informatix™ Software (Bio-Rad). Each gel was normalized according to the species-specific DGGE standard markers; the background was subtracted with mathematical algorithms according to the spectral analysis of an overall densitometric curve. A 1.0% minimal profiling setting was used for band search for all DGGE gels. Levels of similarity between the fingerprints were calculated according to the Dice coefficient; the microbial compositions were assessed by measuring the total number of detected bands in all DGGE gels. The differences in the DGGE fingerprinting profiles of PCR-amplified 16S rDNA segments were compared among the three sample groups. Analysis of variance (ANOVA) and Pearson Correlation were used for statistical analyses using SPSS 13.0 programs (Statistical Package for the Social Sciences, version 13.0, SSPS Inc, Chicago, IL). All P values less than 0.05 were 2-tailed.
Random Cloning of PCR Products and Sequencing
PCR products (300 bp) generated from the reverse transcription reaction mixture of the liquid phase nuclei acids were cloned into pCR®2.1-Topo® (Invitrogen) according to the procedure of manufacturer’s recommendation. Forty positive clones were randomly selected for sequencing. Sequence reactions were performed in the UCLA sequence facility using the primer BAC2. The sequences were used for BLAST search.
RESULTS
Detection of Bacterial 16S rRNA and rDNA in Cellular and Liquid Phases of Saliva
As described in Materials and Methods, sample group 1 (#1-9) contains 16S rDNA from the cellular phase, sample group 2 (#11-19) contains both 16S rDNA and rRNA from the liquid phase, and sample group 3 (#21-29) contains 16S rDNA from the liquid phase. It is worthwhile to mention that samples ending with the same digital number (such as 1, 11 and 21) are from the same subject. The PCR products of the expected size were detected from all samples from all sample groups, indicating that bacterial 16S rDNA/rRNA molecules not only existed in cellular phase, but also in liquid phase of saliva.
DGGE Analysis of the Diverse 16S rRNA/rDNA Species Present in Saliva
We adapted the DGGE technique for profiling the 16S rRNA/rDNA species present in the cell-free phase of saliva, in comparison with 16S rDNA composition in the cellular phase of saliva. A 16S specific primer pair (BAC1 and BAC2) with a 40-nucleotide GC-clamp (see Materials and Methods) was used to create PCR products within the same sample groups as described above. The DGGE analysis of these PCR products is shown in Fig. (1). While some bands are present in all three sample groups, there are clear differences between three groups as well.
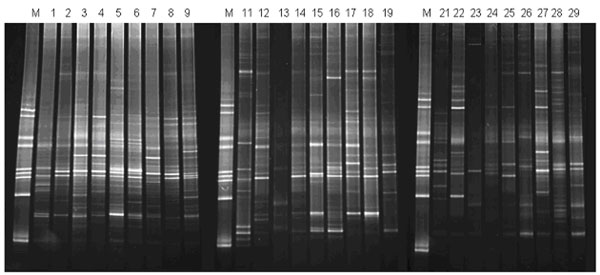
DGGE analysis of 16S rDNA/rRNA in the cellular and liquid phases of saliva. M, species-specific DGGE standard markers (21); sample #1-9 (sample group 1), 16S rDNA from cellular phase of saliva; sample #11-19 (sample group 2), 16S rDNA/rRNA from liquid phase of saliva; sample #21-29 (sample group 3), 16S rDNA from liquid phase of saliva. See Materials and Methods for experimental procedures and the description of the sample groups and analysis results.
We performed detailed analysis of these DGGE gels, using Fingerprinting II Informatix™ Software (Bio-Rad). A total of 91 distinct bands were detected. 57 bands (62.6%) were presented in all three sample groups. As shown in Fig. (1), the cellular phase contains the most abundant 16S rDNA amplicons, the mean detectable bands in DGGE was 31 ± 1.6 (SD). The liquid phase of saliva contains both detectable 16S rDNA and 16S rRNA (comparing the PCR amplicon profiles of the RT and no-RT samples from the same individual, i.e. #11 and #21). The mean detectable bands were 23.1 ± 2.3 (SD) for sample group 2 and 24.4 ± 6.9 (SD) for sample group 3. The difference between the abundance of 16S amplicons among the three sample groups was statistically significant (p = 0.007, ANOVA). The similarities of DGGE profiles were 49.5% and 50.1% between group 1 and group 2 and group 1 and group 3, respectively. The similarity of DGGE profile was slightly higher (54.1%) in comparison of group 2 with group 3. Interestingly, there was a significant correlation (P < 0.001, Pearson Correlation = 0.822) in the similarities between the RT and no-RT PCR amplicons of the cell-free phase DGGE profiles compared to that of the cellular phase.
Identification of the 16S rRNA/rDNA Species in the Cell-Free Phase of Saliva
To further characterize the 16S rRNA/rDNA species in saliva, over 100 PCR products of 300 bp from the liquid phase samples were randomly cloned. Forty positive clones were randomly selected among these clones for further sequence analysis. By comparing the sequences with known 16S rRNA/rDNA sequences in the GenBank, we assigned the sequences to 15 operational taxonomic unit (OTU) groups. With >99% sequence similarity as the cutoff value, we listed the closest representative for each OTU group in Table 1.
16S rDNA Sequences Identified from Liquid Phase of Saliva
| Operational Taxonomic Units | Closest Relative | % Sequence Similarity | Accession no. |
|---|---|---|---|
| O-1 | Uncultured Actinomyces sp. | 100 | AF385522 |
| O-2 | Uncultured Aquabacterium sp. | 100 | AF523025 |
| O-3 | Uncultured Bacteroidetes | 100 | X85208 |
| O-4 | Diaphorobacter nitroreducens | 99 | AB076856 |
| O-5 | Terrahaemophilus aromaticivorans | 99 | AB098612 |
| O-6 | Oribacterium sinus | 99 | AY323228 |
| O-7 | Uncultured Prevotella sp. | 100 | AY684414 |
| O-8 | Uncultured Veillonella sp. | 99 | AF366266 |
| O-9 | Granulicatella adiacens | 99 | D50540 |
| O-10 | Streptococcus mutans | 99 | AE014133 |
| O-11 | Streptococcus sanguinis | 99 | AF003928 |
| O-12 | Streptococcus oralis | 100 | AY485602 |
| O-13 | Uncultured Streptococcus dysagalactiae | 99 | AF371509 |
| O-14 | Streptococcus thermophilus | 99 | CP000024 |
| O-15 | Streptococcus mitis | 100 | DQ232534 |
DISCUSSION
Despite the vast information known about the bacteria from whole saliva, little is known about the liquid phase of saliva with respect to the oral microbiota. Although it is known that the cell-free phase of human saliva contains viral and human RNAs [19-21], the presence of bacterial 16S rRNA and rDNA in the liquid phase of saliva has not been looked at before. By using a pair of 16S rDNA primers universal to most eubacteria, we showed in this study that both bacterial rRNA and rDNA exist in the liquid phase of saliva.
In this study, we applied DGGE technique to study the pattern of rRNA/rDNA in liquid phase and cellular phase of saliva. DGGE has been one of the common tools routinely used for microbial diversity and population dynamics studies in a variety of ecosystems [28]. This technique has been successfully applied in the study of microbial profiles within the oral cavity to characterize eubacterial 16S rDNA fingerprints of human saliva and dental plaque microcosm biofilms grown in the multi-plaque artificial mouth [29] and to correlate the diversity of the oral microbial population and active dental caries [27]. The technique is based on polymorphism of the 16S DNA variable regions among different bacteria and enables microbial community profiling assessments that do not rely on bacterial culturing. In general, a 300-500 base pair (bp) DNA fragment from the 16S rDNA region is amplified by PCR along with a 40-bp GC clamp incorporated at the 5' end of one of the PCR primers to prevent total denaturation of the PCR product. The PCR product is then subjected to denaturant (urea) gradient gel electrophoresis (DGGE). During electrophoresis, different 16S rDNA species are separated based on their sequence compositions. In this study, our DGGE analysis results demonstrate that each individual has his/her unique pattern of rRNA/rDNA species. Further analysis of pattern recognition using our DGGE results reveals that there was a significant correlation in the 16S rDNA amplicons detected between the cellular and liquid phases of saliva within each individual, indicating its possible application in monitoring microbial profile in oral cavity [30, 31]. However, there were differences between 16S rDNA amplicons detected in the cellular and liquid phase of saliva. For example, there is a high-molecular weight band present in samples 16 and 26 (derived from the liquid phase of saliva) that appears to be absent in sample 6 (derived from the cellular phase) (Fig. 1). This indicated that the 16S rDNA amplicons detected in the liquid phase of saliva is not necessary the fragment of 16S rDNA in cellular phase of saliva.
In this study, we employed the PCR-cloning-sequencing technique to analyze the 16S rRNA/rDNA in the liquid phase of saliva. The advantage of this method is that it includes both cultivable and uncultivable bacteria, allowing the complete analysis of complex bacterial communities. It is estimated that only about 50% of bacterial species in the oral microbiota are cultivable [32]. It is only with the advent of molecular biology that techniques have become available for studying mixed bacterial communities in their entirety, without the biases of culture [32]. Applying this method, a substantial number of novel taxa have been identified in molecular studies of gingivitis [33] and periodontitis [34]. Our analysis of 16S rRNA in liquid phase of saliva indicated that about 50% of 16S rRNA in cell-free phase of saliva is from uncultivable bacterial species, consistent with previous estimate. It is interesting to note some species found in this study were first identified from other biological niches or from the environment. For example, AY684414 was originally isolated from intestinal flora; AF523025 was first discovered from a DNA sample derived from mineral water; and AB098612 was identified from a DNA sample derived from petroleum. At this point, we do not know whether these rRNA/rDNA molecules are derived from the bacteria in normal oral microbial flora or the bacteria within the foods or water taken by the study subjects.
In this study, we identified some oral streptococcal 16S rRNA/rDNA in the liquid phase of saliva (Table 1). This raises the possibility that other oral streptococcal genes may be represented in saliva. In vitro transformation of oral streptococcal antibiotic-resistance genes into Streptococcus pneumoniae has been demonstrated [35], as has transformation of an oral streptococcus in human saliva [36]. Our findings suggest that the oral streptococcal antibiotic resistance may spread via saliva.
The findings from this study that abundant bacterial DNA and RNA exist in the liquid phase of saliva opens a new possibility for oral pathogen detection since the liquid phase of saliva could be directly used for 16S rDNA/rRNA detection without lysis of bacterial cells. This will not only reduce the sample processing procedure and consequently time, but also minimize the sampling processing variability. While the findings described in this study creates a great new opportunity for oral pathogen detection, much more work yet need to be done to validate the concept that 16S rDNA/rRNA in the liquid phase of saliva could be indeed applicable for the diagnosis of oral microbial infectious diseases.
ACKNOWLEDGEMENTS
This work was supported in part by NIH grants U01-DE15018 (D.Wong), R01-DE014757 (F. Qi), R03-DE01-5706 (Y. Li) and Delta Dental grant (W. Shi).

