All published articles of this journal are available on ScienceDirect.

Modified Golden percentage for an Anterior Aesthetic -A Morphometric Analysis
Authors Info & Affiliations
Abstract
Background:
Golden Proportion, Preston’s Proportion, RED Proportion, and Golden Percentage are the most common theories suggested in the literature to be used for smile analysis and design.
Objectives:
The aim of this study was to evaluate the occurrence of these four dental aesthetic proportions in a Saudi sample and alternatively propose a modified method for anterior teeth analysis.
Materials and Methods:
The Standardized frontal image of the dentition of 200 selected students was taken. The proportions (Golden Proportion, Preston’s Proportion, RED Proportion, and Golden Percentage) of the maxillary anterior teeth photographs were analyzed using Adobe Photoshop software. One-sample t-test was used and the p-value was taken significantly when less than 0.05 [p<0.05] and a confidence interval of 95%.
Results:
The assessed Golden Proportion values showed a statistically significant difference from the standard value (62%; p-value < 0.05), Preston’s Proportion showed an insignificant difference from the standard values (p-value > 0.05), Golden Percentage, showed that as much as 77% of 12 teeth and 77.5% of 22 teeth conformed to it. The average mathematically rounded percentages found in this study are as follows: 13%, 15%, 22%, 23%, 15%, and 12%, respectively. No complete matching to RED Proportion was found in any sample.
Conclusion:
All tested proportions except Golden Percentage did not conform to standard values and thus have limited application in anterior teeth analysis in the studied population. The proposed modified Golden Percentages in this study are more representative and recommended for smile design for the Saudi population.
1. INTRODUCTION
Dental and facial aesthetics are impressively influenced by the size and form of the anterior maxillary teeth. Therefore, the literature has attempted to establish a geometrical pattern of the maxillary anterior teeth for a long time. The Golden Proportion, Preston's Proportion, Recurrent Esthetic Dental (RED) Proportion, and Golden Percentage are theories that apply mathematical and geometrical relations to the anterior maxillary teeth.
In an era of increasing use of digital dentistry, different software programs have been developed to assist clinicians in performing comprehensive dentofacial analysis that can be used for diagnosis, treatment plan, and communication with the patient and technician for more treatment outcome predictability. Unlike two-dimensional analysis, three-dimensional assessment is more complex but provides highly reliable information using precise point references and planes. This helps to determine the accurate morphology, position, and orientation of anatomical structures [1]. However, as most digital software programs are expensive and difficult to use, some clinicians nowadays still prefer to use conventional two-dimensional smile analysis.
The Golden Proportion is originally a terminology found in nature and art, although this phrase seems familiar in aesthetic dentistry. Golden Proportion [2, 3], as shown in Fig. (1), is an aesthetic ratio of 0.618, which means the perceived width of the maxillary lateral incisor should be approximately 62% of the perceived width of the central incisor, whereas that of the canine should be similarly related to the lateral incisor.
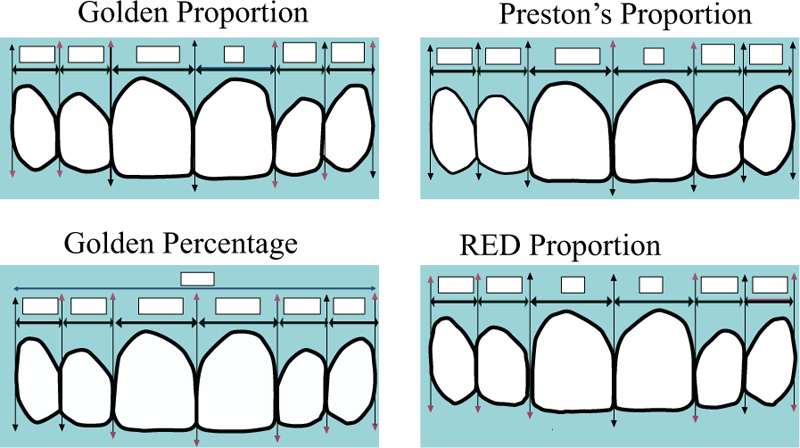
Preston’s Proportion [4] is another suggested aesthetic ratio used in cosmetic dentistry. It proposed that the maxillary lateral incisor should be 66% of the central incisor width, and canines should be 84% of the lateral incisors' width when viewed from the frontal side (Fig. 1).
The golden percentage [5] was calculated by dividing the width of each central incisor, lateral incisor, and canine by the total width of all six maxillary anterior teeth and multiplying the resulting value by 100. Each central incisor's viewed width should be 25% of the maxillary inter canine distance, each lateral incisor should be 15%, and each canine should display 10% of the maxillary inter canine distance (Fig. 1).
For RED Proportion (Fig. 1), it was described [6] as the proportion of the successive width of the teeth remaining constant when progressing distally from the midline. The Constant values indicate the existence of RED proportion. The exact value of the proportion can differ between patients depending on the heights of the anterior maxillary teeth. Several studies have analyzed these four proportions in different groups and ethnicities. In a study conducted in Turkey, Hasanreisoglu et al. 2005 [7], showed that no statistically significant golden ratio or any other continuous proportion for the anterior teeth was found in the population studied. Another study [8] targeted the Malaysian population revealed that the golden proportion was not found to exist between the perceived widths of anterior maxillary teeth. In their study undertaken in a young Irish population, codon et al., 2011, [9] found that the Golden Proportion guidelines could only be applied to the lateral incisor / central incisor widths. Aziz and Hossain, 2017 [10] have tested the validity of mathematical proportions in anterior maxillary teeth among the Bangladeshi population and found that the Golden Proportion, Golden Percentage, and the RED Proportion cannot be used as constant proportions to create a harmonious proportion. In an Indian population, Shetty et al. 2011, [11] conducted a study that showed RED Proportion was not seen in the tested natural dentition. Although numerous studies have tested these proportions in other countries and ethnicities with variations in resulted measurements and percentages [7-13] no studies in Saudi Arabia have evaluated all these four proportions' prevalence and value. Hence, this study aims to evaluate the occurrence of the Golden Proportion, Preston’s Proportion, RED Proportion, and Golden Percentage in a Saudi population and alternatively propose a modified method for anterior teeth analysis.
2. MATERIALS AND METHODS
The sample size was calculated with public service of creative research systems survey software (creative research systems, version 9, Petaluma, California, United States). The population tested was Saudi students in the College of Dentistry, King Khalid University (KKUCOD). 230 individuals with intact natural maxillary anterior teeth were invited to participate in this study, considering the estimated sample size at a 5% margin of error with a 95% confidence interval. Based on the inclusion and exclusion criteria, 30 participants were excluded, and the remaining 200 subjects were included in this study. Thus, a total of 200 students from the college of dentistry, King Khalid university (KKUCOD), were selected according to the inclusion and exclusion criteria. The inclusion criteria were [1]: complete maxillary anterior dentition [2]; no periodontal disease [3]; no interdental spacing, crowding, or any other orthodontic issues [4]; no anterior restoration with significant size; and [5] absence of carious or non-carious tooth surface loss. The exclusion criteria were as follows [1]: presence of gingival or dental abnormalities [2]; apparent loss of tooth structure due to fracture, caries lesions, or non-carious lesions; and [3] recognizable direct or indirect restorations. The written informed consent was obtained from all subjects before their participation. This study was conducted in compliance with the protocol; ethical approval was obtained from the ethical committee at KKUCOD, College of Dentistry (Approval No. IRB/KKUCOD/ETH/2020-21/047 ).
A standardized frontal image of each student's dentition was taken using Canon EOS 800D digital camera with a 100 mm macro lens and ring flash. The camera settings, lighting, and staging were kept constant. The upper lip was retracted in all photographs to display the anterior maxillary teeth.
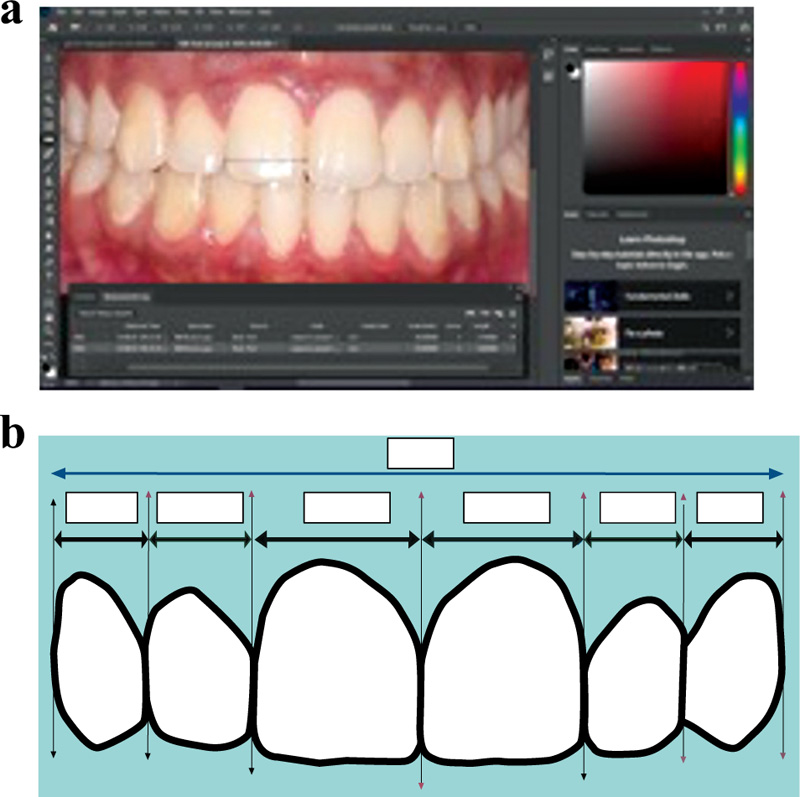
The proportions of the anterior maxillary teeth photographs were analysed using Adobe Photoshop software, version 22.0 (Fig. 2a and b). The maximum width of the studied teeth was measured using the scale tool provided in the software. The observed widths of teeth were calculated from the most mesial point of a tooth to the same tooth's most distal point. For the determination of most mesial and distal points on the tooth, the tangent was drawn and the point of contact with the tooth was considered as the point of interest. All records were made by the chief researcher trained to use the camera and software. This recording procedure was repeated twice and an average of two values was used for statistical analysis. Each sample recording was done again at an interval of 2 weeks to reduce the intra operator error. All measurements were recorded and analysed using Microsoft Excel. After tabulation of the collected data, it was coded and entered in statistical SPSS software (IBM Statistical Package for Social Science, version 22 SPSS, Inc. Chicago, IL).
In this study, Golden and Preston’s Proportions were assessed by dividing the perceived widths of the central incisor and canine by the lateral incisor's perceived width. Central incisor to lateral incisor and canine to lateral incisor width ratios and percentages were recorded for each image on both sides of the anterior maxillary teeth, and then the calculated values were compared with the expected Golden Proportion and Preston's Proportion values of the related teeth. Furthermore, the average proportion among the data was calculated and compared to the exact Golden and Preston’s Proportion values using a one-sample t-test.
the third tested theory assessed the Golden Percentage by measuring each maxillary anterior tooth's width and dividing each value by the intercanine distance. Subsequently, the same statistical analysis as Golden and Preston's Proportion was applied to the resulting values.
For RED Proportion, the concept was tested by comparing the difference between lateral incisor to central incisor and canine to lateral incisor. Constant values with less than 1% indicate the existence of a RED proportion.
Standard values were estimated for each proportion, and samples were compared to standard value.The descriptive analysis based on the frequency and percent distribution was done for all samples according to matching status for the standards matching the standard, below the standard, or above the standard. The average proportions and percentages using the mean and standard deviation were calculated for each type of measure Golden Proportion, Preston’s Proportion, Golden Percentage, and RED Proportion. The p-value was taken as significant when less than 0.05 (p<0.05) and a confidence interval of 95% was taken.
3. RESULTS
A total of 200 pictures were reviewed to assess dental aesthetic proportions based on Golden Proportion, Preston’s Proportions, and Golden Percentage besides RED Proportion. Considering Golden Proportions, the exact 16.5% of maxillary right lateral incisor MRLI teeth matched the standard value +/- 1 compared to 18% of maxillary left lateral incisor MLLI teeth, 3% of left maxillary canine MLC teeth, and 1% of maxillary right canine MRC teeth. The mean golden proportion for MRLI teeth was 65.5% compared to 65.6% for MLLI teeth, 87.2% for MRC teeth, and 83.4% for MLC teeth (Table 1). All values showed statistical significance of the standard value 62%; p-value < 0.05 for all. This suggests that this study sample, on average, did not conform to the Golden Proportion. Ranges of proportions were narrow for the Golden Proportion of MRLI and MLLI teeth, while the ranges were wide for the Golden Proportion of MRC and MLC teeth.
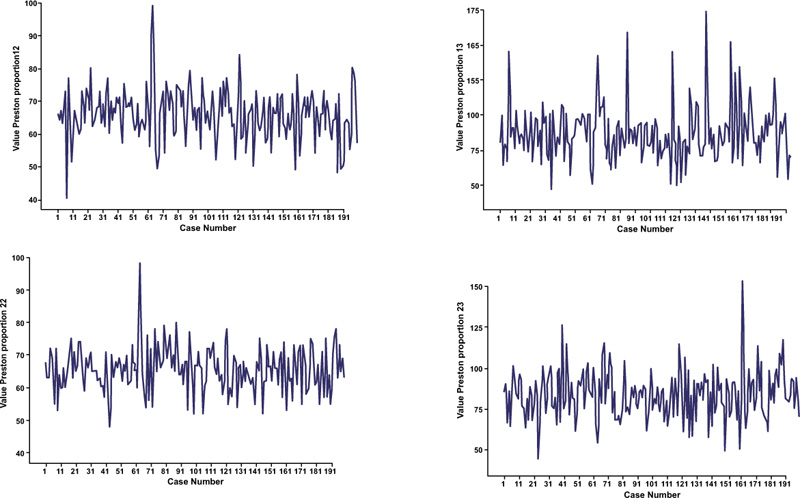
Table 2 illustrates matching to Preston’s Proportion standards among studied teeth. Matching the standards was detected among 22.5% of MLLI teeth, 18% of MRLI teeth, 7.5% of MLC teeth, and 5.5% of MRC teeth. The mean Preston’s Proportion was 65.6% for MLLI teeth compared to 65.5% for MRLI teeth, 83.4% for MLC teeth, and 87.2% for MRC teeth. Only Preston’s Proportion of MRC teeth showed a significant difference in the standard value 84%; p-value = 0.020, while others showed an insignificant difference in the standard values p-value > 0.05. Preston's proportion ranges were narrow for teeth 12 and teeth 22, while it was wide for teeth 13 and teeth 23. The large variance among the sample indicates the small prevalence of this proportion, which suggests limited value and relevance.
| Golden Proportion | Below Standard | Match Standard | Above Standard | Range | Mean ± SD | P-value | |||
|---|---|---|---|---|---|---|---|---|---|
| No | % | No | % | No | % | ||||
| MRLI Golden Proportion | 39 | 19.5% | 33 | 16.5% | 128 | 64.0% | 40-99% | 65.5% ±7.6% | .042* |
| MRC Golden Proportion | 10 | 5.0% | 2 | 1.0% | 188 | 94.0% | 47-174% | 87.2% ±18.9% | .001* |
| MLLI Golden Proportion | 39 | 19.5% | 36 | 18.0% | 125 | 62.5% | 48-98% | 65.6% ±6.6% | .036* |
| MLC Golden Proportion | 7 | 3.5% | 6 | 3.0% | 187 | 93.5% | 44-153% | 83.4% ±14.4% | .001* |
| Preston’s Proportion | Below Standard | Match Standard | Above Standard | Range | Mean ± SD | P-value | |||
|---|---|---|---|---|---|---|---|---|---|
| No | % | No | % | No | % | ||||
| MRLI Preston’s Proportion | 85 | 42.5% | 36 | 18.0% | 79 | 39.5% | 40-99% | 65.5% ±7.6% | .431 |
| MRC Preston’s Proportion | 90 | 45.0% | 11 | 5.5% | 47 | 49.5% | 47-174% | 87.2% ±18.9% | .020* |
| MLLI Preston’s Proportion | 84 | 42.0% | 45 | 22.5% | 71 | 35.5% | 48-98% | 65.6% ±6.6% | .384 |
| MLC Preston’s Proportion | 98 | 49.0% | 15 | 7.5% | 87 | 43.5% | 44-153% | 83.4% ±14.4% | .580 |
| Golden Percentage | Below Standard | Match Standard | Above Standard | Range | Mean ± SD | P-value | |||
|---|---|---|---|---|---|---|---|---|---|
| No | % | No | % | No | % | ||||
| MRCI Golden Percentage | 164 | 82.0% | 35 | 17.5% | 1 | 0.5% | 20-27% | 22.4% ±1.2% | .036* |
| MRLI Golden Percentage | 34 | 17.0% | 154 | 77.0% | 12 | 6.0% | 10-21% | 14.7% ±1.5% | .076 |
| MRC Golden Percentage | 3 | 1.5% | 52 | 26.0% | 145 | 72.5% | 7-27% | 12.6% ± 2.3% | .033* |
| MLCI Golden Percentage | 165 | 82.5% | 35 | 17.5% | 0 | 0.0% | 19-26% | 22.5% ± 1.3% | .034* |
| MLLI Golden Percentage | 32 | 16.0% | 155 | 77.5% | 13 | 6.5% | 11-22% | 14.7% ±1.4% | .077 |
| MLC Golden Percentage | 3 | 1.5% | 59 | 29.5% | 138 | 69.0% | 7-18% | 12.1% ± 1.6% | .033* |
Matching to Golden Percentage standards among studied teeth is shown in Table 3. The matching standard was detected among 77.5% of MLLI teeth, 77% of MRLI teeth, 29.5% of MLC teeth, 26% of MRC teeth, 17.5% of maxillary right central incisor MRCI teeth, and maxillary left central incisor MLCI teeth. The average percentage of inter canine distance covered by MLLI teeth was 14.7%, the same as MRLI teeth, while other tooth types covered 12.1% for MLC teeth, 12.6% for MRC teeth, and 22.5% for MLCI teeth, and 22.4% for MRCI teeth. The statistical significance of the standard percentage was reported for all studied tooth types except MRLI and MLLI tooth types. As much as 77% of MRLI teeth and 77.5% of MLLI conformed to Golden Percentage.
Table 4 demonstrates RED Proportion matching among studied teeth. The mean values were 65.6% for MRLI teeth, 65.6% for MLLI teeth, 87.1% for MRC teeth, and 83.4% for MLC teeth, with no complete matching at any sample. This suggests the sample did not conform to RED Proportion.

| Teeth | Range | Mean | SD | Matching |
|---|---|---|---|---|
| MRLI | 40-99% | 65.6 | 7.6 | Total mismatch |
| MRC | 47-174% | 87.1 | 19.0 | |
| MLLI | 48-98% | 65.6 | 6.6 | |
| MLC | 44-153% | 83.4 | 14.4 |
4. DISCUSSION
Golden Proportion is still used nowadays in many dental schools to teach students basic dental aesthetics. Alternatively, various concepts have been proposed in the literature to achieve standard anterior dental aesthetic proportions. However, no one of these proportions has yet been proven to be completely applied to all populations and genders.
In this study, the most common four dental aesthetic proportion theories have been examined in local populations to comprehend which one accurately represents a naturally aesthetic smile. When the Golden Proportion was tested, all values showed the statistical significance of the standard value (62%; p-value < 0.05 for all). This suggests that on average, this study sampledid not conform to the Golden Proportion (Fig. 3).
Unlike the results of Condon et al. 2011, [9] study, which showed that the Golden Proportion exists in the central to lateral ratio, the ranges of proportions in this study were narrow for the Golden Proportion of MRLI and MLLI teeth while the ranges were wide for Golden Proportion of MRC and MLC teeth. These findings are very similar to samples that matched the standard proportions in just a few studies. For instance, Aziz and Hossain 2017, [10] showed that Golden Proportion between maxillary central and lateral incisor was found in 16% of males and 18% of females; and the Golden Proportion between maxillary lateral incisor and canine was found in 2% of males and 6% of females. Also, in a study conducted by Azam et al. 2014, [13] Golden Proportion was found to be 10% of lateral to central incisor ratio on both sides and 2% of canine to lateral incisor ratio on the right side, and 6% on the left side. In conclusion, the present trial supports many studies [8, 14, 15] that showed limited clinical relevance of the Golden Proportion.
Regarding Preston’s Proportion, the current study results are like previous studies carried out in different populations [4, 16]. As in a recent study conducted in the UK [16], the present study revealed that the examined teeth showed an insignificant difference of the standard values [p-value > 0.05]. However, only values of MRC teeth showed a significant difference from the standard value [84%; p-value = 0.020]. Preston’s Proportion ranges were narrow for teeth 12 and teeth 22, while it was wide for teeth 13 and for teeth 23 (Fig. 4). Inconsistent with the studies by Condon M.et al. [9]; Aziz and Hossain, [10], and Mahshid et al. [3], the large variance among the sample of this study indicates the small prevalence of Preston’s proportion, suggesting it is of limited value and relevance.
The third tested theory, Golden Percentage, shows that the average percentage of inter-canine distance covered by MLLI teeth was 14.7% as same as MRLI teeth; while other tooth types covered 12.1% for MLC teeth, 12.6% for MRC teeth, and 22.5% for MLCI teeth, and 22.4% for MRCI teeth. All percentages from the most right-side tooth [MRC] to the most left-side tooth (MLC) are mathematically rounded to the nearest whole number as following: 13%, 15%, 22%, 23%, 15%, and 12%, respectively. Even though the values of central incisors are slightly lower, and the values of the canines are slightly higher than those suggested by Snow S R, [5], who proposed a value of 25% for central incisors and 10% for canines, these percentages can be in total consistency with those suggested by Ali Fayyad et al. [12], who conducted research targeted the same ethnicity as the present study – the Arab subjects. The study found that a value of 23% for central, 15% for laterals, and 12% for canines are the percentages that can be more applicable to natural dentition. Several other studies [10, 14-16] from different ethnicities have reported comparable results. In the present trial, the statistical significance of the standard percentage was reported for all studied tooth types except MRLI and MLLI tooth types. As much as 77% of MRLI teeth and 77.5% of MLLI conformed to Golden Percentage. These findings are consistent with similar numbers for the same teeth in another study by Kalia R., 2020, where 71.5% of examined lateral incisors conformed to the Golden Percentage. Therefore, the average percentages found in this study, the Proposed Modified Golden Percentage (Fig. 2b), are more representative and are recommended for smile design principles for the Saudi Arabia population.
As seen in Table 4, no complete matching to RED Proportion was found at any sample. This reveals that the tested teeth did not conform to RED Proportion. Many studies [9, 12, 14, 16] supported the present trial results, which opposes what Ward DH, [6] found in his study, as he suggested that the proportion of the successive width of the teeth remains constant when progressing distally from the midline.
This study has some limitations as the effect of gender and age have not been recorded and considered. Therefore, further studies should focus on the influence of these factors on the results. Also, there is always a possibility of inaccuracies in such trials due to minor positional differences that can occur during photography, which might affect the measurements.
While the width proportion of the anterior maxillary teeth is considered a critical determinant in dental aesthetics, other items that have been studied in the literature such as tooth width-to-length ratio, facial features, ethnicity, psychological and perceptual factors, and socio-economic background, should not be disregarded to achieve the most aesthetically pleasing smile.
CONCLUSION
Within the limitations of the present study, the following conclusions can be derived: Golden Proportion, Preston's Proportion, and RED Proportion have limited application in anterior teeth rehabilitation in the studied population, as they do not accurately and broadly represent natural aesthetic smiles. The proposed modified Golden Percentage values in this study are more representative and recommended for smile design for the Saudi Arabia population.The width proportion is only one part of the anterior dental aesthetic design. Other general and local aspects should be considered to achieve a highly aesthetic outcome.
LIST OF ABBREVIATIONS
| RED | = Recurrent Esthetic Dental |
| KKUCOD | = King Khalid University. |
| MLLI | = Maxillary Left Lateral Incisor |
| MLC | = Maxillary Left Canine |
| MRC | = Maxillary Right Canine |
ETHICS APPROVAL AND CONSENT TO PARTICIPATE
This study was conducted in compliance with the protocol; ethical approval was obtained from the ethical committee at KKUCOD, College of Dentistry (Approval No. IRB/KKUCOD/ETH/2020-21/047).
HUMAN AND ANIMAL RIGHTS
No animals were used in this research. All human research procedures followed were in accordance with the ethical standards of the committee responsible for human experimentation (institutional and national), and with the Helsinki Declaration of 1975, as revised in 2013.
CONSENT FOR PUBLICATION
Written informed consent was obtained from all subjects before their participation.
STANDARDS OF REPORTING
STROBE guidelines were followed.
AVAILABILITY OF DATA AND MATERIALS
The data that support the findings of this study are available from the corresponding author, [M.A.Z], on special request.
FUNDING
None.
CONFLICT OF INTEREST
The authors declare no conflict of interest, financial or otherwise.
ACKNOWLEDGEMENTS
Declared none.

