All published articles of this journal are available on ScienceDirect.

Association of Fear and Annoyance with Acoustic Levels of Dental Equipment Among Adolescents Attending Rural Dental Health Center: A Cross-sectional Study
Authors Info & Affiliations
Abstract
Introduction:
Noise is increasingly becoming pervasive in occupational health concerning practicing dentists as well as patients. A stimulus such as noise from dental equipment compared to anxiety is often multifactorial and can result from a combination of fear of pain, dental instruments noise, or even upcoming negative events and future threats.
Aim:
This study aimed to assess fear and annoyance levels among adolescents attending a rural dental health centre and compare the acoustic noise levels of dental equipment and its association with fear and annoyance levels among adolescents.
Methods:
The acoustic noise spectra originating from different tools/equipment in a rural dental health centre is assessed using an application named sound meter of a standard mobile android phone (Samsung galaxy grand 2). Following a 15-minute treatment, a questionnaire was filled by a professional investigator through personal interviews with all subjects. The data is subjected to analysis by Statistical Package for Social Sciences version 22.0.
Results:
61.5% of the subjects felt anxious about the anticipatory dental visit, and there was a significant difference observed between genders. Chi-square analysis revealed no significant differences in the fear and annoyance with increasing noise levels in various treatment groups. (p> 0.05).
Conclusion:
In the present study, fear and annoyance levels increased with increasing noise levels of equipment. Annoyance was found to be significantly higher in females.
1. INTRODUCTION
Noise is described as mostly unwanted random sound [1]. Decibel is the unit of measurement of sound pressure levels, named after Alexander Graham Bell, using A-weighted sound levels (dB (A)). The A-weighted sound levels match loudness perception by the human ear [2]. Practicing dentists, as well as patients, are pervasively concerned about occupational health hazards due to noise [3]. The numerable supposed health effects anticipated in the human body are originated from noise. Noise is one of the ten leading causes of work-related diseases or injuries as identified by The National Institute for Occupational Safety and Health (NIOSH). Prolonged noise exposure can lead to noise-induced hearing loss (NIHL), which can go undiagnosed for years as it is estimated that individuals may develop about 28% loss of hearing even without awareness [4]. The intensity, frequency of the sounds, and exposure to noise influence the extent of damage caused. There could also be noise noise-induced hearing loss in case of exposure to noise levels above 85dBA for more than 8 hours, as reported by OSHA (Occupational Safety and Health Administration) [5]. Such NIHL is found in dentists and dental auxiliaries [6]. There are also reports of noise causing non-auditory effects like a rapid reaction to stress, heart rate variations, high blood pressure, alteration in respiration, variations in blood glucose and lipid levels, associated with psychical consequences like mental fatigue, annoyance, and a reduction in work or professional efficiency [7].
Fear is a primary and powerful emotion that alerts us about imminent danger [8]. It is a primary basic instinct associated with a fight or flight response, activated to an impending and specific threat. Anxiety is the anticipation of worry about a probable future threat. Anxiety is defined as apprehension of danger and dread, accompanied by restlessness, tension, tachycardia, and dyspnoea unattached to a clear unidentifiable stimulus [9]. Anxiety and fear of pain are commonly reported as causes of irregular dental attendance and avoidance of dental care leading to the deterioration of oral health. Moreover, dentists find phobic patients difficult to manage [10]. Anxiety is often multiple sourced and results from a combination of fear of pain, dental equipment, noise or events, and future threats [3]. The modified dental anxiety scale combined with the Corah dental anxiety scale and Humphris, Morrison, and Lindsay is comprehensive, highly valid, and reliable, with a simpler and more consistent answering system [11].
Annoyance may be defined as a feeling of displeasure associated with any agent or condition known or believed by an individual or a group to be adversely affecting them. The words relating to feelings are described as disturbance, irritation, discomfort, dissatisfaction, bother, nuisance, uneasiness, and distress [12].
The study aims to assess fear and annoyance levels among adolescents attending the rural dental health centre and compare the acoustic noise levels of dental equipment and its association with fear and annoyance levels among adolescents.
2. MATERIALS AND METHODS
The present cross-sectional study was conducted among adolescents attending a rural dental health centre of Suttur village in Mysuru district, India. Certificate of Ethical clearance was obtained to carry out the study from the Institution Ethical Committee, JSS Dental College, and Hospital.
Inclusion criteria: Adolescents with no auditory problems and those who have not undergone any auditory interventions in the past year.
Exclusion criteria: Adolescent who are reluctant to participate in the study and those who have undergone any auditory treatments in the past one year.
The acoustic noise spectra originating from different tools/equipment in a rural dental health center is assessed using an application named sound meter in a standard mobile android phone (Samsung galaxy grand 2). The range of sound measured in the application is 0 – 120 dB which is within the range of acoustic noise spectra produced by the dental equipment, which is 65- 85dB based on literature. The instrument validation was done.
To assess the noise from various equipments, the Sound meter was placed 5–7 cm away from the sound source (dental tools) at angulations of 45º to the floor3, 5. For reproducibility, each measurement was repeated 3 times from different angles. The average of the three readings was calculated and taken as the sound level for that particular tool in dBA. The test procedure was to take the measurement for 20 seconds while the tool in question was operating at its maximum speed. The same procedure was repeated five times for every dental tool, and values were recorded. The Cronbach’s alpha values were calculated for each tool and the values were 0.73, 0.86, 0.84, 0.62, 0.67, 0.90 for scaler, scaler + suction, scaler + suction + 3 way syringe, airotor, airotor + suction, airotor + suction + 3 way syringe respectively. The measurements of the noise levels were recorded by a separate recorder who was not part of the study.
The validation of the questionnaire in local language (Kannada) was carried out in three phases: phases 1- Translation and cultural adaptation, phases 2- Testing the comprehensiveness of the instrument in a pilot study, phases 3- Administering the questionnaire in the main survey to investigate the psychometric properties (reliability and validity) of the instrument [13].
A predesigned close-ended questionnaire containing information regarding general information, dental fear, and annoyance (Based on Modified Corah’s Dental Anxiety scale13) is used. It is very reliable and valid in various situations also in the Indian population [14, 15].
Pilot Study: The questionnaire was administered among 10 adolescents attending the rural dental health center to check for the feasibility and overall acceptability. The questionnaire was administered by a trained investigator after the subject had undergone half mouth scaling. The procedure was repeated with a gap of one day on the same subject. Based on their responses, it was concluded that no modifications were required. The internal consistency of the questionnaire was assessed in the pilot study and was found to be reliable. (Cronbach’s alpha coefficient (0.8)).
Sample Size Estimation: The sample size was estimated using the following equation. P= Expected proportion of subjects with fear, Q = 1 – P, L= allowable error.
Sample Size = 4 × P × Q / L2
The sample size was estimated to be 178, assuming the prevalence of fear and annoyance amongst the study population to be 50% at a 95% confidence level and allowable error of 15%.The sample size was rounded off to 200 to compensate for any non - response. The recruitment of the participants was done based on eligibility criteria. Healthy subjects aged between 10-19 years who were cooperative and granted their consent were included. Patients with hearing impairment/ wearing hearing aids, subjects with mental disability, and those on anti-depressants were excluded.
Permission and informed consent were obtained from the concerned authority and the study participants by informing them that the data they provided would be kept confidential.
Followed by 15 min treatment, a questionnaire was filled with personal interviews for all participants by a trained investigator. The data is subjected to analysis by Statistical Package for Social Sciences version 22.0. Data analysis included frequency distribution and cross-tabulation. Descriptive statistics and chi-square tests were used for all variables. The level of significance was set at 5%.
3. RESULTS
A total of 200 participants with age 9-19 years were included in the study, of which 104 (52%) were males and 96 (48%) were females. Among the study participants, 76.9% (n=80) of the males are literates, and 23.1% (n=24) did not receive any formal education. In females 88.5% (85) are literates and 11.5% (n=11) did not receive any formal education. The majority of the study participants were literates of both genders (p =0.023). The age was categorized into 2 groups, i.e., 9-13 and 14-19 years. 51% (n=53) of the males and 37.5% (n=36) of females were distributed in first category i.e., 9-13 years. 49% (n=51) of males and 62.5% (n=60) of females were distributed in second category i.e., 14-19 years (p =0.038) (Fig. 1).
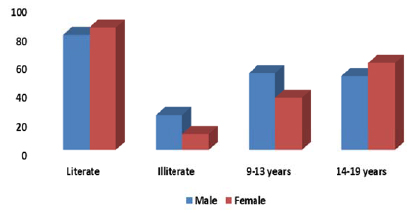
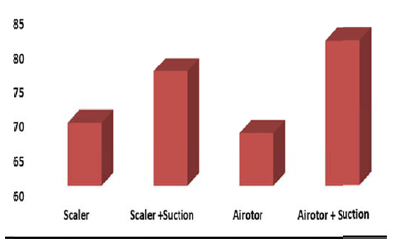
Fig. (2) shows the mean noise levels produced by various dental equipment included in the study. The mean noise level produced by the scaler is 69.1dB with a standard deviation of 1.4. The mean noise level produced when scaler is used along with suction is 76.6 dB with a standard deviation of 1.3. The mean noise level produced by airotor is 67.6 dB with a standard deviation of 0.8. The mean noise level produced when airotor is used along with the suction is 81.1dB with a standard deviation of 0.7. One-way analysis of variance revealed statistically significant differences in the mean noise levels produced by various dental equipment considered in the study (p = 0.000).
Table 1 shows fear and annoyance among the study participants due to acoustic spectra produced by the dental equipment. Among males, 27.9% (29) reported no fear, 58.7% (61) reported low fear, and 9.6% (10) reported that they were afraid. Only 3.8% (4) reported that they are very afraid. Among females, 10.4% (10) reported no fear, 64.6% (62) reported low fear, 21.9% (n=21) reported that they were afraid. Only 3.1% (3) reported that they are very afraid. None of the participants were terrified. Fear due to acoustic spectra was significantly higher among females compared to males (P= 0.05).
Among males 47.1% (n=49) are not at all annoyed, 5.8% (n=6) reported low annoyance, 40.4% (n=10) were annoyed. Only 6.7% (n=7) reported that they were very annoyed. Among females, 28.1% (n=27) are not at all annoyed, 9.4% (n=9) reported low annoyance, 56.3% (n=54) reported that they are annoyed. Only 6.3% (n=6) reported that they were very annoyed. None of the participants were terrified. Chi-square analysis revealed a statistically significant difference in annoyance levels among males and females. (p = 0.04).
| Fear | Males | Females | P value |
| No fear | 29(27.9) | 10(10.4) | 0.02 |
| Low fear | 61(58.7) | 62(64.6) | |
| Afraid | 10(9.6) | 21(21.9) | |
| Very Afraid | 4(3.8) | 3(3.1) | |
| Terrified | 0(0) | 0(0) | |
| Total | 104(52) | 96(48) | |
| Annoyance | Males | Females | P value |
| No annoyance | 49(47.1) | 27(28.1) | 0.04 |
| Low annoyance | 6(5.8) | 9(9.4) | |
| Annoyed | 42(40.4) | 54(56.3) | |
| Very annoyed | 7(6.7) | 6(6.3) | |
| Terrified | 0(0) | 0(0) | |
| Total | 104 | 96(48) |
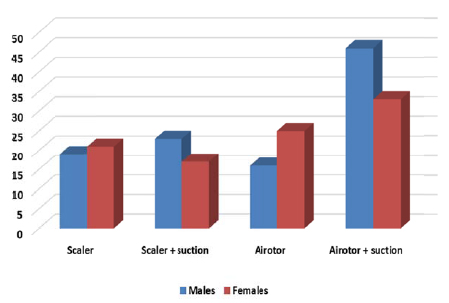
Among 200 participants, 40 were distributed in the scaler group, in which 19 (47.5%) are males, and 21 (52.5%) are females. 40 are distributed in the scaler + suction group, in which 23 (57.55%) are males, and 17 (42.5%) are females. 41 are distributed in airotor group in which 16 (39.0%) are males, and 25 are females (61.0%). 79 are distributed in airotor + suction group in which 46 (58.2%) are males, and 33 are females (41.8%). There was no statistically significant difference in the distribution of males and females in different groups (p = 0.187) (Fig. 3).
In Table 2 mode of cognitive behaviour management therapy to cope with fear and annoyance caused due to noise produced by dental equipment is shown. 12.5% (n=13) of males and 4.2% (n=4) of females preferred listening to soft music to cope up with the noise. 11.5% (n=12) of males and 6.3% (n=6) of females preferred watching television. 76% of males and 89.6% of females felt constant interaction with the operator helps them in coping up with fear and annoyance produced due to noise levels. The majority of the study participants suggested constant interaction with the operator as the best method to cope with fear and annoyance. This finding was statistically significant. (p =0.03).
| - | Males | Females | P value |
| Soft Music | 13(12.5) | 4(4.2) | 0.03 |
| Television | 12(11.5) | 6(6.3) | |
| Constant interaction with operator | 79(76) | 86(89.6) | |
| Nothing effects | 0(0) | 0(0) | |
| Total | 104 | 96 |
Table 3 highlights the change in the fear and annoyance levels with increasing noise levels. To facilitate comparison, fear and annoyance are dichotomized as fear and no fear, annoyed and not annoyed. Among the participants included in the scaler group, 22.5% (n=9) reported no fear, and 77.5% (n=31) reported having fear. Among the participants included in the scaler + suction group, 15% (n=6) reported no fear, and 85% (n=34) reported having fear. Among the participants included in airotor group, 19.5% (n=8) reported no fear, and 80.5% (n=33) reported having fear. Among the participants included in airotor + suction group 20.3% (n=16) reported no fear and 79.7% (n=63) reported having fear. Among the participants included in the scalar group, 45% (n=18) reported no annoyance, and 55.0% (n=22) reported being annoyed. Among the participants included in the scaler + suction group, 45% (n=18) reported no annoyance, and 55.0% (n=22) reported being annoyed. Among the participants included in airotor group, 41.5% (n=17) reported no annoyance, and 58.5% (n=24) reported being annoyed. Among the participants included in airotor + suction group, 29.1% (n=23) reported no annoyance, and 70.9% (n=56) reported being annoyed. Chi-square analysis revealed no significant differences in the fear and annoyance with increasing noise levels in various treatment groups. (p> 0.05).
4. DISCUSSION
In the present study, the noise levels measurements of equipment were observed in the rural dental health centre. The noise levels produced range between 69-81dB, with the lowest value recorded when airotor alone is used (69 dB) and the highest being 81dB when airotor is used along with suction. These were slightly lesser than what was reported in the previous studies [3-5, 7]. This might possibly be due to the difference in the brands of equipment used.
| Inst. Used | No Fear | Fear | No Annoyance | Annoyance |
| Scaler | 9(22.5) | 31(77.5) | 18(45) | 22(55) |
| Scaler + suction | 6(15) | 34(85) | 18(45) | 22(55) |
| Airotor | 8(19.5) | 33(80.5) | 17(41.5) | 24(58.5) |
| Airotor + suction | 16(20.3) | 63(79.7) | 23(29.1) | 56(70.9) |
| Total | 39(19.5) | 161(80.5) | 76(38) | 124(62) |
| P value | 0.8 | 0.2 | ||
The present study revealed that 61.5% of the subjects felt anxious about the anticipatory dental visit, and there is a significant difference observed between genders similar to the studies of Tanni et al. and Radhika et al. [11, 16]. Manipulating patients with high anxiety is more difficult, which increases the levels of stress-related to dentistry [ 17, 18].
In contrary to other studies [3, 5, 9], the present study focuses on a specific age group and among people attending a single dental setup as fear and anxiety may be observed differently in different age groups and dental setups. The Likert scale was used to measure annoyance levels of patients, which ranged from “not at all annoyed” to “extremely annoyed”. It was observed in the present study that 62% of the adolescents felt “moderately annoyed” to “extremely annoyed” with the dental clinic noises, which is as also found by Hussein M Elmehdi and Radhika et al. [5, 16]. This emphasizes the need for dental practitioners to be aware of anxious patients and actively take measures in their concerns.
Gender-wise, females were more anxious and annoyed when compared to the males, which is in line with the results reported by Malvania et al., Asif et al., Mohd G. Sghaireen et al. [3, 9, 17, 19]. This observed difference between genders could be because males are more emotionally stable than females [20], or there might be greater readiness to acknowledge anxiety among females [9].
The present study, for the first time, assessed the level of fear and annoyance with increasing noise levels. Although the fear and annoyance levels increased with increasing noise levels of different dental types of equipment, the findings were statistically insignificant. This might be due to the multifactorial and subjective nature of fear. Moreover, all the noises of dental equipment were in the audible range, which could not cause a significant difference in fear and annoyance (p>0.05).
Various techniques are practiced for managing the behaviour of adolescents. The attitude of patients and dental professionals toward these techniques is changing. Now a day’s non-aversive techniques like distraction are becoming more popular [16]. In the present study, 82.5% of participants preferred constant interaction with the operator as a preferred method of behavioural management therapy which is in contrast with the studies done by Asif et al. and Radhika et al. [3, 16, 21], which reported music and watching TV as preferred behavioural therapy respectively. When an adolescent is actively interacting with the operator and is informed about the treatment he/she is undergoing, along with the added assurance, it would result in a reduction of anxiety.
CONCLUSION
In the present study, 62% of the adolescents felt “moderately annoyed” to “extremely annoyed” with the dental clinic noises. Females were more anxious and annoyed when compared to the males, and participants preferred constant interaction with the operator as a preferred method of behavioural management therapy. Those with constant interaction with the doctors were less anxious compared with those who were not interacting.
RECOMMENDATIONS
The environment in the clinics can directly have an effect on the fear and annoyance levels of patients. Devising objective tools for assessment of fear which can substantially support the subjective findings and adoption of preventive measures among the dentist, as well as the patients, should be encouraged in order to protect against the harmful effects of noise and reduce the fear of patients. Personal protection through the use of earplugs or earmuffs to prevent hearing loss can be adopted. Further, manufacturing quieter dental handpieces along with maintenance of equipment on a regular basis can be done to ensure a reduction in dental equipment noise levels and minimize long-term health effects and dental dropouts. Hearing Conservation Program (HCP) can be instituted in noisy workplaces.
ETHICS APPROVAL AND CONSENT TO PARTICIPATE
The ethical approval was obtained from Institution Ethical Committee of JSS Dental College and Hospital, Shivarathreeshwara Nagar, Mysuru, India with approval number DCH/2014-15/(42).
HUMAN AND ANIMAL RIGHTS
No animals were used in this research. All human research procedures were followed in accordance with the ethical standards of the committee responsible for human experimentation (institutional and national), and with the Helsinki Declaration of 1975, as revised in 2013.
CONSENT FOR PUBLICATION
Permission and informed consent were obtained from the concerned authority and the study participants by informing them that the data they provided would be kept confidential.
AVAILABILITY OF DATA AND MATERIALS
The data sets used during the current study can be provided from the corresponding author (N.A) ,upon reasonable request.
FUNDING
None.
CONFLICT OF INTEREST
The authors declare no conflict of interest, financial or otherwise.
ACKNOWLEDGEMENTS
Declared none.

