All published articles of this journal are available on ScienceDirect.

Performance of Multiple Light-curing Units used by Dental Students
Authors Info & Affiliations
Abstract
Aim:
To investigate the performance of multiple Light-curing Units (LCUs) of different manufacturers used in a dental student clinical setting.
Background:
Manufacturers claim that the irradiance values of the LCUs stay stable over time. However, this may not be accurate among the different units.
Objective:
This study investigated the performance in terms of the irradiance, radiant exposure, and DOC of multiple LCUs of different types used in a dental student clinical setting.
Methods:
Four different LCU were investigated (n=5 units/LCU manufacturer): three Light-Emitting-Diodes (LED) units (Demi Ultra, Mini LED, and E-Morlit) and one quartz-tungsten-halogen (QTH) (PolyluxII). Irradiance and radiant exposure were collected [Managing Accurate Resin Curing-Patient Simulator (MARC-PS)] (n=5 readings/unit/tooth). Depth of Cure (DOC) was performed (ISO 4049:2009 standards) using a micro-hybrid composite (n=5/unit). Data were analyzed using Kruskal-Wallis and ANOVA followed by Student-Newman-Keuls and Tukey post hoc methods, respectively (α=0.05).
Results:
Using the MARC-PS anterior and posterior teeth sensors, respectively, the mean irradiance (mW/cm2) for Demi Ultra was (1625.7±38.8) and (1250.4±25.2); Mini LED (1381.1±37.8) and (1058.1±27.3); E-Morlit (1831.1±294.7) and (1545.2±176.0); and Polylux II (932.4±368.5) and (840.4±353.4)mW/cm2. The radiant exposure range was 16-38 J/cm2 for all LCUs. LCUs’ mean DOC ranged from 2.9 to 3.1 mm. Significant differences in irradiance and radiant exposure values were detected among the multiple units and manufacturers. Significant differences in DOC values among the Demi Ultra and Polylux II units were detected. DOC met the standards except for one Polylux II unit.
Conclusion:
The irradiance and radiant exposure values were not the same among the different units, regardless of the manufacturers’ claim of the irradiance values stability over time. Polymerization was not compromised except for one QTH unit per the DOC measurements. Itis highly recommended to closely monitor LCUs used in dental student clinical areas due to the high demand in this type of setting.
1. INTRODUCTION
The performance of Dental Light-curing Units (LCUs) influences both the polymerization effectiveness and clinical longevity of Resin-based Composite (RBC) restorations [1], since the latter need receiving sufficient energy at a specific wavelength to acquire satisfactory chemical, physical and mechanical properties [2-6]. Of note, insufficient polymerization of the restoration may lead to the release of unreacted monomers, which may provoke pulpal irritation, postoperative sensitivity, hydrolysis of material, as well as restoration discoloration [1, 7]. Thus, during the polymerization of RBC restorations, the professional must always verify the quality of the LCU under usage. This is usually overlooked by dental students. In addition, manufacturers claim that the light-emitting-diode (LED) curing units’ performance and irradiance remain stable until the battery runs out, and the stability is maintained over time. However, this may not be the case, and irradiance levels may be impacted by the high level of usage by dental students [8]. Therefore, investigating this area may provide valuable information regarding the LCUs.
Irradiance is the amount of light a restoration receives from the LCU (power × surface area) and it is commonly expressed in mW/cm2 [2]; whereas radiant exposure is the amount of energy the restoration receives over a period of time (irradiance × time), which is expressed in J/cm2 [2, 4]. According to some studies [2, 9, 10], an LCU may not deliver its intended light output, thus negatively affecting the overall polymerization of the restoration. The polymerization reaction of light-sensitive resin composites is commonly mediated by a visible light that activates the photo-initiator available in the material, resulting in the generation of free radicals and ultimately in the initiation of the conversion of monomers into polymer [4]. Notably, an output of a minimum of 400 mW/cm2 is usually recommended for curing a conventional resin composite placed in 2 mm-thick increments [11]. Also, RBC restorations need to receive a radiant exposure of 16 J/cm2 to achieve proper polymerization [4], although a considerably lower amount (10 J/cm2) would be adequate when polymerizing a bleaching shade material [12, 13].
In dentistry, there are two main types of LCUs typically used in daily routine: quartz-halogen-tungsten (QHT) and light-emitting-diode (LED) [14, 15]. It is already known that QTH and LED units do not deliver similar irradiance values, probably due to some inherent differences between the two equipment. For instance, QTH units deliver light with a wider wavelength range than LED units, so the former usually has a lower irradiance and broader spectral emission range (375-520 nm) compared to the latter [9, 10, 16]. Nonetheless, QTH units produce heat during their usage, thus needing a moment to refrigerate between distinct applications; overall, the durability of QTH units is poor due to this inherent characteristic. On the other hand, LED units deliver light with a narrower wavelength range (400-500 nm) with a higher emission spectral peak, considerably enhancing the durability of the equipment [9, 10, 16]. Both the QTH and LED LCUs are broadly used at the dental practice and taking into consideration their usage at the university level, attention to the quality of the equipment should be a concern since several dental students may need to share the same LCU to perform laboratory/clinical tasks. It is noteworthy that the performance of the LCU may be directly influenced by its surrounding circumstances, so that LCUs of the same manufacturer and those used by different individuals in a dental school may not deliver the same irradiance values [8], which may compromise the overall quality of dental restorations. In addition, there is little evidence in the literature regarding the performance of multiple units of the same manufacturer. Hence, this study aimed to evaluate the irradiance and radiant exposure parameters and explore the depth of cure of multiple LCUs of different manufacturers used in a dental school setting. The working hypothesis was that the irradiance, radiant exposure, and the depth of cure (DOC) of multiple LCUs of different manufacturers used in a dental school setting would be significantly different from each other.
2. MATERIALS AND METHODS
Ethical approval was obtained from the Research Ethics committee (REC) at King Abdulaziz University Faculty of Dentistry (proposal no.: 123-10-18). Although no human tissues or animals were involved, it is the school policy to obtain ethical approval for similar studies through a fast-track review and approval. This study investigated the performance of four different types of LCU used by dental students in King Abdulaziz University (n=5 units/manufacturer): one type of LCU comprised of quartz-tungsten-halogen (QTH) technology -Polylux II (KaVo Dental, Bismarckring, Germany) with a 9 mm optical diameter; and the other three LCUs consisted of LED technology – (i) Mini LED (Acteon, Merignac, France) with a 7.2 mm optical diameter, (ii) E-Morlit (Apoza, NewTaipei, Taiwan, ROC) with a 7.3 mm optical diameter, and (iii) Demi Ultra (Kerr, Orange, CA, USA) with an 8 mm optical diameter. The LCUs were purchased in the same year and were approximately seven years old. For all the LCUs, the student: LCU ratio was approximately 2:1, with an average of 18 restorations being placed during each session. The LED units were used after their full charge state was obtained. For the QTH units, their respective fan was allowed to completely cool down before obtaining the measurements. The light guide tip of the LCUs selected was cleaned with alcohol from any resin remnant and debris, and any LCU with broken light-guide tips was excluded from the study.
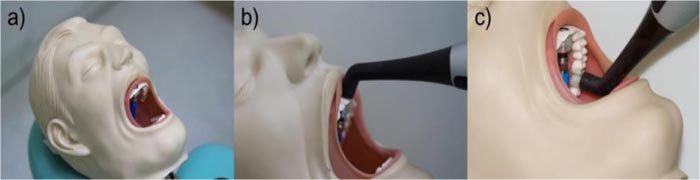
One operator collected the irradiance and the radiant exposure measurements for each LCU using a Managing Accurate Resin Curing-Patient Simulator (MARC-PS) (BlueLight AnalyticsInc., Halifax, Canada) composed of a manikin head that included an anterior and posterior cosine corrector sensor (Fig. 1). The anterior sensor was 1 mm recessed below the anterior labial tooth surface (placed between teeth number 11 and 21 in the FDI numbering system) simulating curing a class III restoration. The posterior sensor was 4 mm recessed from the top of the occlusal surface of an upper molar tooth number 27 in the FDI numbering system, simulating the curing of a class I restoration in a deep occlusal cavity preparation. The interocclusal distance was maintained at 35 mm to ensure that all tests were performed in a similar possible testing condition. The sensors were connected to a laptop computer where the clinicians’ performance was viewed in real-time to provide immediate feedback. The measurements were collected using the same techniques taught in the dental school: (i) checking the light-guide is clean and not broken, (ii) wearing protective blue light blocker grange google, (iii) the light-guide tip perpendicular to the tooth surface, (iv) as close as possible, and (v) using finger support. A total of 200 irradiance and radiant exposure measurements were collected (n=5 readings/LCU/tooth).
The DOC of each LCU was tested according to the ISO 4049 specifications [17] and using a micro-hybrid RBC (Filtek Z250; 3M ESPE, St. Paul, MN, USA) shade A2. A total of 100 specimens were prepared (n=5/unit) using a split mold with a 6 mm high × 4 mm diameter. Resin composite was packed, and light cured for 20 s from the top surface according to manufactures’ instructions. Each specimen was removed from the mold and the bottom surface was scraped to remove any uncured RBC using a plastic instrument. Three height measurements of each specimen were collected using a digital caliper and the average height was divided by 2 to calculate the DOC.
The obtained data were statistically analyzed with SigmaPlot version 12 (Systat Software Inc., San Jose, CA, USA). For irradiance and radiant exposure data, Kruskal-Wallis and the Student-Newman-Keuls post hoc test were used; whereas for the depth of cure data, one-way Analysis of Variance followed by Tukey test. The level of significance was set at α=0.05 for all analyses.
3. RESULTS
3.1. Multiple Units within the Same LCU Manufacturer
3.1.1. Irradiance and Radiant Exposure
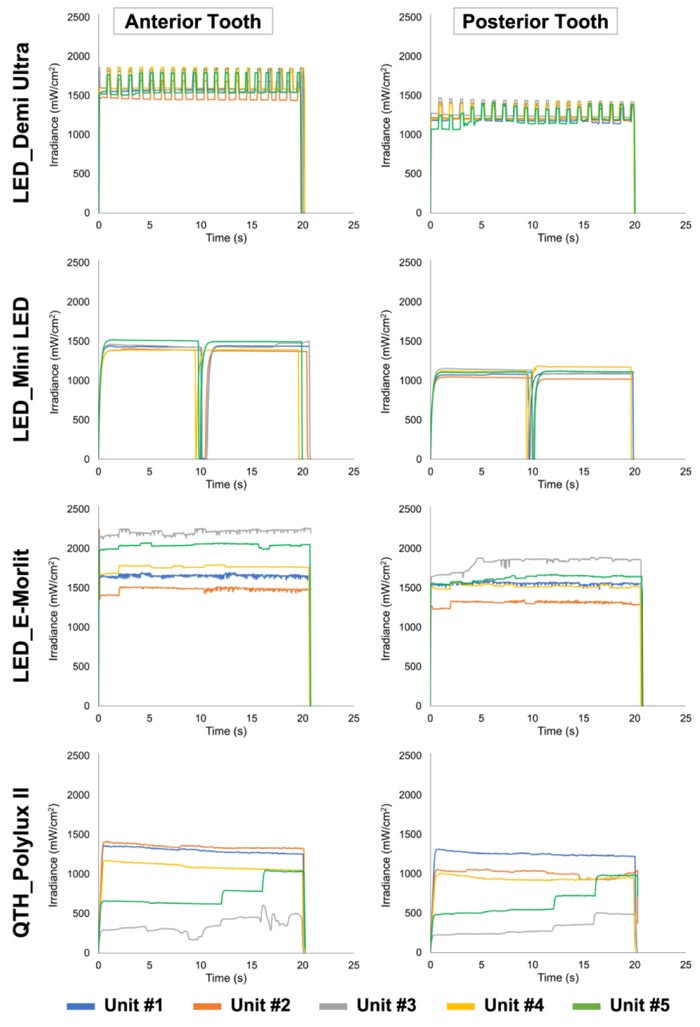
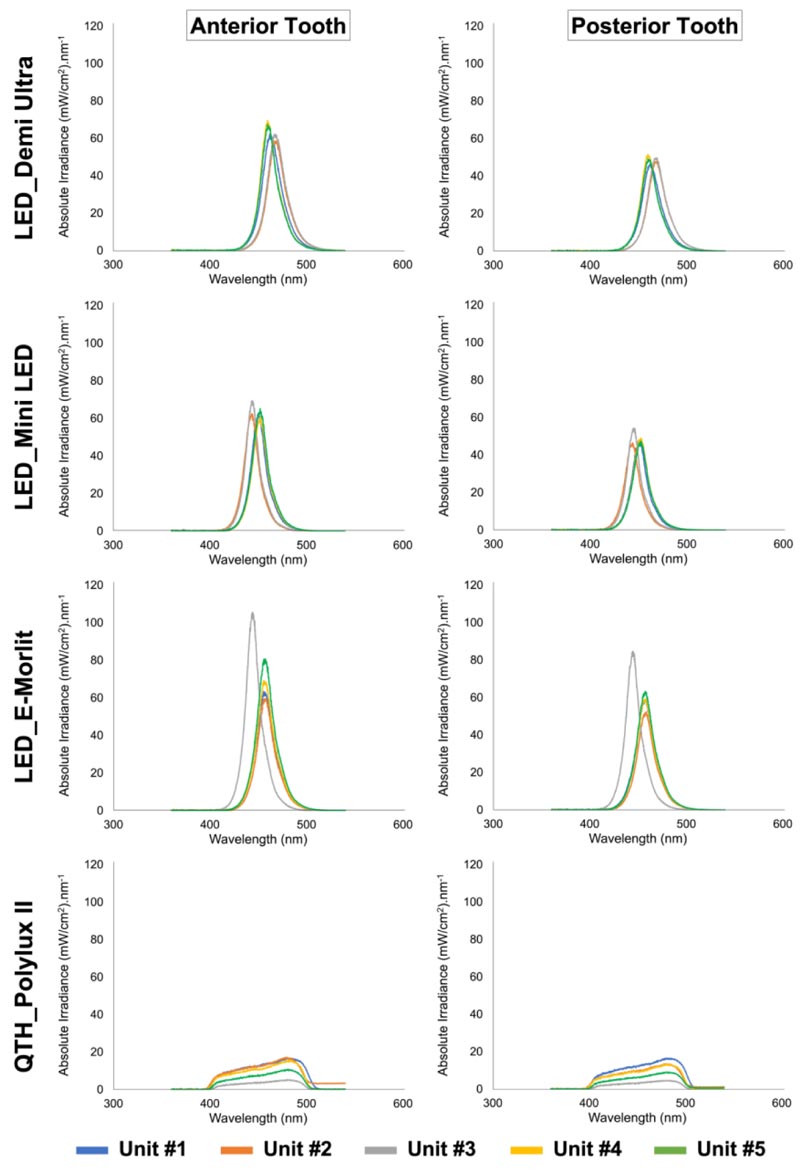
(Figs. 2 and 3) show representative graphs of the irradiance, and the spectral distribution of each unit within the same LCU manufacturer. Demi Ultra and Mini LED units showed similar performance represented by the irradiance graphs, unlike E-Morlit and Polylux II that showed a heterogeneous performance among the units regardless of the tooth sensor position (Fig. 2). The spectral distribution for each unit was similar among the units for each manufacturer (Fig. 3). All LED units showed a single peak of nearly 450 nm, whereas the QTH LCUs demonstrated a broader spectral distribution, regardless of the sensor position. The Demi Ultra and Mini LED LCUs showed similar spectral distribution for both teeth, although with a lesser absolute irradiance performance for the posterior tooth. The E-Morlit group showed that unit 3 had a slightly higher and shifted peak compared to the other units. Lastly, the Polylux II LCUs exhibited different absolute irradiance measurements for both teeth.
Information on irradiance and radiant exposure mean, standard deviation, median, minimum and maximum values for each unit are presented in Appendix A and Appendix B, respectively. Demi Ultra and Mini LED units showed an overall similar performance. Conversely, the units made by E-Morlit and Polylux II manufacturers demonstrated a more heterogeneous performance, values varied in relation to each tested unit. While the units from E-Morlit resulted in irradiance and radiant exposure values greater than the threshold limits for adequate polymerization of resin composite restorations (i.e., 400 mW/cm2 of irradiance or 16 J/cm2 of radiant exposure), some units from the Polylux II manufacturer (unit no. 3) performed considerably less than the foregoing thresholds.
3.2. LCU Units among Different Manufacturer
3.2.1. Irradiance
According to the statistical analysis, the influence of the factors “LCU manufacturer” and “tooth position” were not significant (p>0.05), although their interaction was significant (p≤0.001). As shown in Table 1, the E-Morlit LED system demonstrated the highest irradiance values, whereas the Polylux II QTH system delivered the lowest irradiance levels. All the LED units delivered significantly greater irradiance than the QTH (p<0.001), regardless of the tooth position.
Considering the anterior tooth position only, the E-Morlit and Demi Ultra LCUs showed similar irradiance between each other (p=0.084) and greater than the Mini LED system (p<0.001). Conversely, in the posterior tooth position, the irradiance level of the LED LCUs was different for each equipment, decreasing in the following order: E-Morlit > Demi Ultra > Mini LED (p≤0.001). Overall, the irradiance level of the Demi Ultra and Mini LED systems were more homogeneous than the other LCUs, which delivered a wider irradiance level that ranged from 1266.2 to 2267.9 mW/cm2 in the E-Morlit system and from 306 to 1333.2 mW/cm2 in the Polylux II system. All irradiance values delivered by the LED systems were significantly lower in the posterior tooth position (p<0.001), except for the E-Morlit group, which exhibited similar irradiance values at both the anterior and posterior teeth positions (p=0.193). Regarding the QTH system, there was no significant difference between the anterior and posterior teeth positions (p=0.127).
3.2.2. Radiant Exposure
According to the statistical analysis, the influence of the factors “LCU manufacturer/brand” and “tooth position” were significant (p≤0.001), although their interaction was not significant (p=0.520). As shown in Table 1, the E-Morlit LED system delivered the highest amount of energy, whereas the Polylux II QTH system delivered the lowest energy level.
| LCUs | Irradiance (mW/cm2) | Radiant exposure (J/cm2) | Depth of cure (mm) | ||||
| Anterior | Posterior | p-value (Anterior vs. Posterior) | Anterior | Posterior | p-value (Anterior vs. Posterior) | ||
| LED_Demi Ultra | 1638.7 A (1521.0 – 1679.8) |
1250.2 B (1205.0 – 1300.3) |
0.011 | 33.0 AB (30.6 – 33.8) |
25.1 B (24.3 – 26.1) |
0.013 | 3.10 A 3.03 – 3.19) |
| LED_Mini LED | 1371.7 B (1306.4 – 1470.5) |
1061.9 C (969.7 – 1122.4) |
0.026 | 27.7 B (13.7 – 29.5) |
21.3 BC (10.5 – 22.2) |
0.023 | 3.07 A (3.04 – 3.14) |
| LED_E-Morlit | 1764.5 A (1432.0 – 2267.9) |
1563.4 A (1266.2 – 1820.5) |
0.047 | 36.6 A (29.9 – 47.2) |
32.5 A (26.4 – 38.0) |
0.049 | 3.06 A (3.03 – 3.12) |
| QTH_Polylux II | 1035.8 C (352.2 – 1333.2) |
934.2 D (306.0 – 1260.7) |
0.511 | 20.9 C (3.2 – 27.0) |
18.8 C (6.1 – 25.5) |
0.507 | 3.03 B (2.32 – 3.07) |
| p-value range (comparisons among the different LCUs) | < 0.001 – 0.148 | < 0.001 – 0.174 | < 0.001 – 0.073 | < 0.001 – 0.217 | ≤ 0.001 | ||
Distinct uppercase letters in the same column indicate significant differences among the LCUs (p < 0.05; Kruskal-Wallis and Student-Newman-Keuls post hoc test).
All the LED units delivered greater radiant exposure than the QTH equipment (p≤0.006) in the anterior tooth position, although in the posterior tooth, the Mini LED system demonstrated similar radiant exposure values compared to the QTH (p=0.217). Considering the anterior tooth only, the E-Morlit and Demi Ultra units delivered a similar amount of energy (p=0.073), with the latter showing similar values to the Mini LED system (p=0.069).
Within the posterior tooth subgroups, the E-Morlit group resulted in significantly greater radiant exposure than the other LED units (p≤0.020), which did not differ from each other (p=0.111). Overall, only the Demi Ultra LCUs delivered a narrower range of energy, ranging from 24.3 to 33.8 J/cm2, opposed by the other LCUs tested, which demonstrated a wider energy delivery pattern.
All radiant exposure values delivered by the LED units were significantly lower in the posterior position (p≤0.049), differing from the QTH unit, which delivered a similar total amount of energy at both the anterior and posterior teeth positions (p=0.507).
3.2.3. Depth of Cure (DOC)
As shown in Table 1, the DOC values were similar among the LED LCUs tested in the study (p>0.05); they ranged from 3.03 mm to 3.19 mm in the LED systems, differing from the DOC range for the QTH system (2.32 - 3.07 mm).
4. DISCUSSION
This study explored the performance of multiple LCUs of the same manufacturers used by dental students at a governmental university to investigate the manufacturer claims that battery life is not affected over time. One operator performed the experiments using freehand and without stabilizing the LCU, thus simulating a clinical setting. Similarly, the MARC-PS anterior and posterior teeth positions were tested to simulate a clinical setting where the LCU ergonomics, tooth location, and depth of the cavity (sensor depth) can impact the irradiance and radiant exposure values obtained, and thus affecting the quality of the final cured resin composite restoration.
The multiple units of each manufacturer explored here showed significant differences among them, especially for the QTH LCUs. Of note, the irradiance and radiant exposure values of the latter were considerably lower than those from the LED LCUs. The significant differences observed among the LED units could indicate that the level of LCU usage by students daily in each clinical area may significantly affect the unit’s LED battery, thereby impairing the irradiance and radiant exposure values. Although manufacturers suggest that the LED units’ irradiance values would be stable until the battery runs out. However, our data shows that this is not the case and the irradiance values of some LED manufacturers explored that were utilized under similar conditions gradually decreased overtime even with a fully charged battery. Therefore, the working hypothesis was partially accepted.
Similarly, the significant differences among the QTH units could be explained by the lamp (bulb) life. As it is being extensively used, it could jeopardize the overall irradiance and radiant exposure values. Furthermore, the LCUs were used with a free hand method to simulate the dentists’ clinical setting, which would explain these values. Despite of the foregoing limitations, the DOC of the multiple LCUs was greater than 2 mm, and taking into consideration that this threshold is the maximum incremental thickness recommended by dental manufacturers, the present findings are in accordance with the adequate polymerization of resin composite restorations. Therefore, the working hypothesis was partially accepted.
When irradiance was decreased, the radiant exposure followed the same trend. Our results may be partially explained by the presence of camphorquinone (CQ) photoinitiator within the resin composite used here. Indeed, CQ is effectively activated by the single-emission-peak LED units explored, as well as by the broad wavelength spectrum of the QTH units, resulting in satisfactory polymerization. In addition, one shade of a conventional composite was used in our study, and the sufficient DOC values obtained were probably a consequence of the irradiance values verified here, which were greater than the 400 mW/cm2 stated in the ISO, and the recently suggested 800 mW/cm2, i.e., the minimal irradiance needed to achieve adequate polymerization upon 20 s of photo-activation [11, 18, 19]. Therefore, it may be estimated that the polymerization properties were satisfactory on the bottom when cured even with the QTH units.
In recent work, it was shown that 0.1 J/cm2 radiant exposure reached the specimen bottom when 10 J/cm2 was received on the top, resulting in the proper degree of conversion, microhardness, as well as cross-link density of a bleaching shade resin composite [12, 13, 20]. Our irradiance, radiant exposure, and DOC values using both sensors validate to the literature [16, 21-24].
Irradiance values are influenced by the ergonomics and shape of the LCUs’ tip, tip angle; position of the guide tip on the sensors (anterior or posterior) and the distance between the guide tip to the sensor (1 mm using the anterior sensor and 4 mm using the posterior sensor) may also influence on the irradiance values. Our results showed that for most of the LCUs explored, irradiance and radiant exposure values were significantly higher upon the use of the anterior tooth as compared to the posterior one, probably explained by the light guide tip position and the depth of the sensor. Additionally, the interocclusal distance was maintained at 35 mm, and the LCU ergonomics and tip angle may impact the irradiance and radiant exposure when positioned with the posterior sensor. The Mini LED units to possess a bulky angled tip, which was challenging to place perpendicularly to the surface under curing [2, 16, 22]. Also, our findings suggest that close monitoring of the LCUs’performance should be kept in a logbook to record irradiance measurements more often, especially when the demand for the LCU is high, such as in student clinical areas or settings. It is noteworthy to mention that the DOC was evaluated by light-curing at zero distance [17-19], but the results may vary accordingly at different distances. It is also important to note that these findings may vary to a certain extent when using different LCUs and different resin composites. Future research evaluating the DOC at various distances and using different LCUs simulating the clinical setting is warranted.
CONCLUSION
From the LCUs investigated in the student clinical areas, some units from the same manufacturer performed significantly different with regard to irradiance and radiant exposure measurements, despite the claimed suggestions by LED manufacturers that values would remain stable until batteries run out.DOC among a few units were significantly different, nevertheless, it was not compromised for the resin composite used. Regular monitoring is recommended when LCU usage demand is high, perhaps dental schools should reinforce developing operations and maintenance protocols in an attempt to provide high-quality restorations for the patients.
LIST OF ABBREVIATIONS
| RBC | = = Resin-based Composite |
| LCU | = = Light-curing Unit |
| LED | = = Light-emitting-diode |
| QTH | = = Quartz-tungsten-halogen |
| DOC | = = Depth Of Cure |
ETHICAL APPROVAL AND CONSENT TO PARTICIPATE
Ethical approval was obtained from the Research Ethics committee (REC) at Faculty of Dentistry ,King Abdulaziz University, Saudi Arabia (proposal no: 123-10-18).
HUMAN AND ANIMAL RIGHTS
Not applicable.
CONSENT FOR PUBLICATION
Not applicable.
AVAILABILITY OF DATA AND MATERIALS
Not applicable.
FUNDING
None.
CONFLICT OF INTEREST
No conflicts of interest to declare, financial or otherwise.
ACKNOWLEDGEMENTS
Declared none.
APPENDIX
| LCU | Tooth | Unit no. | Mean | SD | Median | Min | Max | p-value |
| LED_Demi Ultra | Anterior | 1 | 1621.1 AB | 45.4 | 1638.0 | 1548.1 | 1663.4 | ≤ 0.001 |
| 2 | 1573.3 B | 42.8 | 1588.3 | 1521.0 | 1617.5 | |||
| 3 | 1664.2 A | 19.7 | 1676.9 | 1638.7 | 1679.8 | |||
| 4 | 1663.3 A | 5.2 | 1661.7 | 1657.0 | 1670.8 | |||
| 5 | 1606.8 AB | 18.7 | 1602.3 | 1590.2 | 1638.9 | |||
| Posterior | 1 | 1247.8 B | 13.3 | 1250.2 | 1232.7 | 1261.1 | ≤ 0.001 | |
| 2 | 1240.4 B | 11.8 | 1240.5 | 1225.4 | 1255.1 | |||
| 3 | 1289.2 A | 9.6 | 1293.4 | 1276.5 | 1299.6 | |||
| 4 | 1254.3 B | 27.8 | 1251.7 | 1229.4 | 1300.3 | |||
| 5 | 1220.1 B | 22.2 | 1209.8 | 1205.0 | 1259.1 | |||
| LED_Mini LED | Anterior | 1 | 1359.4 BC | 8.3 | 1357.1 | 1352.4 | 1372.9 | ≤ 0.001 |
| 2 | 1366.2 BC | 26.5 | 1356.0 | 1339.3 | 1405.3 | |||
| 3 | 1400.4 AB | 30.4 | 1389.0 | 1371.7 | 1449.7 | |||
| 4 | 1342.2 C | 22.8 | 1353.4 | 1306.4 | 1361.2 | |||
| 5 | 1437.0 A | 27.3 | 1438.9 | 1408.0 | 1470.5 | |||
| Posterior | 1 | 1039.1 BC | 13.6 | 1035.8 | 1025.7 | 1061.9 | 0.002 | |
| 2 | 1021.1 C | 37.3 | 1019.8 | 969.7 | 1073.8 | |||
| 3 | 1075.8 AB | 16.9 | 1073.0 | 1051.8 | 1095.7 | |||
| 4 | 1087.2 A | 29.9 | 1091.4 | 1051.0 | 1122.4 | |||
| 5 | 1067.1 ABC | 15.7 | 1071.5 | 1047.6 | 1084.7 | |||
| LED_E-Morlit | Anterior | 1 | 1674.9 D | 26.2 | 1661.6 | 1652.6 | 1713.4 | ≤ 0.001 |
| 2 | 1473.4 E | 38.0 | 1464.3 | 1432.0 | 1532.7 | |||
| 3 | 2229.3 A | 24.6 | 2227.9 | 2207.3 | 2267.9 | |||
| 4 | 1767.2 C | 19.7 | 1764.5 | 1742.8 | 1790.9 | |||
| 5 | 2010.9 B | 18.3 | 2007.1 | 1988.1 | 2037.5 | |||
| Posterior | 1 | 1551.5 | 27.4 | 1563.4 ABC | 1503.9 | 1572.1 | ≤ 0.001 | |
| 2 | 1300.2 | 31.9 | 1309.0 C | 1266.2 | 1331.4 | |||
| 3 | 1782.0 | 41.3 | 1794.5 A | 1712.9 | 1820.5 | |||
| 4 | 1483.9 | 34.5 | 1479.8 BC | 1443.7 | 1519.4 | |||
| 5 | 1608.3 | 29.1 | 1621.9 AB | 1571.3 | 1637.7 | |||
| QTH_Polylux II | Anterior | 1 | 1244.4 A | 33.1 | 1245.2 | 1210.7 | 1282.9 | ≤ 0.001 |
| 2 | 1257.7 A | 52.5 | 1244.2 | 1209.6 | 1333.2 | |||
| 3 | 397.2 E | 45.2 | 388.9 | 352.2 | 450.0 | |||
| 4 | 1036.7 C | 28.7 | 1035.8 | 1007.5 | 1082.0 | |||
| 5 | 726.2 D | 16.3 | 729.1 | 706.5 | 742.1 | |||
| Posterior | 1 | 1230.8 A | 18.6 | 1228.1 | 1210.8 | 1260.7 | ≤ 0.001 | |
| 2 | 1043.4 B | 33.3 | 1050.0 | 991.7 | 1081.3 | |||
| 3 | 326.8 E | 17.1 | 325.2 | 306.0 | 351.5 | |||
| 4 | 940.2 C | 12.8 | 934.2 | 929.8 | 959.8 | |||
| 5 | 660.8 D | 36.9 | 659.0 | 613.5 | 715.4 |
| LCU | Tooth | Unit no. | Mean | SD | Median | Min | Max | p-value |
| LED_Demi Ultra | Anterior | 1 | 32.6 AB | 0.9 | 33.0 | 31.2 | 33.5 | ≤ 0.001 |
| 2 | 31.6 B | 0.9 | 31.9 | 30.6 | 32.7 | |||
| 3 | 33.5 A | 0.4 | 33.7 | 32.9 | 33.8 | |||
| 4 | 33.4 A | 0.2 | 33.4 | 33.2 | 33.6 | |||
| 5 | 32.4 AB | 0.4 | 32.2 | 32.1 | 33.1 | |||
| Posterior | 1 | 25.0 B | 0.3 | 25.2 | 24.7 | 25.3 | ≤ 0.001 | |
| 2 | 24.9 B | 0.3 | 24.9 | 24.6 | 25.2 | |||
| 3 | 25.9 A | 0.2 | 26.0 | 25.7 | 26.1 | |||
| 4 | 25.2 B | 0.6 | 25.1 | 24.7 | 26.1 | |||
| 5 | 24.6 B | 0.4 | 24.4 | 24.3 | 25.4 | |||
| LED_Mini LED | Anterior | 1 | 25.1 | 6.4 | 27.7 A | 13.7 | 28.6 | 0.051 |
| 2 | 27.5 | 0.7 | 27.5 A | 26.7 | 28.5 | |||
| 3 | 28.1 | 1.1 | 28.6 A | 26.8 | 29.5 | |||
| 4 | 27.0 | 0.4 | 27.0 A | 26.4 | 27.4 | |||
| 5 | 28.7 | 0.7 | 29.0 A | 27.9 | 29.5 | |||
| Posterior | 1 | 18.7 | 4.6 | 20.7 A | 10.5 | 21.1 | 0.035 | |
| 2 | 20.5 | 0.9 | 20.5 A | 19.3 | 21.4 | |||
| 3 | 19.5 | 4.9 | 21.5 A | 10.8 | 22.1 | |||
| 4 | 21.6 | 0.7 | 22.0 A | 20.9 | 22.2 | |||
| 5 | 21.7 | 0.5 | 21.8 A | 20.9 | 22.0 | |||
| LED_E-Morlit | Anterior | 1 | 34.8 D | 0.5 | 34.5 | 34.3 | 35.6 | ≤ 0.001 |
| 2 | 30.7 E | 0.8 | 30.7 | 29.9 | 31.9 | |||
| 3 | 46.5 A | 0.5 | 46.5 | 45.9 | 47.2 | |||
| 4 | 36.6 C | 0.4 | 36.6 | 36.1 | 37.0 | |||
| 5 | 41.7 B | 0.4 | 41.7 | 41.3 | 42.2 | |||
| Posterior | 1 | 32.3 B | 0.5 | 32.5 | 31.3 | 32.7 | ≤ 0.001 | |
| 2 | 27.2 D | 0.6 | 27.3 | 26.4 | 27.8 | |||
| 3 | 37.2 A | 0.9 | 37.5 | 35.7 | 38.0 | |||
| 4 | 30.8 C | 0.7 | 30.6 | 30.1 | 31.5 | |||
| 5 | 33.5 B | 0.6 | 33.7 | 32.7 | 34.1 | |||
| QTH_Polylux II | Anterior | 1 | 25.2 | 0.6 | 25.2 A | 24.5 | 26.0 | ≤ 0.001 |
| 2 | 25.5 | 1.1 | 25.3 A | 24.5 | 27.0 | |||
| 3 | 7.2 | 2.4 | 7.8 D | 3.2 | 9.1 | |||
| 4 | 21.0 | 0.6 | 20.9 B | 20.4 | 21.9 | |||
| 5 | 14.7 | 0.4 | 14.7 C | 14.3 | 15.1 | |||
| Posterior | 1 | 24.9 | 0.4 | 24.9 A | 24.5 | 25.5 | ≤ 0.001 | |
| 2 | 20.1 | 2.5 | 21.3 B | 15.9 | 21.9 | |||
| 3 | 6.6 | 0.3 | 6.6 D | 6.1 | 7.1 | |||
| 4 | 19.0 | 0.3 | 18.9 B | 18.6 | 19.4 | |||
| 5 | 13.4 | 0.8 | 13.4 C | 12.4 | 14.5 |
| LCU | Unit no. | Mean | SD | Median | Min | Max | p-value |
| LED_Demi Ultra | 1 | 3.12 A | 0.05 | 3.12 | 3.04 | 3.19 | 0.038 |
| 2 | 3.05 B | 0.02 | 3.05 | 3.03 | 3.09 | ||
| 3 | 3.10 AB | 0.02 | 3.10 | 3.07 | 3.12 | ||
| 4 | 3.10 AB | 0.02 | 3.10 | 3.07 | 3.14 | ||
| 5 | 3.08 AB | 0.02 | 3.07 | 3.06 | 3.12 | ||
| LED_Mini LED | 1 | 3.10 A | 0.04 | 3.09 | 3.07 | 3.14 | 0.073 |
| 2 | 3.08 A | 0.02 | 3.08 | 3.06 | 3.11 | ||
| 3 | 3.08 A | 0.02 | 3.09 | 3.04 | 3.10 | ||
| 4 | 3.06 A | 0.01 | 3.06 | 3.05 | 3.08 | ||
| 5 | 3.06 A | 0.02 | 3.05 | 3.04 | 3.09 | ||
| LED_E-Morlit | 1 | 3.09 A | 0.03 | 3.08 | 3.07 | 3.12 | 0.118 |
| 2 | 3.05 A | 0.02 | 3.05 | 3.03 | 3.08 | ||
| 3 | 3.06 A | 0.01 | 3.05 | 3.05 | 3.08 | ||
| 4 | 3.08 A | 0.04 | 3.06 | 3.05 | 3.12 | ||
| 5 | 3.07 A | 0.02 | 3.07 | 3.06 | 3.10 | ||
| QTH_Polylux II | 1 | 3.05 | 0.01 | 3.06 A | 3.04 | 3.06 | 0.001 |
| 2 | 3.05 | 0.02 | 3.05 A | 3.01 | 3.07 | ||
| 3 | 2.50 | 0.12 | 2.54 C | 2.32 | 2.61 | ||
| 4 | 3.04 | 0.01 | 3.04 A | 3.03 | 3.05 | ||
| 5 | 3.01 | 0.02 | 3.01 B | 2.97 | 3.03 |

