All published articles of this journal are available on ScienceDirect.

Precision of a Reflectance Spectrophotometer in Measuring Anterior Tooth Color
Authors Info & Affiliations
Abstract
Background:
Intraorally, a common instrumental approach for measuring tooth color is reflectance spectrophotometry.
Objective:
To evaluate the precision of a reflectance spectrophotometer in accurately measuring anterior tooth color.
Methods:
The twelve labial surfaces of the anterior teeth of sixteen patients were measured spectrophotometrically (SpectroShadeTM Micro) on three non-consecutive days (1st, 2nd, 8th). Tooth color was converted to L*, a* and b* colorimetric values; intra-examiner repeatability was assessed in ΔΕ-units between two same day repeated measurements. Intra-examiner reproducibility was measured for the effect of tooth type, time and their interaction.The linear effect of the acquisition angle on the colorimetric values of each tooth was also estimated.
Results:
The highest values of systematic or random error occurred for teeth #33, #43 and #32. There were no statistically significant differences in systematic or random errors for any tooth between the three measurement days. Statistically significant differences were found for tooth type (p=0.039), whereas time and tooth and time interaction were not statistically significant. A statistically significant linear correlation was found between the L* and a* values and the acquisition angle for teeth #12 and #31, (p<0.008).
Conclusion:
The reflectance spectrophotometer provided a precise measurement of tooth color in-vivo since the systematic and random errors generated were below the threshold for perceivable color mismatches (ΔΕ<1). In rejection of the null hypotheses, the tooth type (maxillary central incisors) and variation of the acquisition angle of image capture (L* and a* parameters in teeth #12 and #31) affected the reproducibility of intraoral spectrophotometric measurements.
1. INTRODUCTION
Methods for the intraoral quantification of tooth color should be based on the optical properties of teeth and provide clinically relevant information. The method should be reproducible, sensitive and simple to use, and measurements should be possible intraorally and be non-destructive. Methods to evaluate tooth color can be divided into visual and instrumental. While the visual determination of tooth color by comparison to color standards is the most frequently applied method in dentistry [1], it is considered highly subjective [2]. General variables such as external light conditions, experience, age, enamel thickness, fatigue of the human eye and physiological variables such as color blindness lead to inconsistencies [3-11]. In addition, standardized verbal means for the communication of visually assessed color characteristics are limited [12].
Given that the same color can be perceived differently among observers, it is feasible that instrumental shade identification may remove a certain subjectivity that arises from individual color perceptions [13]. Instrumental tooth color measurement can be achieved with spectrophotometers [8, 14-20], colorimeters [1, 12, 21-24] or via computer analysis of photographic images [25-28]. Spectrophotometers measure one wavelength at a time from the reflectance or transmittance of an object and have been used to measure the visible spectra of extracted and vital teeth. Measurements can be obtained in CIELAB values and/or converted into a shade tab equivalent [14-20, 8]. Colorimeters filter light in the red, green and blue areas of the visible spectrum and are generally designed to measure color in X; Y; Z tristimulus terms or CIELAB values [1, 21]. Much of the dental research on the natural color of teeth in vitro and in vivo has been conducted with colorimeters [12, 22-24]. Another approach for measuring tooth color is via computer analysis of photographic images [25-27]. This method has been successfully used to evaluate the bleaching effects of peroxide-containing products over time and expressing the color changes in terms of CIELAB values [25, 29].
Evaluating color in dental research involves incorporating perceptibility and/or acceptability thresholds to compare the results. The quantitative assessment of a color difference identifies the difference that is perceivable, and the degree of color difference that is clinically acceptable [30-32]. Tooth color measurement devices have the ability to detect and quantify minor color differences as their limit of detection during in vitro quantification of monochromatic samples is considered to be 0.1 ΔΕ units [12]. There is no general consensus in the dental literature about how much color difference comprises an acceptable shade mismatch, or how much color difference is considered as perceivable and/or acceptable [20]. In a prospective study the 50:50% perceptibility threshold (PT,50% of the observers will notice the color difference and 50% will see no difference between compared objects) and 50:50% acceptability threshold (AT, 50% of the observers will accept the restoration and 50% will replace it because of color mismatch) of dental ceramic under simulated clinical settings was determined. The CIELAB 50:50% PT in dentistry was found to be ΔEab = 1.2, whereas the 50:50% AT was found to be ΔEab = 2.7 [32].
Dental color measuring instruments are increasingly used in clinical applications and research. Evaluation of measurement uncertainties of color measuring devices is performed through precision and accuracy testing. The International Organization for Standardization uses two terms, namely trueness and precision to describe the accuracy of a measurement method. Trueness refers to the closeness of agreement between the arithmetic mean of a large number of test results and the true or accepted reference value. Precision refers to the closeness of agreement between independent test results obtained under stipulated conditions. Precision depends on the distribution of random error and does not relate to the true value or the specified value. The measure of precision is usually expressed in terms of imprecision and computed as the standard deviation of the test results. Lower levels of precision are reflected in a larger standard deviation [33]. Precision can be tested by evaluating the repeatability (same method, operator or instrument) and the reproducibility (different method, operator and/or instrument) [5].
The purpose of this study was to evaluate the precision of a reflectance spectrophotometer and how the variation of the acquisition angle in each image capture affects the accurate measurement of anterior teeth color. In the present study, intra-examiner repeatability was assessed using the Bland and Altman methodology for two same day repeated measurements on three non-consecutive days. Intra-examiner reproducibility was assessed regarding the effect of tooth type, time and their interaction on the spectrophotometric measurement of teeth. The null hypothesis was that there were no mean differences in ΔΕ of spectrophotometric measurements among different teeth and different time-points of measurement. A secondary null hypothesis was that the acquisition angle (the angle at which each image is acquired) does not affect color parameters L*, a* and b*.
2. MATERIALS AND METHODS
2.1. Sample
Fourth and fifth-year dental students, who voluntarily consented to participate, were enrolled in the study. The volunteers were informed according to the World Medical Association Declaration of Helsinki ethical principles for medical research involving human subjects. The University’s Ethical Committee reviewed and approved the protocol and ascertained that all procedures detailed were conducted in accordance with the guidelines of good clinical practice. Each volunteer provided a written informed consent. The sample size was calculated based on a mean difference equal to 0.8SD of ΔΕ with a probability of at least 80%, when the alpha error probability was set to 0.05 the minimum number of subjects was 15. Therefore, the sample consisted of 16 students (8 females and 8 males; mean age 21.9±0.7 years). In order for a subject to be included in the study, the following inclusion criteria had to be met: (1) no history of orthodontic treatment with fixed appliances; (2) absence of dental caries, prosthetic restorations, decalcification, anatomical/morphological deviations, severe rotations or inclinations in the measured teeth; (3) no reported use of chlorexidine or fluoride mouth rinse, with the exception of fluoride toothpaste; (4) absence of dietary habits or medication intake that cause tooth discoloration; and (5) non-smokers.
2.2. Data Collection
The teeth included in the study were the upper and lower central incisors, lateral incisors and canines. Prior to data collection, all patients enrolled in the study received final dental polishing of all teeth surfaces using a rubber cup and Zircateprophy paste (L.D. Caulk Division, Dentsply International Inc., Milford, Delaware, USA). Patients were given oral hygiene instructions and recalled in seven days.
Data collection began with the first spectrophotometric color measurement (T1). The following day patients received a second spectrophotometric measurement (T2) and a third measurement was performed (T3) on the eighth day of data collection. All patients were instructed not to drink coffee or other staining beverages for one hour prior to each measurement. Thirty minutes before the measuring process patients were asked to brush their teeth with a plain white dentifrice; teeth were then thoroughly rinsed with water to ensure removal of toothpaste.
2.3. Methods
One examiner evaluated tooth color with a reflectance spectrophotometer, SpecroShadeTM Micro (MHT, Zürich, Switzerland). The resulting spectrophotometric images consisted of 300,000 pixels. CIELAB [lightness ranging from 0 (black) to 100 (white)], a* (red/green), b* (yellow/blue) color parameters were calculated for each tooth [34, 35]. To determine the acquisition angle, the Angle Control System of the SpectroShade Micro was used to automatically calculate in real time the optimal angle of incidence between each tooth and the optic handpiece of the spectrophotometer. The difference between the optimal angle and the angle at which the target tooth was framed constituted the acquisition angle.
A standardized protocol for tooth preparation and in vivo spectrophotometric evaluation was adopted for all patients [17]. Measurements were performed in the same examination room with standardized lighting conditions by the same operator at three time intervals: 1st day, 2nd day and 8th day. The SpectroShadeTM Micro was calibrated according to the manufacturer’s instructions and a sterile mouthpiece was placed on the optic handpiece for each patient. The optic handpiece was then positioned at a 90-degree angle to the target tooth, flush against the gingival border and the image was visually checked for signs of tongue, lips, opposing teeth. The subject was asked not to breathe directly onto the mouthpiece causing fogging and inaccurate shade reading. Four spectrophotometric images were recorded for each tooth; two consecutive recordings by positioning, removing and repositioning the optic handpiece following a 10 min. interval, then the same procedure was repeated for each tooth. The acquired data was then compared for quality control through the synchronization tool of the SpecroShade Micro. This software can overlap one image onto another by aligning the colorimetric data-points of two images and produce an overall comparison in ΔΕ units.
2.4. Statistical Analysis
Α repeated measurement design for each of the three separate days (1st, 2nd, 8th) and the twelve different tooth types (upper/lower central incisors, lateral incisors and canines) was used. Initially, intra-examiner repeatability was tested using the following procedure. For each tooth on each of the three days of measurement, color differences were determined in ΔΕ-units between two same day repeated measurements using the following equation:
 |
(1) |
where 2,k and 1,k were the second and first measurement of each day k for the 1st (k=1), 2nd (k=2) and 8rth (k=3) day and L*, a*, b* the color parameters based on the CIELAB system.
According to the Bland and Altman methodology, and in order to measure the systematic error of the method, differences of means between pairs #x0394;ΕT1-ΔΕT2, ΔΕT1-ΔΕT3, ΔΕT2-ΔΕT3 were calculated using paired t-tests [36]. Differences of Standard Deviations (SD) between the above pairs were used to assess random error with the use of the F-test. Clinical acceptance limits were calculated with the use of the coefficient of variability. Tests in the previous pairwise comparisons were given after applying the Bonferroni correction for the type I error.
The effect of tooth type (12 levels) and time (3 levels) on the reproducibility of tooth color assessment was estimated afterward. Tooth color quantification was based on color changes between T1-T2 (1st and 2nd day), T1-T3 (1st and 8rth day) and T2-T3 (2nd and 8rth day) time-points for each of the twelve types of teeth and was calculated according to the following equation:
 |
(2) |
where i,j were the different time-points of measurement and L*, a*, b* the color parameters based on the CIE-Lab system.
To check for normal distribution, the Shapiro Wilk test (N < 50) was applied for each combination of tooth type and time-point. The assumption of normal distribution was not rejected, so the analyses were performed using a linear mixed model for repeated measurements (algorithm MIXED, IBM SPSS21.0). In cases where the above model showed significant results, the Least Significant Difference test (LSD) was used for simple effect analysis. Τhe Least Significant Differences (LSD) is Fisher’s procedure for pair-wise comparisons when the main or interaction effects were found to be significant in the ANOVA analysis.
Lastly, the linear correlation between each tooth color parameters L*, a*, b* and acquisition angle, for measurements on the 1st, 2nd and 8th day was estimated with a linear mixed model (algorithm MIXED, SPSS 21.0). The overall analyses were performed with IBM Statistics SPSS 21.0 software and the level of significance was set at p < 0.05.
3. RESULTS
The mean color differences (ΔΕTi-ΔΕTj, I,j=1,2,3) of each tooth between the different timepoints of measurement correspond to systematic errors of tooth color evaluation. Previous differences varied between 0.01-0.28 units and were not clinically significant (ΔΕ<1). Statistical analysis showed that there were no significant differences in tooth color evaluation between the three days (p > 0.05) (Table 1). The highest values of systematic error were found for the lower canines (#33 and #43).
| - | Systematic Error | p-Values | ||||
|---|---|---|---|---|---|---|
| TOOTH | Mean (ΔΕT1-ΔΕT2) | Mean (ΔΕT1-ΔΕT3) | Mean (ΔΕT2-ΔΕT3) | (1) | (2) | (3) |
| 11 | 0.06 | 0.02 | 0.01 | 0.257 | 0.746 | 0.623 |
| 12 | 0.13 | 0.06 | 0.07 | 0.271 | 0.115 | 0.206 |
| 13 | 0.01 | 0.04 | 0.02 | 0.559 | 0.652 | 0.974 |
| 21 | 0.14 | 0.06 | 0.08 | 0.296 | 0.175 | 0.177 |
| 22 | 0.02 | 0.07 | 0.09 | 0.446 | 0.624 | 0.882 |
| 23 | 0.09 | 0.07 | 0.04 | 0.730 | 0.579 | 0.529 |
| 31 | 0.08 | 0.06 | 0.02 | 0.866 | 0.638 | 0.458 |
| 32 | 0.06 | 0.09 | 0.04 | 0.652 | 0.872 | 0.410 |
| 33 | 0.26 | 0.09 | 0.17 | 0.168 | 0.072 | 0.159 |
| 41 | 0.08 | 0.07 | 0.01 | 0.932 | 0.701 | 0.325 |
| 42 | 0.14 | 0.01 | 0.13 | 0.374 | 0.300 | 0.328 |
| 43 | 0.05 | 0.24 | 0.28 | 0.113 | 0.340 | 0.872 |
Differences in Standard Deviations (SD) between the pairs ΔΕT1-ΔΕT2, ΔΕT1-ΔΕT3, ΔΕT2-ΔΕT3, ranged between 0.17-0.48 and the corresponding limits of clinical acceptance were between 0.34-0.96. ΔΕ values obtained were visually (ΔΕ < 2.7) and clinically (ΔΕ<1.2) not significant. In addition, no statistically significant differences were found between random errors of tooth color assessment for the three measurement days (p > 0.05) (Table 2). The highest value of random error was found for the lower right lateral incisor (#42).
| - | Random Error | p-Values | |||||||
|---|---|---|---|---|---|---|---|---|---|
| - | ΔΕT1-ΔΕT2 | ΔΕT1-ΔΕT3 | ΔΕT2-ΔΕT3 | - | - | - | |||
| TOOTH | SD | CAL | SD | CAL | SD | CAL | (1) | (2) | (3) |
| 11 | 0.42 | 0.84 | 0.4 | 0.8 | 0.41 | 0.82 | 0.869 | 0.935 | 0.933 |
| 12 | 0.31 | 0.62 | 0.35 | 0.7 | 0.19 | 0.38 | 0.724 | 0.483 | 0.249 |
| 13 | 0.17 | 0.34 | 0.3 | 0.6 | 0.28 | 0.56 | 0.189 | 0.303 | 0.823 |
| 21 | 0.34 | 0.68 | 0.29 | 0.58 | 0.26 | 0.52 | 0.607 | 0.387 | 0.724 |
| 22 | 0.41 | 0.82 | 0.36 | 0.72 | 0.36 | 0.72 | 0.689 | 0.689 | 1.00 |
| 23 | 0.4 | 0.8 | 0.25 | 0.5 | 0.36 | 0.72 | 0.154 | 0.731 | 0.261 |
| 31 | 0.34 | 0.68 | 0.36 | 0.72 | 0.44 | 0.88 | 0.860 | 0.429 | 0.537 |
| 32 | 0.21 | 0.42 | 0.31 | 0.62 | 0.26 | 0.52 | 0.261 | 0.535 | 0.609 |
| 33 | 0.26 | 0.52 | 0.28 | 0.56 | 0.17 | 0.34 | 0.875 | 0.373 | 0.297 |
| 41 | 0.24 | 0.48 | 0.33 | 0.66 | 0.27 | 0.54 | 0.357 | 0.754 | 0.540 |
| 42 | 0.48 | 0.96 | 0.36 | 0.72 | 0.47 | 0.94 | 0.354 | 0.946 | 0.390 |
| 43 | 0.3 | 0.6 | 0.28 | 0.56 | 0.43 | 0.86 | 0.871 | 0.399 | 0.316 |
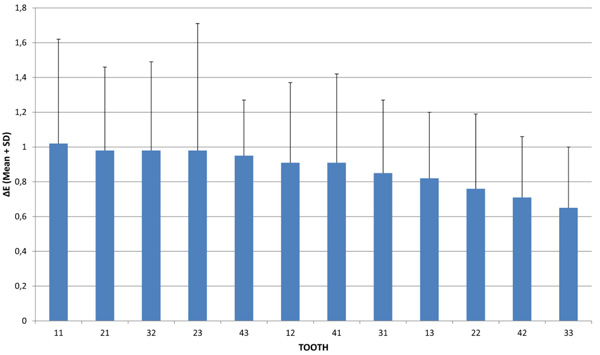
The effect of tooth type, time and their interaction (tooth by time) on the precision of spectrophotometric tooth color assessment was also estimated (Table 3). The tooth type effect (differences between twelve teeth types in the total of repeated measurements in the three days) was found statistically significant [F(11, 337.392) = 1.895, p = 0.039]. The effect of time (differences between the three days for all teeth) and tooth and time interaction were not statistically significant [F(2, 333.038) = 0.159, p = 0.853 and F(22, 332.844) = 0.687, p = 0.852, respectively]. According to analyses of the linear mixed model for repeated measurements, it was not the different day of measurement that affected color variation, but the different tooth type. The Means M(ΔΕ) on the three days in descending order are presented in Fig. (1) and Table 4. In cases where the tooth type effect showed significant results, the Least Significant Difference Test (LSD) was used for simple effect analysis.
| Estimates of Covariance Parameters | |||||||
|---|---|---|---|---|---|---|---|
| Parameter † | Estimate | Standard Error | Wald Z Statistic | p-Value | |||
| CS diagonal offset | 0.231 | 0.018 | 12.899 | <0.001 | |||
| CS covariance | 0.011 | 0.008 | 1.398 | 0.162 | |||
| Type III Tests of Fixed Effects | |||||||
| Source | Nominator df | Denominator df | F Statistic | p-value | |||
| Intercept | 1 | 12.021 | 508.692 | <0.001 | |||
| TOOTH | 11 | 337.392 | 1.895 | 0.039 | |||
| TIME | 2 | 333.038 | 0.159 | 0.853 | |||
| TOOTH by TIME | 22 | 332.844 | 0.687 | 0.852 | |||
| Tooth | Mean Total (ΔΕ) | SD |
|---|---|---|
| 11 | 1.02 | 0.6 |
| 21 | 0.98 | 0.48 |
| 32 | 0.98 | 0.51 |
| 23 | 0.98 | 0.73 |
| 43 | 0.95 | 0.32 |
| 12 | 0.91 | 0.46 |
| 41 | 0.91 | 0.51 |
| 31 | 0.85 | 0.42 |
| 13 | 0.82 | 0.38 |
| 22 | 0.76 | 0.43 |
| 42 | 0.71 | 0.35 |
| 33 | 0.65 | 0.35 |
Further analysis with the simple effect method (LSD) did not depict a clear tendency towards a specific tooth type and showed the following: Tooth #11 gave an average color difference greater than tooth #22 (p = 0.027), tooth #42 (p = 0.006) and tooth #33 (p = 0.004). Tooth #21 showed a color difference greater than tooth #33 (p = 0.011) and tooth #42 (p = 0.021). Tooth #32 produced a greater color difference than tooth #33 (p = 0.018) and tooth #42 (p = 0.038). Tooth #23 presented a color difference greater than tooth #22 (p = 0.047), tooth #33 (p = 0.018) and tooth #42 (p = 0.038). Tooth #43 demonstrated a greater color difference than tooth #33 (p = 0.027). Tooth #12 showed a color difference greater than tooth #33 (p = 0.039). Teeth #41, #31 and #13 did not differ from the rest of the teeth (p>0.05). Tooth #22 gave an average color difference less than tooth #23 (p = 0.047). Tooth #42 showed a color difference less than tooth #11 (p = 0.006), tooth #21 (p = 0.021), tooth #23 (p = 0.012) and tooth #32 (p = 0.038). Lastly, tooth #33 produced less color difference than #11 (p = 0.004), tooth #12 (p = 0.039), tooth #21 (p = 0.011), tooth #23 (p = 0.007), tooth #32 (p = 0.018) and tooth #43 (p = 0.027).
The effect of the acquisition angle on the color parameters L*, a*, b* of each tooth was estimated for each timepoint of measurement. A statistically significant linear correlation was found between L*, a* color parameters and acquisition angle for teeth #12 and #31 (Tables 5 and 6). Concerning tooth #12, the acquisition angle ranged from -3.8 to 4.9 and the equation for predicting the value of the L* parameter was 74.71 + 0.43×Angle, showing a positive linear correlation between acquisition angle and L* values. The equation for predicting the value of a* was 4.14-0.28×Angle, revealing a negative linear correlation between acquisition angle and a*. For tooth #31, the acquisition angle ranged from -4.8 to 4.5 and the equation for predicting the value of the L* parameter was 75.79 + 0.34×Angle, showing a negative linear correlation between acquisition angle and L* values. The equation for predicting the value of a* was 3.56 - 0.15×Angle, revealing a negative linear correlation between the acquisition angle and the color parameter a*.
| Tooth | Estimates of Fixed Effects | |||||||||||||||
|---|---|---|---|---|---|---|---|---|---|---|---|---|---|---|---|---|
| 12 | Parameter | Estimate | SE | Df | T | p-value | 95% Confidence Interval | |||||||||
| - | - | - | - | - | - | Lower Bound | Upper Bound | |||||||||
| Intercept | 74.71 | 0.38 | 33.979 | 199.165 | <0.001 | 73.95 | 75.48 | |||||||||
| Slope(angle) | 0.43 | 0.15 | 33.149 | 2.842 | 0.008 | 0.12 | 0.73 | |||||||||
| Estimates of Covariance Parameters | ||||||||||||||||
| Parameter | Variance | Estimate | SE | Wald Z | p-value | 95% Confidence Interval | ||||||||||
| - | - | - | - | - | - | Lower Bound | Upper Bound | |||||||||
| Repeated Measures | Time=1 | 4.36 | 1.8 | 2.422 | 0.015 | 1.94 | 9.8 | |||||||||
| Time=2 | 3.54 | 1.47 | 2.407 | 0.016 | 1.57 | 7.99 | ||||||||||
| Time=3 | 4.1 | 1.71 | 2.403 | 0.016 | 1.81 | 9.27 | ||||||||||
| - | Estimates of Fixed Effects | |||||||||||||||
| 31 | Parameter | Estimate | SE | df | t | p-value | 95% Confidence Interval | |||||||||
| - | - | - | - | - | - | Lower Bound | Upper Bound | |||||||||
| Intercept | 75.79 | 0.29 | 31.461 | 264.654 | <0.001 | 75.21 | 76.38 | |||||||||
| Slope(angle) | 0.34 | 0.12 | 26.021 | 2.866 | 0.008 | 0.1 | 0.58 | |||||||||
| Estimates of Covariance Parameters | ||||||||||||||||
| Parameter | Variance | Estimate | SE | Wald Z | p-value | 95% Confidence Interval | ||||||||||
| - | - | - | - | - | - | Lower Bound | Upper Bound | |||||||||
| Repeated Measures | Time=1 | 2.96 | 1.24 | 2.395 | 0.017 | 1.31 | 6.72 | |||||||||
| Time=2 | 2.28 | 0.99 | 2.31 | 0.021 | 0.98 | 5.32 | ||||||||||
| Time=3 | 3.75 | 1.55 | 2.417 | 0.016 | 1.67 | 8.43 | ||||||||||
| Tooth | Estimates of Fixed Effects | ||||||||
|---|---|---|---|---|---|---|---|---|---|
| 12 | Parameter | Estimate | SE | df | t | p-value | 95% Confidence Interval | ||
| - | - | - | - | - | - | Lower Bound | Upper Bound | ||
| Intercept | 4.14 | 0.16 | 33.659 | 25.273 | <0.001 | 3.8 | 4.47 | ||
| Slope(angle) | -0.28 | 0.06 | 31.677 | -4.382 | <0.001 | -0.42 | -0.15 | ||
| Estimates of Covariance Parameters | |||||||||
| Parameter | Variance | Estimate | SE | Wald Z | p-value | 95% Confidence Interval | |||
| - | - | - | - | - | - | Lower Bound | Upper Bound | ||
| Repeated Measures | Time=1 | 0.85 | 0.35 | 2.411 | 0.016 | 0.38 | 1.92 | ||
| Time=2 | 0.59 | 0.25 | 2.366 | 0.018 | 0.26 | 1.35 | |||
| Time=3 | 0.88 | 0.36 | 2.426 | 0.015 | 0.39 | 1.97 | |||
| - | Estimates of Fixed Effects | ||||||||
| 31 | Parameter | Estimate | SE | df | t | p-value | 95% Confidence Interval | ||
| - | - | - | - | - | - | Lower Bound | Upper Bound | ||
| Intercept | 3.56 | 0.11 | 27.231 | 31.633 | <0.001 | 3.33 | 3.8 | ||
| Slope(angle) | -0.15 | 0.05 | 20.275 | -3.382 | 0.003 | -0.25 | -0.06 | ||
| Estimates of Covariance Parameters | |||||||||
| Parameter | Variance | Estimate | SE | Wald Z | p-value | 95% Confidence Interval | |||
| - | - | - | - | - | - | Lower Bound | Upper Bound | ||
| Repeated Measures | Time=1 | 0.57 | 0.25 | 2.281 | 0.023 | 0.24 | 1.34 | ||
| Time=2 | 0.31 | 0.15 | 2.018 | 0.044 | 0.12 | 0.81 | |||
| Time=3 | 0.6 | 0.25 | 2.348 | 0.019 | 0.26 | 1.38 | |||
4. DISCUSSION
Perception of tooth color is a complex phenomenon which can be influenced overall by various factors such as experience, age, lighting conditions, translucency, opacity, gloss and the limitations of the fatigue of the human eye. Due to these factors human eye color quantification may produce uncertainties as opposed to instrumental tooth color selection. However, the human eye is the gold standard and instrumental tooth color measurement is subjected to evaluation.
The purpose of this study was to evaluate the precision of a reflectance spectrophotometer and how the variation of the acquisition angle in each image capture affects the accurate measurement of anterior teeth color. The null hypotheses were that there were no mean differences in ΔΕ of spectrophotometric measurements among different teeth and different timepoints of measurement and that the acquisition angle (the angle at which each image is acquired) does not affect color parameters L*, a* and b*.
The systematic error of the method was measured by calculating the mean color differences of each tooth between the different timepoints of measurement. Previous differences varied between 0.01-0.28 units and were below the threshold for perceivable color mismatches (ΔΕ < 1). Statistical analysis showed that there were no significant differences in tooth color evaluation between the three days (p > 0.05). The highest values of systematic error were found for the lower canines. The difference of Standard Deviations (SD) between pairs ΔΕT1-ΔΕT2, ΔΕT1-ΔΕT3, ΔΕT2-ΔΕT3 was used to assess random error with the use of the F-test. Differences of Standard Deviations (SD) between the above pairs ranged between 0.17-0.48 and the corresponding limits of clinical acceptance were between 0.34-0.96. Additionally, no statistically significant differences were found between random errors of tooth color assessment for the three measurement days (p > 0.05) while the lower right lateral incisor generated the highest value of random error.
According to results of this study, differences in tooth color that occurred during the repeated measurement design were similar across the three timepoints of measurement and did not exceed the value of 1 (ΔΕ < 1). In the present study, the lower six anterior teeth were included in the sample in contrast to previous studies [18, 20] also using SpectroShadeTM Micro that did not measure any lower teeth. Spectrophotometric evaluation of lower teeth in the oral environment can be complex due to patient’s jaw movements and the shallower vestibule of the mandible that can lead to inconsistent measurements. In a study of the previous version of this spectrophotometer, the highest ΔΕ values among teeth were recorded for the lower canines, the lower central incisors and premolars [17]. This finding is in accordance with results of the present study in which lower canines and incisors produced the highest values for systematic and random error.
In this study, the effect of the tooth on the precision of the spectrophotometer was found statistically significant [F(11, 337.392) = 1.895, p = 0.039]. When further analysis was performed, in order of greater mean value, teeth scored as follows:
 |
(3) |
The effect of time and tooth and time interaction were not statistically significant. According to previous analyses, it is not the different day that affects color variation but the different tooth type. Differences due to tooth type ranged on average from 0.65 to 1.02, thus differences of this magnitude are likely to be due to inherent difficulties in the tooth measuring process of the specific teeth. In particular, tooth #11 gave the highest color difference with a value slightly exceeding 1.0 (ΔΕ=1.02) followed by tooth #21 (ΔΕ=0.98). Teeth #41, #31 and #13 produced intermediate average values and teeth #22, #42, and #33 demonstrated the lowest color differences. The spectrophotometric color evaluation of the central incisors proved to be the least consistent measurement. This might be due to the variation of the inclination of these teeth as these subjects had not received orthodontic treatment. Even minor incorrect teeth inclinations and angulations can lead to incorrect positioning of the optic handpiece which adversely affects image quality.
To further investigate the colorimetric values recorded for each tooth, analyses of the acquisition angles were performed. For each tooth, the effect of the acquisition angle on color parameters L*, a*, b* for measurements on the 1st, 2nd and 8th day was estimated using a linear mixed model. With regard to tooth #12, a positive linear correlation was found between the angle and L* values, while a negative linear correlation was found between the angle and a* values. For tooth #31, a negative linear correlation was detected between the angle and respective L* and a* values. These results indicate that for tooth #12 the higher the acquisition angle is, the higher the L* value and the lower the a* value becomes. For tooth #31, the higher the acquisition angle is, the lower the L* and a* values become. Colorimetric parameter b* proved to be the most consistent and least affected by variation of the acquisition angle of the image capture. In this spectrophotometer, for a measurement to be considered acceptable the acquisition angle can range from -4.9 to +4.9 degrees. The highest values of acquisition angle were found for teeth #12 and #31 and even though captures were considered acceptable, variation of the acquisition angle adversely affected the measuring process.
Handling errors during the process of image acquisition can prove detrimental to the quality of the spectrophotometric measurement. In that sense, SpectroShade Micro is equipped with the Angle Control System that allows correct centering, positioning and angulation of the image capture. The Angle Control system automatically calculates, in real time, the optimal angle of incidence between the optic handpiece and the target tooth. The difference between the angle at which the target tooth is framed and the optimal angle is called the acquisition angle; each image acquired is stored with its angle. If the acquisition angle differs less than 3 degrees from the ideal angle, the image is considered correct. If the acquisition angle is more than 3 but less than 5 degrees from the ideal angle, the image is considered at the limit. If the acquisition angle differs more than 5 degrees from the ideal angle, the image is considered incorrect. When using this spectrophotometer even when the object was centrally framed and reference lines appeared to superimpose, it was very hard to achieve measurements of less than 3 degrees.
In another study, the individual repeatability of three color measuring devices was investigated [18]. The output recorded from the two same day repeated measurements included CIELAB coordinates and their respective conversions into Vita Classic shade tabs. For the CIE-Lab coordinates, the SpectroShadeTM Micro provided the narrowest range of ‘Bland and Altman’ agreement limits for all the coordinates recorded. SpectroShadeTM Micro results for the L* value were within a range of less than two units of ΔΕ, the a* value gave results that were within less than one unit of ΔΕ, and the b* value on 95% of occasions gave results that were within one unit of ΔΕ. In the present study, ΔΕ values for the L coordinate were found lower, marginally higher than one unit of ΔΕ (1.02) while the a and b coordinates scored similarly in the two studies, that is within less than one unit of ΔΕ.
Color threshold evaluation of color measuring devices is of great importance when interpreting color differences in dental research. In the dental literature it is often considered that a ΔΕ of 1-1.2 unit is the 50:50% Perceptibility Threshold (PT) under controlled conditions [31, 32]. Higher ΔΕ values of 2.7 [37, 32], 3.3 [38] and 3.7 [39] were found to have 50:50 Acceptability Thresholds (AT). In this study total color differences of the same tooth of all measured teeth showed minor color variation that marginally exceeded the distinguishable ΔΕ value (1.02 ΔΕ units). Results for ΔΕ values were quite small, whereas, generally, ΔΕ values of less than a unit are considered a color match. Nevertheless, establishing low threshold values reduces the probability of missing color differences and adds to increasing the soundness and sensitivity of the method.
Spectrophotometric image acquisition is based on the colorimetric and morphological properties of the oral cavity. It is advised that the examiner should recognize the potential errors related to intraoral color measurement and visually check for signs of opposing teeth, lips and tongue during image acquisition. Furthermore, the angle control system configuration should be active and all references lines and frames should be superimposed on each other thus producing a measurement where the acquisition angle differs less than 3 degrees from the optimal angle of capture.
CONCLUSION
The reflectance spectrophotometer tested in the present study provided a precise measurement of tooth color in-vivo since the systematic and random errors generated were below the threshold for perceivable color mismatches (ΔΕ<1). However, in rejection of the null hypotheses the tooth type (maxillary central incisors) affected the reproducibility of spectrophotometric measurements while a statistically significant linear correlation was found between L* and a* color parameters and the acquisition angle for the upper right lateral incisor and the lower right central incisor (#12 and #31). Color parameter b* was not affected by the variation of the acquisition angle of the image capture. It is therefore advised that during image capture with this device the operator should take extra care in adjusting the optic handpiece so that the acquisition angle differs less than 3 degrees from the ideal angle.
ETHICS APPROVAL AND CONSENT TO PARTICIPATE
This study was approved by the Ethics Committee of the Faculty of Dentistry School of Health Sciences, Aristotle University of Thessaloniki session date 16/11/2010.
HUMAN AND ANIMAL RIGHTS
No Animals were used for studies that are the basis of this research. All research procedures were in accordance with the ethical standards of the committee responsible for human experimentation (institutional and national), and with the Helsinki Declaration of 1975, as revised in 2013 (http://ethics.iit.edu/ecodes/node/3931).
CONSENT FOR PUBLICATION
Written and informed consent was obtained from all participants before the study started.
CONFLICT OF INTEREST
The authors declare no conflict of interest, financial or otherwise.
ACKNOWLEDGEMENTS
Declared none.

