All published articles of this journal are available on ScienceDirect.

Expression of p27Kip1 and E-cadherin in Head and Neck Squamous Cell Carcinoma of Indonesian Patients
Authors Info & Affiliations
Abstract
Cancer cells exhibit characteristic damage of DNA and its expression. The expression of the tumor suppressors E-cadherin and p27Kip1 has been tested on 57 head and neck squamous cell carcinomas (HNSCC) of Indonesian subjects. HNSCC tumor samples including both primary and (unrelated) nodal cases were obtained from the archives of Indonesian hospitals, in accordance with acknowledged ethical requirements. Only modest correlation was found between reduced expression of E-cadherin or p27Kip1 with increased malignancy of primary and nodal growth. The observed strong correlation regardless of malignancy between the expressed levels of E-cadherin and p27Kip1 suggests that also in combination these would not help to better predict the outcome of HNSCC.
INTRODUCTION
Squamous cell carcinoma (SCC) originates in the squamous epithelium through a process where the initial abnormal cells first expand within this epithelial layer. Eventual invasion to the connective tissue through the basement membrane barrier results in malignant growth [1]. The main etiological factors for head and neck SCC (HNSCC) are known to include tobacco, alcohol and in southern and eastern Asia also betel chewing. The reported incidence and mortality rates vary from few percent to locally nearly half of all cancers depending on the geographical region, and in Indonesia nearly 10% of all malignancies are this type of SCC's [2-5]. The survival rate remains around 50%, and for good prognosis, early detection and intervention are known to be important [4, 5]. Late intervention, even if successful, will usually cause considerable distress to patient, and likelihood of recurrence will greatly increase after early stages. A fraction of the tumors will eventually disseminate distant metastases to other organs, resulting in poor prognosis. Standard staging is usually used for clinically classifying solid tumors. To support diagnosis and as a prognostic tool, histopathological grading scales have also been developed and applied for HNSCC tumors [6].
In general, carcinogenesis can result from a failure of the cellular defenses to DNA damage [7]. This may happen due to some specific weakness in the defense mechanisms, or by chance with sufficient stress and time to accumulate damage. The damage is particularly severe when it inactivates the mechanisms that are normally protecting the organism from genomic damage. The protective functions include several mechanisms of DNA repair or apoptosis, and arresting of the cell cycle before undue proliferation. Therefore, carcinogenesis can be promoted by inactivating or altering key regulatory genes. Many of the essential genes in this defensive network are altered in SCC, and suggested indicators for diagnostic and prognostic purposes [4]. However, recent microarray work suggests that the best predictor genes for SCC prognosis are largely other than those traditionally expected [8]. Indeed, the reported prognostic value of the expressed or altered regulatory genes appears to vary widely [4]. Such proposed marker genes include the tumor suppressors p27Kip1 and E-cadherin, for which the known functions and chromosomal locations are listed in Table 1.
Main functions and chromosomal locations for p27Kip1 and E- cadherin.
| Gene/Expression | Principal Functions | Location |
|---|---|---|
| p27Kip1 | Inhibits Cdk-cyclin complexes, promotes arrest at G1 | 12p12 - 12p13.1 |
| E-cadherin | Cell-cell adhesion molecule, also promotes p27Kip1 | 16q22.1 |
General characteristics of the subjects and tumors.
| Variables | Characteristics | Total N | ||
|---|---|---|---|---|
| Age (years) all tumors primary nodal |
Mean (SD) 48.51 (16.30) 49.98 (15.59) 43.00 (18.42) |
Median 46.00 47.00 45.50 |
Mode 43.00 43.00 36.00 |
57 45 12 |
| Sex: all tumors primary nodal |
Male: 34 25 9 |
Female: 23 20 3 |
All 57 45 12 |
57 45 12 |
| Tumors (N): all tumors primary nodal |
Tongue 22 22 0 |
Other primary 1) 23 23 0 |
Nodal 12 0 12 |
57 45 12 |
| % E-cadh +: all tumors Primary nodal |
Mean (SD) 31.40 (15.34) 32.07 (14.66) 28.89 (18.17) |
Median 28.67 29.33 28.00 |
Mode (multiple) (multiple) (multiple) |
57 45 12 |
| % p27 + : all tumors primary nodal |
Mean (SD) 33.46 (15.42) 34.12 (14.44) 31.00 (19.17) |
Median 33.33 33.33 31.67 |
Mode 10.00 37.33 (multiple) |
57 45 12 |
| M-S: all tumors primary nodal |
Mean (SD) 2.216 (0.610) 2.096 (0.613) 2.720 (0.215) |
Median 2.400 2.200 2.800 |
Mode 2.600 2.600 2.800 |
52 42 10 |
1) 6 mandibular, 4 nasopharyngial, 3 gingival, 3 palatal, 3 buccal, 2 maxillary, 1 thyroid, 1 “oral”, M-S = malignancy score
The grouping and results of statistical comparisons; significant differences are shown in bold italics.
| Variables | Groups: Mean Value (SD) - N | p (MWU Test) | ||
|---|---|---|---|---|
| Age group: % E-cadh + % p27 + M-S |
< 47 years: 31.95 (16.51) – 29 33.82 (17.46) – 29 2.202 (0.599) - 26 |
³ 47 years: 30.83 (14.32) - 28 33.09 (13.29) - 28 2.231 (0.632) - 26 |
All 31.40 (15.34) - 57 33.46 (15.42) - 57 2.216 (0.610) - 52 |
0.873 0.798 0.964 |
| Sex: Age % E-cadh + % p27 + M-S |
Male: 47.47 (15.92) - 34 31.10 (15.21) - 34 33.23 (16.61) - 34 2.240 (0.521) - 30 |
Female: 50.04 (17.09) - 23 31.85 (15.88) - 23 33.23 (13.84) - 23 2.184 (0.725) - 22 |
All 48.51 (16.30) - 57 31.40 (15.34) - 57 33.46 (15.42) – 57 2.216 (0.610) - 52 |
0.833 0.942 0.981 0.697 |
| Tumor type: Age % E-cadh + % p27 + M-S |
Primary: 49.98 (15.59) - 45 32.07 (14.66) - 45 34.12 (14.44) - 45 2.096 (0.613) - 42 |
Nodal: 43.00 (18.42) - 12 28.89 (18.17) - 12 31.00 (19.17) - 12 2.720 (0.215) - 10 |
All 48.51 (16.30) - 57 31.40 (15.34) - 57 33.46 (15.42) - 57 2.216 (0.610) - 52 |
0.378 0.475 0.551 0.0014 |
| Location:1) Age % E-cadh + % p27 + M-S |
Tongue: 51.09 (16.88) - 22 30.41 (13.80) - 22 34.18 (14.36) - 22 2.171 (0.664) - 21 |
Other primary 48.91 (14.54) - 23 33.67 (15.58) - 23 34.06 (14.85) - 23 2.021 (0.563) - 21 |
All 49.98 (15.59) - 45 32.07 (14.66) - 45 34.12 (14.44) - 45 2.096 (0.613) - 42 |
0.674 0.547 0.883 0.385 |
| % E-cadh +: % p27 + all primary nodal M-S all primary nodal |
< 29% (low): 22.40 (10.68) - 29 23.98 (10.32) - 22 17.43 (11.02) - 7 2.371 (0.508) - 26 2.253 (0.518) - 20 2.767 (0.151) - 6 |
³ 29% (high): 44.92 (10.36) - 28 43.81 (10.71) - 23 50.00 (7.44) - 5 2.062 (0.671) - 26 1.955 (0.667) - 22 2.650 (0.300) - 4 |
All 33.46 (15.42) - 57 34.12 (14.44) - 45 31.00 (19.17) - 12 2.216 (0.610) - 52 2.096 (0.613) - 42 2.720 (0.215) - 10 |
< 0.00001 < 0.00001 0.0045 0.069 0.094 0.522 |
| % p27 + : % E-cadh+ all primary nodal M-S all primary nodal |
< 33% (low): 20.79 (10.21) - 28 22.61 (10.13) - 22 14.11 (7.98) - 6 2.378 (0.581) - 25 2.273 (0.603) - 20 2.800 (0.141) - 5 |
³ 33% (high): 41.66 (12.20) - 29 41.13 (12.51) - 23 43.67 (11.77) - 6 2.067 (0.608) - 27 1.936 (0.590) - 22 2.640 (0.261) - 5 |
All 31.40 (15.34) - 57 32.07 (14.66) - 45 28.89 (18.17) - 12 2.216 (0.610) - 52 2.096 (0.613) - 42 2.720 (0.215) - 10 |
< 0.00001 0.00003 0.0039 0.067 0.080 0.296 |
| M-S: % E-cadh+ all primary nodal % p27 + all primary nodal |
< 2.4 (low): 35.75 (13.57) - 24 35.75 (13.57) - 24 (no data points) 39.24 (13.40) - 24 39.24 (13.40) - 24 (no data points) |
³ 2.4 (high): 28.75 (16.45) - 28 27.67 (14.80) - 18 0.70 (18.77) - 10 29.36 (16.11) - 28 27.87 (14.40) -18 32.03 (19.34) - 10 |
All 31.98 (15.23) - 52 32.29 (14.51) - 42 30.70 (18.77) - 10 33.92 (15.59) - 52 34.36 (14.80) - 42 32.03 (19.34) - 10 |
0.108 0.091 - / - 0.018 0.011 - / - |
1) primary tumors only, M-S = malignancy score
Correlation matrix (Spearman) for malignancy scores (M-S) and expression of E- cadherin and p27Kip1 for all data / primary tumors / nodal cases (p < 0.05 in italics, p < 0.001 in bold).
| Variable | Age | % E-cadherin + | % p27Kip1 + |
|---|---|---|---|
| M-S | 0.096 / 0.141 / -0.443 | -0.278 / -0.306 / -0.488 | -0.336 / -0.363 / -0.488 |
| Age | - | 0.013 / -0.124 / 0.197 | 0.008 / -0.074 / 0.183 |
| % E-cadherin + | - | - | 0.898 / 0.856 / 0.998 |
Expression of the cyclin-dependent kinase (Cdk) inhibitor (Cdi) p27Kip1 can normally inhibit the phosphorylation of pRb and therefore cell proliferation at G1 [9]. The inhibitory function of p27Kip1 extends to multiple types of Cdk-cyclin complexes and to the action of Cdk activating kinase (CAK), resulting effectively in the arrest of the cell cycle. These inhibitory functions are prevented if the Cdi activity of p27Kip1 is altered, which is one evolutionary opportunity in cancer cell development. Alteration is usually not by mutation but rather by post-transcriptional modification. The protein and mRNA levels for p27 do not need to correlate, as the protein levels can be controlled by translation, turn over, and degradation by proteasomal protealysis [10]. Degradation of p27Kip1 is mediated by ubiquitin ligase SCFSkp2 and triggered by a Cdk binding protein Cks1. Degradation can allow entering to the cell cycle, but is prevented in quiescent cells by low levels or absence of SCFSkp2, cyclin E and Cks1 [11].
The status of p27Kip1 in cancer cells appears independent of the status of p53, which controls much of the cellular defences after DNA damage [9]. The function of wild type p27Kip1 may not always be strictly necessary, as other tumor suppressors may complement its function [9]. However, generally a certain level of p27Kip1 is needed in maintain cell quiescence, and mice lacking p27Kip1 show high frequency of cancer [11]. Although there are also conflicting reports, loss of p27Kip1 has been often associated with reduced patient survival in many types of cancer, including HNSCC [9-16]. Reduction in survival has been often related to increasing rates of lymph node metastasis and progression to advanced stages of cancer [8, 9]. The p27Kip1 levels can be increased by treatment of inductors such as TGFβ and tamoxifen, but p27Kip1 is also expressed at higher levels in normal quiescent cells than in proliferating cells. One of the operational factors for p27Kip1 induction is apparently cell contact, and reduction of p27Kip1 expression may be related to loss of intercellular adhesion, which is a step in carcinogenesis [10]. The importance of cellular contact is further emphasised by the observations that depleting p27Kip1 from tumor cells results in a significant growth stimulation but only in a three-dimensional cell culture, and that p27Kip1 is up-regulated by the cellular adhesion molecule E-cadherin [17].
Cadherins comprise of a family of calcium-dependent adhesion glycoproteins that mediate cell-cell binding to maintain differentiated tissue structure and morphogenesis. Of these molecules, E-cadherin is common in epithelial cells and involves a domain which binds directly to β-catenin, linking E-cadherin to the actin cytoskeleton. Reduced expression of E-cadherin appears to correlate with infiltrative tumor growth, poor differentiation, occurrence of distant metastases and poor survival in several types of cancer, including oral SCC [17, 18]. In many carcinomas, cadherins or catenins are lost or down-regulated with the result of reduced intercellular adhesion, which may give tumor cells a relative growth advantage. Consequently, functional E-cadherin has a potential role as a suppressor of tumor growth and invasion. Apart from the direct role of E-cadherin in cell adhesion, the suppressor function is also due to the ability of E-cadherin to upregulate p27Kip1. This may take place indirectly by preventing the mitogenic activity of growth factors such as TGF-α or EGFR [17].
In some tumors partial E-cadherin function is maintained, possibly because of the ability of E-cadherin or E-cadherin/β-catenin complexes to protect cells from apoptosis [17, 19]. On the other hand, loss or down-regulation of E-cadherin can be also partially compensated for by other adhesion molecules such as CD44, CEA and ICAM-1 [17]. Alteration and loss of expression of E-cadherin in tumors can be by mutation, loss of heterozygosity (LOH) or by CpG-island methylation [20]. Partially equivalent functional damage may be attained by alterations of other components in the related network of the cell-cell adhesion system, like β-catenin [21].
Because of the system links between p27Kip1 and E-cadherin, their expression can be expected to be correlated. This study aimed to investigate the association between histopathologically assessed malignancy and the expression status of the tumor suppressor genes E-cadherin and p27Kip1 in HNSCC tumors.
MATERIALS AND METHODS
HNSCC tumor samples, 57 in total, were obtained from the archives of the Oral Surgery and Anatomic Pathology Departments of the University of Indonesia, the Cipto Mangunkusumo and Gatot Soebroto General Hospitals, Jakarta. This set of tumor samples included 45 primary tumors and in addition 12 metastatic (unrelated) SCC tumors from lymph nodes for comparison. The recorded case histories mainly included information of patient identification and basic diagnosis. The tumor samples were fixed in 10% buffered formalin and embedded in paraffin. Representative sections of each tumor sample were fixed on a silane coated slide for histological and immuno-histochemical assessment. Each block was cut to 4-6 μm sections, which were deparaffinised in xylene and rehydrated in graded alcohol and water solutions (99, 95 and 90%) on glass slides. Endogenous peroxidase activity was blocked by treating the sections in 0.5% hydrogen peroxide-methanol solution for 30 minutes at room temperature, followed by washing in water, incubation in 3% normal horse serum (NHS) for 20 minutes, and washing in phosphate-buffered saline (PBS, pH 7.4). For antigen retrieval, the sections were preheated for 5-10 min in citrate buffer, and washed in PBS. Overnight incubation at 4°C temperature with primary antibody (Santa Cruz Biotechnology, US) was followed by PBS washing and incubation for 30 min with the secondary antibody (Santa Cruz Biotechnology, US). After PBS washing, the samples were labeled by incubation for 30 min with peroxidase conjugated streptavidin and again washed with PBS. Staining was performed by incubation for 5 min in chromogen DAB solution, and counterstaining with Mayer hematoxylin. Before final mounting, the sections were dehydrated in graded alcohol-water solutions (90, 95, 99, abs. ethanol, xylene). The positive internal controls consisted of sections treated as above and showing both weak and intensive staining in the tumor cells for each process batch. The negative controls were obtained by treating selected sections from each process batch as above but replacing the primary antibody by 3% NHS.
All histological evaluation as well as immunohistochemical assessment was performed on areas involving at least 75% tumor cells. The histopathological assessment of the tumor status was performed by using a scoring scale modified from the Anneroth scoring [6] for malignancy of SCC. This malignancy scoring included as constituent factors cellular keratinisation, nuclear polymorphism, number of mitoses in a sampled area, pattern of invasion and lymphoplasmocytic (LPC) infiltration. Each of these factors was evaluated on an integer scale of 1 to 4, and the sum of the five factors divided by 5 equals the malignancy score.
Tumor tissues of formalin-fixed, paraffin-embedded material were used for immunohistochemical evaluation of p27Kip1 and E-cadherin expression. For assessment of immunostaining, all sections were screened by two observers independently otherwise except that the same five locations were evaluated by both observers from each tumor sample. The locations were randomly selected from areas with high fraction of tumor cells. For each location, at least 100 tumor cells were inspected by light microscopy at 400x magnification. From each tumor sample, at least 2 x 500 cells were evaluated for staining intensity and for percentage of cells with positive expression. For immunoreactivity, only nuclear staining for p27Kip1 and membrane staining for E-cadherin were considered positive. If discordance between observers on the percentage of positive cells exceeded 10%, the slide was jointly reviewed until reaching required consensus. Staining intensity was estimated on a semiquantitative scale from 1 (low intensity) to 3 (high intensity). Multiplying the percentage of positive cells by the intensity number provided an index or H-score of expression.
To test for association and differences between grouped results, Mann-Whitney U testing was used, assuming p < 0.05 to imply significance. For further testing, Spearman correlation and linear regression were applied.
RESULTS
General characteristics and grouping of the tumor samples, and the results of statistical comparisons are shown Tables 2 and 3. The distributions of the measured expression
of E-cadherin and p27 as percentages of positive cells are shown in Fig. (1a), and the distributions of patient age and malignancy scores of the tumors in Fig. (1b) (for scaling, the malignancy score is here multiplied by a factor of 20). Examples of expressed E-cadherin and p27 in tumor cells are shown in Fig. (2). H-scores of expression were not found useful as the results showed no essential differences in comparison with the percentages of positive cells.

Distributions of a) the percentages of E-cadherin and p27Kip1 positive cells; and b) patient age and malignancy scores (M-S) of all 57 tumors.
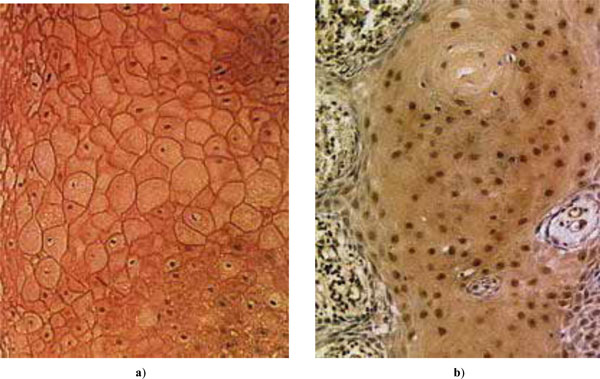
Examples of expressed tumor suppressors in HNSCC: a) E-cadherin; b) p27Kip1.
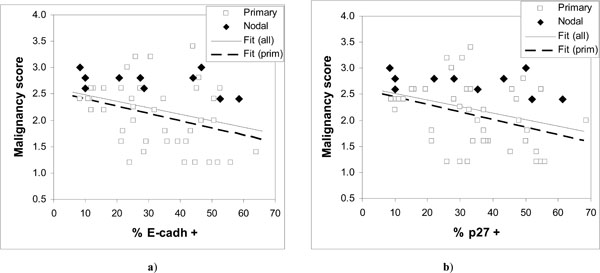
Observed malignancy scores vs. expressed a) E-cadherin and b) p27Kip1. The fitted regression lines are for all data in a) y = 2.606 – 0.0122·x; and b) y = 2.644 – 0.0126·x; and for primary tumors in a) y = 2.5247 – 0.0138·x; and b) y = 2.5842 – 0.0142·x.
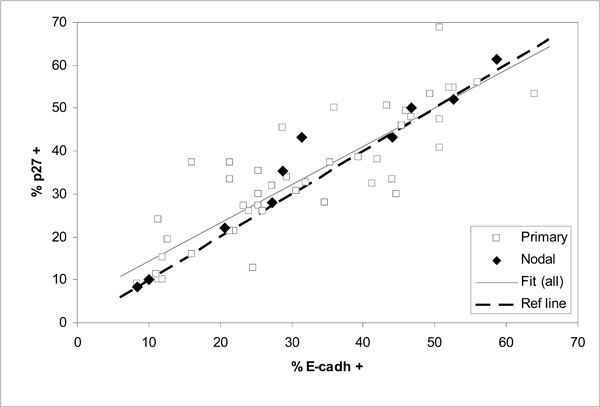
Comparison of expressed E-cadherin and p27Kip1 as percentages of positive cells in 57 oral SCC tumors (correlation for all data r = 0.89; fitted line y = 0.892 x + 5.44 and dashed diagonal reference line y = x for full correspondence).

Distribution of the relative deviances from the fitted regression line of Fig. (4) (all data); a) as a histogram and b) as a cumulative probability distribution estimated from ranked data (negative values below the fitted line).
The results show considerable scatter (Fig. 3) but suggest a downward trend in the malignancy score as a function of increasing expression of either E-cadherin or p27Kip1. Comparison of low and high malignancy score groups with respect to E-cadherin or p27Kip1 expression supports the significance of such a trend only in case of p27Kip1 (Table 2) both for all data and for primary tumors. However, a significant correlation (p < 0.05) is seen between the malignancy score and the expression of both tumor suppressors except for the nodal cases (Table 4).
The fitted lines for both E-cadherin and p27Kip1 in Fig. (3) are very similar, again both for all data and for primary tumors. The nodal cases in Fig. (3) appear consistently in the upper half of the malignancy scores data. The malignancy scores of the nodal tumors do not seem to be associated with the expression of E-cadherin or p27Kip1 (Table 2), although the number of nodal cases is relatively low.
Comparison of the expression levels of E-cadherin and p27Kip1 in the same tumors shows good correlation for all cases including the nodal tumors (Fig. 4and Table 4). The fitted linear regression line in Fig. (4) appears to lie close to the diagonal line of full correspondence between E-cadherin and p27Kip1.
DISCUSSION
The results show that reduced expression of E-cadherin or p27Kip1 can be associated with increasing malignancy of HNSCC tumors. However, modest correlations and wide scatter (Fig. 3) in the malignancy scores for given level of expression of E-cadherin or p27Kip1 suggest that neither of them is likely to serve as particularly useful cancer markers. Large scatter in Fig. (3) and the observation that the malignancy scores of nodal HNSCC cases were not significantly associated with the status of E-cadherin or p27Kip1 indicate that loss of their expression is frequently not required for tumor progression, and that high expression is also not uncommon in tumors.
The observed wide scatter in Fig. (3) is unlikely to be simply due to measurement. For the expression of E-cadherin or p27Kip1 this is indicated by the good correlation between them, as shown in Fig. (4) and Table 4 (r = 0.9). Such a good correlation would be practically impossible if the actual expression of the tumor suppressors would include scatter from measurement comparable to that seen in Fig. (3). On the other hand, the malignancy scores that involve relatively unambiguous histopathological routines are unlikely to include large measurement errors either. This is demonstrated by the nodal cases, for which the malignancy scores were consistently high and similar as can be expected from tumors at such advanced stages. Much of the scatter in Fig. (3) is more likely to be due to other alterations that could bypass the effects of E-cadherin or p27Kip1.expression. This does not need to contradict the conventional notion that in most cases the tumor progression will eventually lead to loss of E-cadherin-mediated cell-cell adhesion [21]. Other alterations with similar effect as lost E-cadherin have been previously suggested or observed, for example alteration or loss of catenins or CD44 [17, 21].
The tight association between the expression levels of E-cadherin and p27Kip1 is clearly retained regardless of the malignancy status of HNSCC tumors. Therefore, redundancies in the interdependence of E-cadherin and p27Kip1 are apparently rare.
E-cadherin and p27Kip1 are also examples of suggested cancer markers that will be unlikely to strengthen their predictive power when used in combination. This is because E-cadherin and p27Kip1 are highly correlated, so that the predictive information carried by the expression status of one of the tumor suppressors can be expected to be practically the same when both are combined together.
Because of the good correlation between the expression levels of E-cadherin and p27Kip1, it can be speculated that much of the remaining scatter in Fig. (4) may reflect the errors of measurement in the immunohistochemical assessment. This scatter is characterized in Fig. (5), which shows the distribution of the residual relative deviances from the fitted regression line of Fig. (4) (all data). Here the relative deviance for each data point is taken as the distance from the fitted line divided by the mean percentages of positive cells expressing E-cadherin and p27Kip1. The distribution is reasonably close to normal (Fig. 5a) and also symmetrical in the sense that the estimated 50% cumulative probability of occurrence practically coincides the zero deviance in Fig. (5b). The maximum absolute deviance is about ± 15 (% of positive cells), with a mean of -0.3 (SD 6.1). Although not large in number, also the nodal cases within this data set span through the distribution without obvious bias towards either side. The results also suggest that measuring the extent of expression of E-cadherin and p27Kip1 on a continuous scale has advantages over discrete scales (such as no, low and high expression), which would be less likely to accurately quantify the mutual association of the tumor suppressors.
In conclusion, the results from 57 Indonesian HNSCC cases showed only modestly significant correlation between reduced expression of E-cadherin or p27Kip1 and increasing malignancy. The observed strong correlation regardless of malignancy in the expressed levels of E-cadherin and p27Kip1 in both primary and nodal tumors suggests that the expressed levels of these tumor suppressors in any combination would not help to better predict the outcome of HNSCC.
CONFLICT OF INTEREST
The authors confirm that this article content has no conflict of interest.
ACKNOWLEDGEMENTS
This work was partly (for EIA) financially supported by the Japan Society for the Promotion of Science and the University of Indonesia, and this support is gratefully acknowledged.

