All published articles of this journal are available on ScienceDirect.

Association of Examination Rates with Children’s National Caries Indices in Finland
Abstract
The objective was to assess the effect of examination rates on national caries indices of 5, 12 and 17-year-old children/adolescents in Finland. The data were gathered from patient records of the Public Dental Service (PDS) units (n=205, 73%) and from a national register. The data included PDS-specific total numbers of examined children/adolescents and means of decayed (d/D) teeth, dmft/DMFT-values and proportions of caries-free. For analytical purposes, the PDS-specific mean values weighted by the PDS population were calculated to imply the traditionally calculated figures. New PDS-specific examination-rate-adjusted mean values were calculated by using the predicted outcome values at 100% examination rates. The results showed that low examination rates were associated with slightly poorer oral health. The examination-rate-adjusted mean d/D- values indicated better oral health than the traditional indices. The adjustment slightly worsened oral health in proportions of caries-free, and had almost no effect on dmft/DMFT-value. Overall, the influence was modest. The high proportions of healthy children that are examined (against recommendation) and the relatively small number of those having extensive disease (frequently examined as recommended) probably mask the influence of examination rates on the indices in Finland. We conclude that in international comparisons, traditionally calculated indices seem to be sufficiently valid.
INTRODUCTION
A wide variety of systems have been developed for organising and financing dental care in the EU [1, 2]. Typical for Nordic countries is a tax-financed Public Dental Service (PDS) using salaried personnel and having responsibilities to cater for certain population groups such as children, elderly and special needs groups [1, 3]. During several decades the population responsibility for children and adolescents meant that all the eligible age groups should be summoned to dental examination, and treatment and preventive services when necessary. This was irrespective of individual need of treatment. Everybody should be examined every year.
Since 1972 the Finnish children and adolescents have been offered oral health care by the PDS run by local municipalities in so called health centres. The PDS covers even sparsely populated areas and examinations and all treatments are free for those under 18 year of age, and this is one of the reasons why practically all children and adolescents use the public services. For steering purposes information on the oral health of children and adolescents has been collected from the local PDS units by central authorities since the public scheme started. In the 1970s and 1980s, systematic care and full annual coverage was emphasized. Thus, in the 1980s, about 90% of 12-year-olds were seen by local health centres (PDS) every year [4]. The national mean DMFT value for 12-year-olds fell from 6.9 in 1975 to 2.0 in 1988 [4]. Similar improvement has been seen in other Nordic andmost European Union countries. In the 1990s the national mean DMFT value for 12-year-olds fell to 1.2 in 1994 and has since remained at the same level (Fig. 1). The same trend was seen in the other age groups.
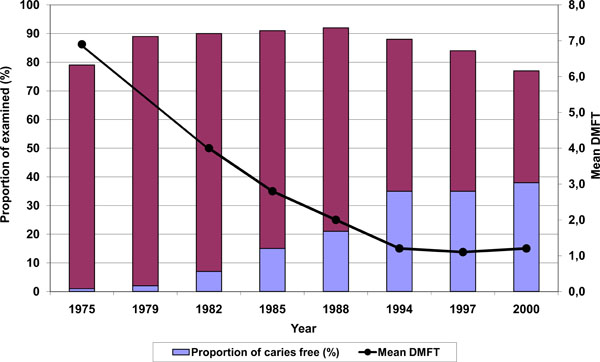
Proportions of examined and caries-free (DMFT=0), and mean DMFT values in 12-year-old children and adolescents in Finnish PDS from 1975 to 2000, according to national surveys. Data missing for mean DMFT value in 1979. (Source of data: NORDBLAD et al. 2000 [4]).
During the 1990s and after the turn of the century especially in Finland there was an increasing pressure on effectiveness of the services. From 2001 to 2002, the Finnish oral health care provision system was thoroughly reformed and the PDS was opened to the whole adult population. This increased the demand for oral health care [5, 6] and lead to long queues of adults waiting for treatment, especially in some urban units with large populations. Furthermore, recent lack of oral health care personnel in rural PDS units has complicated provision of services. This combined with increasingly better oral health of the children resulted in adoption of a different approach to population responsibility - a need-based philosophy was developed. Within the frame of population responsibility a new practice of intervals between routine examinations was developed based on individual and flexible needs. The result was that the length of recall or examinations intervals in months was extended based on the needs of the individual instead of annual routine check-ups [7]. At the district level, children's average recall examination intervals were recommended to be prolonged to 1.5-2.0 years, however, taking into account local circumstances and cost-effective use of resources. At the individual level the recall interval should be a consequence of and therefore associated with the oral health situation.
The fact that in Finland, since the mid-1990s, practically no improvement in the oral health of children and adolescents has occurred is in contrast to a great number of European Union Member States (www.cecdo.org) and raises questions about possible explanations. It has been standard practice in Finland to calculate the national mean values of caries indices among all the children and adolescents examined in the municipal PDS units. This was justified as long as entire or almost entire age groups were examined annually throughout the country. This is not the case any longer. In 2000, 66% of all 5-year-olds were examined. The respective percentages for 12 and 18-year-olds were 77% and 43% [4]. This has changed the denominator of the traditional calculations where sums of each index value from each local PDS unit were divided by the sum of all the examined in all PDS. The traditionally calculated figures are nowadays based on highly selected samples, e.g. do not take account how large proportion of the population the examined represent.
According to the recommendation on individualised recall intervals [7], those with the poorest oral health should be examined more frequently than the healthier ones. Because the examination rates have changed prominently since the individual recall examination rates were introduced, our hypothesis was that when a smaller percentage of children and adolescents are examined annually the examinations have focused on those who have the poorest oral health. This would mean that traditionally calculated national index values exaggerate amount of disease, e.g. oral health would be better than the traditionally calculated figures show. The national mean caries indices have been used in national as well as in international comparisons. They have also been used to monitor changes in oral health between years within countries. A recent review pointed out that oral health care systems should take into account the trends for change in caries within and between populations [8]. It is therefore important to know whether the variation in proportions of the examined distort the national means of caries indices, e.g. that the figures are not comparable internationally or in time any longer.
The aim of this study was to report how various examination rates of children and adolescents aged 5, 12 and 17-years in 2003 in PDS units were associated with national caries index scores (% of caries-free, mean d/D and dmft/DMFT).
MATERIALS AND METHODOLOGY
We used data from the latest available triennial national survey on the performance of the PDS in 2003. The data were collected from 279 PDS units consisting of one or several municipalities by postal questionnaires that were filled in by chief dentists who collected the information from the municipal databases based on patient records. The initial response rate was 88% (234 PDS units). Due to missing data relevant for the present study, 29 PDS units had to be excluded and the final response rate was 74%.
The national survey data used in this study consisted of the numbers of examined children and adolescents, numbers of caries-free (dmft/DMFT=0), numbers of decayed teeth (d/D) and sums of dmft/DMFT-values, as well as mean values of decayed teeth (d/D), mean dmf/DMFT-values, and proportions of caries-free, recorded separately in the present index age groups for monitoring purposes being the 5, 12 and 17-year-olds in each municipal PDS unit. All children and adolescents with a complete dental status recorded by a dentist or a dental hygienist were included. A child/adolescent was defined to be caries-free when all his/her deciduous/permanent teeth were sound. A tooth was defined as decayed (d/D) when there was a caries lesion needing restorative care. Caries experience was indicated by dmft/DMFT values. From the national survey, we also used data on the total population in the catchment area of the PDS unit, as well as the numbers of dentists working in the PDS. Complementary information on community-level background variables was extracted from the National database for social and health care [9]. The following information was employed: the numbers of 5, 12 and 17-year-olds in the catchment area of each PDS unit, and statistical grouping of municipalities according to urbanisation: urban, semi-urban and rural municipalities (Statistics Finland, www.stat.fi). Urban municipalities are those municipalities in which at least 90 per cent of the population lives in urban settlements, or in which the population of the largest urban settlement is at least 15,000. Semi-urban municipalities are municipalities in which at least 60 per cent but less than 90 per cent of the population lives in urban settlements, and in which the population of the largest urban settlement is at least 4,000 but less than 15,000. Rural municipalities are those municipalities in which less than 60 per cent of the population lives in urban settlements, and in which the population of the largest urban settlement is less than 15,000, as well as those municipalities in which at least 60 per cent but less than 90 per cent of the population lives in urban settlements, and in which the population of the largest urban settlement is less than 4,000. In Finland, the PDS units are administered by local municipalities which vary largely according to population and other factors describing geographical or economic circumstances (Table 1). A municipality may run its own PDS unit or it may do so together with several other municipalities which is the case often in small municipalities. Information in the national database [9] is recorded at the municipality level. When a PDS consisted of several municipalities, names of the municipalities in this these catchment areas were available, and the information, including the numbers of 5, 12 and 17-year-olds in the PDS’ catchment areas based on Population Register information on 31.12.2003, were obtained by summing the information from each municipality. In case of urbanisation, degree of urbanisation was determined by the largest municipality.
Distribution of Finnish Public Dental Service (PDS) Units According to Some Background Variables in 2003
| Mean (Range) / % | Number of PDS Units | |
|---|---|---|
|
|
||
| Population in PDS unit catchment area (mean, range) | 22 600 (921 – 560 000) | 205 |
|
|
||
| Ratio of population in PDS unit catchment area / dentists working in the PDS (mean, range) | 2 610 (921 – 9710) | 193 |
|
|
||
| Ratio of dental hygienists / dentists working in the PDS (mean, range) | 0.31 (0 – 1.00) | 193 |
|
|
||
| Degree of urbanization (%) | ||
| Urban | 23.4 | 48 |
| Semi urban | 29.3 | 60 |
| Rural | 47.3 | 97 |
|
|
||
| Geographical area (%) | ||
| Southern | 22.4 | 46 |
| Western | 39.0 | 80 |
| Eastern | 15.6 | 32 |
| Oulu Province | 15.1 | 31 |
| Northern | 7.80 | 16 |
Statistical Methods
In order to avoid problems caused by many small PDS units having low total numbers of examined children and adolescent we used Empirical Bayes (EB) estimation suitable for small area data [10] to calculate the PDS-specific estimates for the examination proportions instead of the crude method (crude estimate being the number of examined divided by the number of corresponding total population in the age group considered while the EB-estimate is a weighted average of crude estimate and nationwide mean proportion). EB estimates were considered better than the crude ones in terms of mean squared error, and help to avoid problems caused by small PDS units by “borrowing strength” from the whole data.
The proportion of examined was plotted against each caries index to determine the mean trends between proportion and outcome (Figs. 2-4).
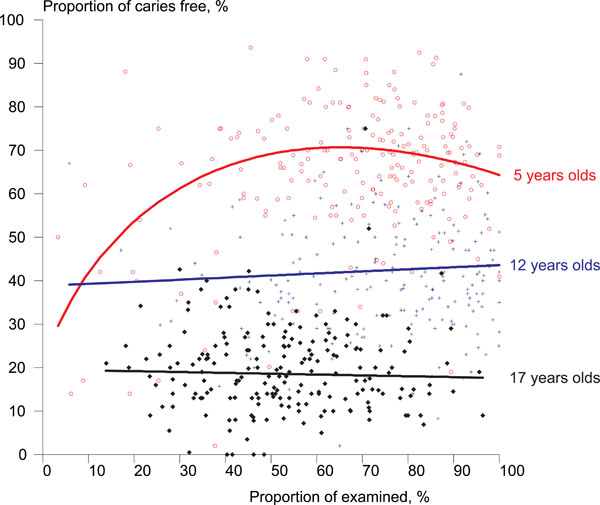
Distribution of Finnish PDS units (n = 203) according to proportions of those examined by mean proportion of caries-free (dmft/DMFT=0), in 5, 12 and 17-year-old children and adolescents in 2003.
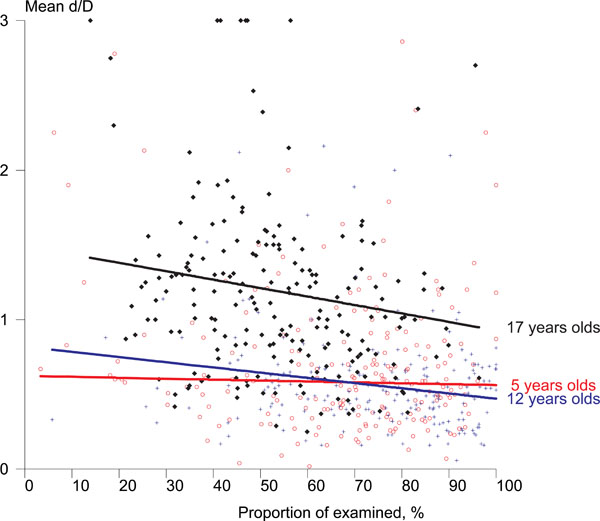
Distribution of the Finnish PDS units (n = 203) according to proportions of those examined by mean d/D values in 5, 12 and 17-year-old children and adolescents in 2003.
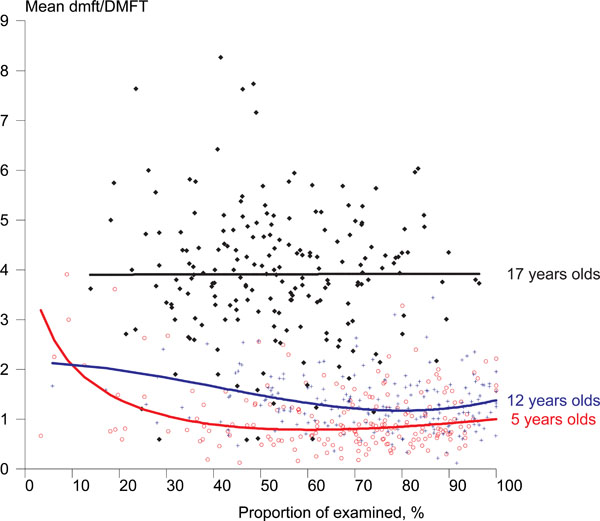
Distribution of Finnish PDS units according to proportions of those examined by mean dmft/DMFT values in 5, 12 and 17-year-old children and adolescents in 2003.
In the next step we predicted the PDS-specific outcome (index values) at 100% examination rates assuming that true relationship between the outcome and examination proportions would be similar in all PDS units. The basic idea was to use linear regression analysis, where observed outcome was the dependent variable and examination rate the independent variable, to estimate a trend that could be used to predict the outcome value at 100% examination rate. As the trend turned out to be nonlinear, we used optimal fractional polynomial transformations [11] to take the nonlinearity into account. However, the linear regression analysis gave only one mean trend for the whole data while we needed estimated trends for each PDS unit separately. We approached this problem by using quantile regression modelling [12]. Quantile regression is typically used to estimate a median regression model, i.e. the aim is to model the median of the response variable instead of the mean as in the standard linear regression analysis. This is done by minimizing a sum of absolute residuals instead of a sum of squared residuals. In the same sense as for the median, it is possible to estimate a model for any quantile of response variable by minimizing a sum of asymmetrically weighted absolute residuals. Because each (ordered) value of a response variable by definition corresponds to some quantile of the response variable, it became possible to estimate an own trend for each PDS unit. With the help of such models we were able to determine predictions for the outcome values at 100% examination rate for each PDS unit, and to calculate the mean indices based on these adjusted values. This computationally intensive estimation and calculation of adjusted means was performed using the statistical software Stata v8 (www.stata.com). The statistical packages Survo MM (www.survo.fi) and SAS v9.1 (www.sas.com) were also used in the analyses.
RESULTS
Examination Rates
Of the total number of the 49,755 Finnish 5-year olds 62% had a dental examination in 2003 in PDS units. The total number of 12-year olds was 57,433 and the number of 17-year olds was 54,436. Of them 70% and 48% respectively had been examined. The variation in examination rates between individual PDS units was wide. Most PDS units examined more than half the children in the two younger age groups, but in the oldest age group examination rates were lower (Table 2). Ten PDS units had recorded examinations for less than 20% of the 5-year-olds and 3% for 17-year-olds. Except for one, these were all small units serving less than 10,000 inhabitants and having fewer than five dentists. Five units had examined more than 90% of the 17-year-olds. These were also small units. 13% of the PDS units had examined more than 90% of the 5-year-olds, and 26% of the PDS units had examined more than 90% of the 12-year-olds. They also included some larger units (serving a population of up to 45,000 and having up to 18 dentists).
Distribution of Finnish Public Dental Service (PDS) Units (n=205) by Mean Examination Rates of the 5, 12, and 17-Year-Olds in 2003
| Proportion of Examined | PDS Units | |||||
|---|---|---|---|---|---|---|
| 5-Year-Olds | 12-Year-Olds | 17-Year-Olds | ||||
| n | (%) | n | (%) | n | (%) | |
| < 50 % | 37 | 18.1 | 24 | 11.7 | 93 | 45.4 |
| 50-75% | 76 | 37.1 | 68 | 33.2 | 86 | 42.0 |
| >75% | 92 | 44.9 | 113 | 55.1 | 26 | 12.7 |
| All | 205 | 100 | 205 | 100 | 205 | 100 |
Examination Rates and Oral Health
Figs. (2, 3 and 4) show the associations between examination rates and oral health, described as proportion of caries-free, mean d/D, and mean dmft/DMFT. In all age groups, low examination rates were associated with slightly poorer oral health, although among 17-year-olds this was apparent only in terms of the D-index. In 5-year-olds, the non-linear trends in proportions of caries-free and dmft/DMFT index showed that PDS units with a moderate proportion of examined children were associated with better oral health than PDS units with low or very high proportions of children and adolescents examined.
Adjusted National Mean Values
At the national level, on average two-thirds of the 5-year-olds, almost half of the 12-year-olds and about one-fifth of the 17-year-olds examined were caries-free, according to the traditional method of calculating the national values (Table 3). Mean d/D and dmft/DMFT values were low for 5- and 12-year-olds but substantially higher for the 17-year-olds.
Means of PDS (Public Dental Service) -Specific Values of Caries Indices with 95% Confidence Intervals (95%CI) in 5, 12 and 17-Year-Old Children and Adolescents in Finnish PDS Units (n) in 2003
| 5-Year-Olds | 12-Year-Olds | 17-Year-Olds | ||||
|---|---|---|---|---|---|---|
| Mean | 95%CI | Mean | 95%CI | Mean | 95%CI | |
| Proportion of caries- free (dmft/DMFT=0) | n = 201 | n = 202 | n = 200 | |||
| Mean of PDS -specific values 1 | 69.0 | 67.3-70.7 | 42.4 | 40.9-43.8 | 18.6 | 17.6-19.6 |
| Adjusted 2 | 66.1 | 65.0-67.1 | 42.7 | 41.5-43.9 | 18.2 | 17.1-19.3 |
| d/D –value | n = 198 | n = 198 | n = 195 | |||
| Mean of PDS-specific values 1 | 0.58 | 0.54-0.63 | 0.56 | 0.53-0.59 | 1.19 | 1.11-1.27 |
| Adjusted 2 | 0.52 | 0.49-0.56 | 0.46 | 0.43-0.48 | 0.96 | 0.89-1.03 |
| dmft/DMFT -value | n = 195 | n = 196 | n = 195 | |||
| Mean of PDS-specific values 1 | 0.85 | 0.80-0.91 | 1.27 | 1.22-1.33 | 3.91 | 3.76-4.07 |
| Adjusted 2 | 0.87 | 0.80-0.93 | 1.24 | 1.18-1.30 | 3.99 | 3.83-4.14 |
1 = Weighted by PDS population of 5, 12 and 17-year-olds.
2 = Weighted by PDS population of 5, 12 and 17-year-olds and adjusted for examination rates of 5, 12 and 17-year-olds.
Differences between the traditionally calculated, e.g. PDS-specific weighted means and their adjusted values varied according to index and age group (Table 3). Especially for d/D values, the traditional way of calculation indicated worse oral health than the examination-rate-adjusted mean values in every age group. The difference between the PDS-specific weighted and adjusted mean values were statistically significant for 12 and 17-year-olds. As regards the proportion of caries-free, the effect was rather small but reversed: traditional calculation resulted in slightly better health than the adjusted scores in 5 and 17-year-olds the difference being statistically significant for 5-year-olds. For dmft/DMFT values, differences between the values calculated in different ways were minor and not clear.
DISCUSSION
Our study showed that according to our hypothesis the local variation in examination rates was associated with the national caries index mean values. In general, low examination rates were associated with slightly poorer oral health although differences between the studied age groups and indices were detected. Especially in number of decayed teeth, the examination-rate-adjusted mean values indicated better oral health than the traditionally calculated indices. However, the overall effect of various examination rates on caries indices was only modest. This can be explained by the facts that number of those children and adolescents who had a lot of caries was low and high proportions of healthy children were examined. The study indicated that variations in examination rates did not exclusively reflect the use of individual recall intervals. Lower examination rates of children and adolescents were due to other reasons too, such as adults’ high demand for services, and lack of personnel.
The material used in this study was extracted from 205 PDS units (73% of all) covering 87% of the Finnish child population in the age groups studied. An earlier study in Finland found that assessments of oral health made by ordinary PDS dentists were in line with those made by trained epidemiologists examining the same children, especially in larger settings [13]. One explanation is that uniform instructions on diagnostic criteria to be used are given to the PDS by the health authorities. In the PDS, specific codes are used to record every treatment measure, including examinations. These codes are used to pay dentists additional productivity fees based on treatments provided, which probably leads to even more careful recording. Our data can thus be regarded as reliable and the results can be generalised for the entire country. On the other hand, aggregate level data is a weakness in our study as it was not possible to study whether the examinations provided were linked to individual’s needs. However, as majority of the children in each age group studied had relatively good oral health, it is likely that lengths of intervals are associated to oral health in the hypothesised way.
Our method for the prediction of index values at 100% examination rates may be criticised, because we had to assume that the trends based on observed data could be extrapolated to 100% for each PDS-unit. However, our technique utilised the current data effectively. Quantile regression used in the estimation of PDS-specific trends between the outcome and examination took the variation in the predictions better into account than the fit of one mean model would have done. Therefore, it was possible to estimate a “local” model for each PDS unit and use that model in the prediction. We also took into account the possible nonlinearity with the use of optimal (in terms of deviance) fractional polynomials. With this strategy we were able to predict outcome values at 100% examination rate for all PDS units with a good face validity and use these predicted values in the calculation of adjusted national mean caries indices.
We also checked that mathematical coupling related to the use of ratio variables was not an issue in our analysis. Firstly, common components only distorted the null hypothesis, the correlation was real and true, and we were not making any inferences from the regression coefficients. We simply used the models to predict the outcome value at 100% examination proportion. Secondly, the correlations of denominators and nominators among the ratio variables were very high (0.93-1) meaning that the correlation between the variables was less spurious [14].
The study showed that the examination rates varied greatly between individual PDS units and also between age groups. Similar results have been shown in Denmark and Sweden [15, 16]. The youngest and the oldest were examined less often than the 12-year-olds. The 12-year-olds have traditionally been used as the index-age group in international monitoring and their health status is continuously reported to the WHO, CECDO and OECD. This explains the popularity of examining this group to a greater extent. A lower examination rate for 5-year-olds may be explained by the fact that the age group is not yet of school age in Finland and is not as easy to reach as school-aged children. At present, there is no established practice or guidelines telling at what age the children under school-age should be examined. The low examination rates among 17-year-olds can have several explanations. Firstly, the upper limit of free oral health care was recently lowered from 18 to 17 years, and some PDS units probably still recall the 18-year-olds for examination. This age group is also difficult to recall, because not all adolescents are in the school system at that point. An obvious reason for the large variation in examination rates between the Finnish PDS units in our study was unit size. In our study the populations of the PDS units varied between 1,000 and 560,000 inhabitants. There were fewer than 3,000 inhabitants in 10% of the PDS units and more than 100,000 inhabitants in 3% of the units. The lowest and highest examination rates were found in these small units most often situated in rural or remote areas, and having recently suffered from lack of personnel. Small and even temporary drops in numbers of dental personnel could immediately be seen in patient numbers, and where again full personnel coverage could easily guarantee almost 100% coverage of the index age groups. Local treatment traditions probably explain smaller differences in examination rates between the PDS units. So far, turnover of oral health personnel has not been great in the Finnish PDS units. Various examination rates may also reflect applied individual recall intervals due to differences in oral health.
Our study showed that low examination rates were associated with slightly poorer oral health. Among 17-year-olds this was apparent only in terms of the D-index, and in 5-year-olds, the association between examination rates and proportion of caries-free or the mean dmft/DMFT-index was non-linear. In 5-year-olds worst oral health was shown in those PDS units where the proportion of children examined was low or high. Although we, due to our cross-sectional data, cannot make any causal interpretations, the finding indicates that lower examination rates reflect longer recall intervals for healthier children or adolescents, the 5-year-olds being an exception. This was previously seen in the city of Helsinki in 1999: the shorter the examination intervals proposed, the higher the caries indices [17]. This is supported by our finding concerning decayed teeth (d/D), as the traditional way of calculation indicated worse oral health than the examination-rate-adjusted mean values in every age group. Because of non-linear associations, the effects of adjustment by examination rate were not uniform. Adjustment worsened oral health in means of proportion of caries-free in 5-year-olds, and had almost no effect on the dmft/DMFT index in any of the age groups. This finding suggests that there was a clear dichotomy between the healthy and diseased children examined. In Finland, individual treatment intervals seemed to be scheduled according to instructions among children and adolescents with poor oral health, but probably not with those who had healthy dentition. A great number of PDS units still examined a high proportion of healthy children and adolescents, and this probably masked the association between examination rates and other national mean indices. Full coverage of children and young adults according to the old statutes are still strongly emphasized in many PDS units, instead of treatment based on the needs of the whole population according to goals set in the recent oral health care reform [5]. Despite of all the well-documented shortcomings of the dmft/DMFT index, it seemed to be the most stable indicator in all the three age groups studied, probably because it represents the cumulative extent of the dental caries recorded.
The associations of poor oral health with the high examination rates in 5-year-olds may reflect the fact that many of these children probably were examined by a dentist at the first time during their lives and thus the recall intervals were not yet individualised. Some other reasons certainly also play a role such as true inter-municipality differences in oral health that have been reported in Finland [4] and Denmark [18]. Association of poor oral health with high examination rates could also be attributed to discrepancies between diagnostic criteria and failed caries prevention.
It was surprising how few children were examined without seemingly systematic variation in oral health. Previous research in Norway has shown that extending children’s recall intervals saved resources without deteriorating effects on dental health [19]. Longer recall intervals were associated with a slight DMFS increment in the early 1990s but were not associated with higher caries incidence when high risk children were excluded [20, 21]. In Finland, a longitudinal study from two large PDS units reported that while the frequency of dental check-ups decreased, there was no indication of an increased prevalence of caries [22] in the age groups concerned. However, a recent review by BEIRNE et al. [23] suggested that there is not enough evidence from randomised controlled trials to draw conclusions on the health effects of altering the intervals between dental check-ups either in children or adults. Caries risk assessment tools are still deficient and unreliable [24]. A recent study in Finland indicated that good dental health relies more on the behaviour of the individual than on the preventive measures provided by dental clinicians [25]. To be of value, frequent examinations should achieve changes in patients’ health behaviour. According to a KAY & LOCKER [26], one of the most effective ways of ensuring healthy oral habits is to receive simple but individualised advice from dental staff on a regular and repetitive basis. Again, the disadvantage of being a frequent visitor is higher level of filling therapy which requires on-going maintenance [27]. Those who attend regularly may undergo repeated replacement of dental restorations because health personnel are primarily educated to treat and they are more likely to decide to treat than not to treat.
In spite of low caries levels in highly industrialised countries, monitoring caries incidence and prevalence will, according to MARTHALER [28] remain an indispensable part of dental public health. The WHO continues publishing global oral health data on 12-year-olds and the Council of European Chief Dental Officers regularly update data on the same group in the EU/EEA Member States (www.CECDO.org). In all of the Nordic countries, statistical information on children's use of oral health services and oral health is collected regularly from the PDS and published. Most of these countries use index age groups — usually the 5 or 6-year-olds, 12-year-olds and 17, 18 or 19-year-olds, depending on the extent of free care. Based on our long experience, we find that it would be important to monitor index age groups representing children with deciduous teeth and teenagers in addition to the 12-year-olds also in other EU/EEA countries. International comparisons have been considered interesting and politically important and are frequently used when setting health policy goals. The national mean scores have, however, been criticised as being difficult to compare, due to the use of local or unrepresentative national samples and various diagnostic criteria [29, 30]. International databases and registers include little information concerning this issue. There is an obvious need to standardise data collection.
CONCLUSION
The study showed that in contrast with the 80%-90% examination rates of the 1980s to mid 1990s, today about 70% of 12-year-olds are examined during a calendar year. Overall, the influence of the examination rates on the Finnish national indices was modest, although various examination rates tended to slightly overestimate the national mean d/D value, giving false signals of a decline in oral health. However, individualised examination rates do not alone explain the recent halt in children’s oral health improvement. In international comparisons, the traditionally calculated (not examination-rate adjusted) national caries index mean values seem still to be sufficiently valid.

