All published articles of this journal are available on ScienceDirect.

The Association of Osteoporosis Related to Mandibular Condyles Amongst Elderly Females: A Panoramic Radiograph Investigation using Pixel Intensity Imagery
Authors Info & Affiliations
Abstract
Introduction
This study aimed to evaluate the association between bone mineral density reduction and pixel intensity values measured at the centers of the mandibular condyles on digital panoramic radiographs, as well as their correlation with age and amenorrheic duration.
Materials and Methods
Fifty-five post-menopausal women with over 12 months of amenorrhea, available left femur bone mineral density data, and panoramic radiographs were studied. Based on World Health Organization criteria, 30 had normal, and 25 had BMD reduction. The pixel intensity values were measured from a 10-mm2 circular region of interest at the condylar head center. Statistical analyses included the Mann–Whitney U, Spearman correlation, and receiver operating characteristic analysis.
Results
Mean pixel intensity of the bone mineral density reduction group was significantly lower than that of the normal one (p = 0009). An area under the curve was 0.76 (95% confidence interval: 0.65–0.87). The specificity and sensitivity were 0.93 and 0.65, respectively. The elderly women showed a pronounced correlation between PI values and bone mineral density scores.
Discussion
Pixel intensity at mandibular condyles associates with bone density loss, correlating with age and menopause. Overall, despite its ability to correctly identify non-disease cases, the test’s moderate AUC and limited sensitivity restrict its value as a standalone diagnostic tool.
Conclusion
Pixel intensity values of the condylar bone on digital panoramic radiographs showed a negative correlation with reduced bone mineral density, with more pronounced differences in elderly women.
1. INTRODUCTION
Osteoporosis, a musculoskeletal disorder caused by deterioration of bone microarchitecture, leads to millions of fractures annually, commonly affecting the hip, spine, wrist, and forearm in older women; accordingly, “elderly women” in this study were operationally defined as those aged ≥55 years. It affects both the skeletal and maxillo-mandibular structures, as systemic osteoporosis is associated with reduced Bone Mineral Density (BMD) in subcrestal and alveolar bone, leading to ridge resorption and tooth loss. Pathological bone changes also occur in the temporomandibular joint [1]. Such maxillo-mandibular alterations may impair masticatory function, contributing to malnutrition and decreased quality of life in the older population. The trabecular pattern reflects BMD variations in women [2], and hormone-related bone loss typically begins in early menopause and declines over 4–8 years [3]. Likewise, the mandibular condyles mirrored bone quality changes, linked to decreased estrogen and progesterone levels [4].
Dual-energy X-ray Absorptiometry (DXA) remains the gold standard for diagnosing osteoporosis, particularly in the lumbar spine, distal forearm, femoral neck, and femur [5]. However, both two-dimensional (2D) and three-dimensional (3D) digital radiographs have been investigated as practical alternatives for predicting Bone Mineral Density (BMD) reduction in the jawbones of osteoporotic patients [4, 6, 7]. Digital Panoramic Radiography (DPR) is a cost-effective, accessible, and low-radiation method for opportunistic osteoporosis screening compared with Cone-Beam Computed Tomography (CBCT) and other Computed Tomography (CT) based modalities. Unlike CBCT, which requires higher radiation and exhibits variability in gray-value calibration, panoramic radiographs yield standardized 2D projections suitable for assessing mandibular cortical width and morphology related to systemic BMD [8-10]. Magnetic Resonance Imaging (MRI), though useful for soft tissue evaluation, has limited dental applicability [11, 12]. Panoramic radiographs can detect BMD variations through cortical visualization, bone texture analysis, and Pixel Intensity (PI) measurements [9, 13-15]. Despite these advantages, most previous studies have focused on cortical bone assessments or alveolar bone density, leaving a gap in understanding how osteoporosis-related changes manifest in the mandibular condyles. PI, representing grayscale data from X-ray exposure, reflects bone density without artifact interferences. Thus, the limited evidence on condylar PI analysis highlights the need to explore its potential as a quantitative marker for detecting osteoporosis-related microstructural alterations.
Comparisons of Pixel Intensity (PI) values with fractal dimensions, micro-densitometry, and panoramic visual analyses on digital dental radiographs have demonstrated that PI is the most effective parameter for detecting osteoporosis [13]. This approach aims to minimize the perceptual variations inherent in panoramic image interpretation for osteoporosis screening. It was hypothesized that reduced Bone Mineral Density (BMD) would be reflected as lower PI values in digital panoramic radiographs. Therefore, this study aimed to evaluate the correlation among PI values, age, and amenorrheic periods based on BMD measurements at the mandibular condylar centers on digital panoramic radiographs.
2. MATERIALS AND METHODS
The population sample consisted of female outpatients (aged 55 years or older) of our Medical Hospital who were included in this cross-sectional study. Furthermore, if they had a 12-month (or over) amenorrheic history, left femoral BMD information, and a referral for dental panoramic radiography at our Dental Hospital between December 2018 and December 2019, those participants were consecutively recruited into the study. Prior to the study, the required sample size was determined using G*Power software (version 3.1.9.4). Based on an assumed effect size of 0.90, a significance level of 0.05, and a statistical power of 0.80, the minimum estimated sample size was 21 participants per group. According to the principles outlined by Hertzog (2008) [16] regarding sample size considerations, a minimum of 30–40 participants per group is generally recommended for pilot studies. It is acknowledged that the strict inclusion and exclusion criteria of this study may have constrained the achievable sample size. Individuals with condylar pathology or a history of medication that affects bone metabolism (e.g., rheumatoid arthritis, diabetes, renal disease), osteoarthritis, dentition status, prostheses, or use of common bone-affecting drugs (steroids, bisphosphonates, etc.) were excluded. Despite implementing an additional 6-month extension of our recruitment protocol, only 55 subjects met the inclusion criteria and agreed to participate. These subjects were initially classified into the normal BMD (n = 30), osteopenia (n = 17), and osteoporosis (n = 8) groups, based on the World Health Organization’s criteria for the prevention and management of osteoporosis [11]. Due to the small sample sizes of the osteopenic and osteoporotic groups, these two categories were combined and reassigned to a BMD reduction group consisting of 25 patients (n = 25).
Prior to data collection, observers underwent calibration sessions to standardize region-of-interest (ROI) placement and measurement procedures. Inter- and intra-observer reliability was assessed using Intraclass Correlation Coefficients (ICC) to ensure measurement consistency. Thirty panoramic radiographs were randomly selected for a calibration session attended by the observers. Each observer viewed and measured the averaged PI values in the selected radiographs using UniWeb Viewer® version 6.1.1146. A PI value between 0 and 255 corresponded to black and white in each 8-bit digital radiograph, respectively. The mandibular condyles were evaluated on a 30-inch liquid crystal display screen with a maximum resolution of 1,920 × 1,200 pixels under regular office ambient lighting. Kallur and Varghese [17] reported the average condylar size as height 16.32 mm ± 2.16 mm, width 16.47 mm ± 2.61 mm, and length 7.65 mm ± 1.5 mm in the class I molars’ relationship. Therefore, a 10-mm2 circular ROI was manually positioned at the center of each condylar head, identified at the midpoint of the condylar outline on both horizontal and vertical axes, across all images. Image analysis was performed using [UniWeb Viewer, Version 6.1.1146], and the software’s circular measurement function automatically calculated the mean gray (pixel intensity) value within each ROI. This procedure was performed at a one-week retest interval, and the tests were conducted in isolation, with all results kept concealed from observers.
By using a rotational machine (Veraview X800; Morita, Kyoto, Japan) at 10 mA and 60–100 kV in a standardized manner, all DPR in an 8-bit system was performed by an operator. All anonymous panoramic images were stored in Digital Imaging and Communications in Medicine (DICOM) files. Each subject’s personal information, medical history, and BMD data were kept concealed from all observers until the time of radiographic evaluation.
The normality testing was performed prior to selecting nonparametric statistical tests. All numerical data were subjected to statistical analyzes using the GNU PSPP Statistics program, Version 1.6.2. Osteoporosis was determined by analyzing the DXA scan sequences at the left femur using a T-score value described in the World Health Organization’s technical report [11]. Pixel intensity measurements were obtained separately from the left and right mandibular condyles. Averaged PI values of both condyles’ densities were reported. The observers’ agreement in measuring condylar densities was calculated using ICC. The Mann–Whitney U test was used to compare the PI value in the normal and BMD reduction groups. A probability value of p-value < 0.05 was considered significant. The Spearman correlation (ρ) was used to specify a relationship between the condylar PI values and the age and the amenorrheic history period. A Receiver Operating Characteristic (ROC) curve was analyzed to determine a cut-off point for the BMD loss. This point was designated by the shortest distance between the points on the curve to its left corner.
3. RESULTS
The women’s age (years) range, mean, and Standard Deviation (SD) were 55–86, 65.50, and 7.91, respectively. Their mean amenorrheic history (years) was 15.59 with a 6.83 SD. Spearman's correlation analysis revealed a moderate positive association between age and average condylar PI values (ρ = 0.363; p-value = 0.007). No significant correlation was observed between average condylar PI values and amenorrheic period (ρ = 0.053; p-value = 0.800). A strong positive correlation was identified between age and amenorrheic period (ρ = 0.731; p-value < 0.001).
The ICC analysis showed high intra- and interobserver agreement in the first and second radiographic assessments of the condylar PI, with no significant difference (p-value > 0.05) in the PI measurements of both condyles (Table 1).
| Observer | Intra-observer Agreements* | |||
|---|---|---|---|---|
| First Reading | Second Reading | |||
| Left Condyle | Right Condyle | Left Condyle | Right Condyle | |
| No.1 | 0.91 | 0.96 | 0.91 | 0.96 |
| No.2 | 0.98 | 0.98 | 0.97 | 0.97 |
| No.3 | 0.95 | 0.95 | 0.99 | 0.99 |
| - | First reading | Second reading | ||
| Left condyle | Right condyle | Left condyle | Right condyle | |
| Inter-observer agreements* (Average measures) |
0.96 | 1.00 | 0.97 | 0.99 |
Note: *ICC=Model (mixed) TYPE(consistency) CIN=95.
Post-calculations from 10-mm2 area in both condylar heads, the averaged PI ranges were 43.00–165.15 (mean ± SD = 108.89 ± 32.63) in the normal and 48.42–135.45 (mean ± SD = 82.11 ± 25.67) in the BMD reduction groups (Fig. 1). Mann–Whitney U testing revealed significantly higher PI values in the normal BMD group compared with the BMD reduction group. This indicates that normal BMD had significantly higher PI values than the BMD reduction group (p = 0.009). The confidence intervals were 95%, and the effect size was 0.42 (Table 2). Figure 2 demonstrates the Receiver Operating Characteristic (ROC) curve.
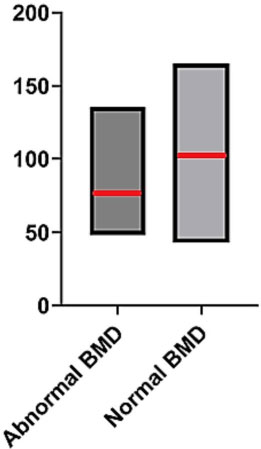
Pixel intensity values observed in normal (n=30) and BMD reduction (n=25) groups. The red lines in the bar graphs indicate each group’s mean PI value.
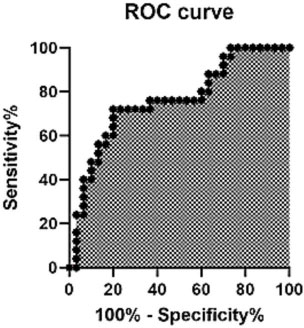
A ROC curve of the averaged condylar pixel intensities represents an overview of the diagnostic accuracy of the test for bone mineral density, using a cut-off point value of 85.
| Group (n) | Mandibular Condyles’ PI values | ||||||
|---|---|---|---|---|---|---|---|
| - | Min | Max | Mean | SD | SE | 95% Confidence Interval | |
| Upper Bound |
Lower Bound | ||||||
| Normal BMD (30) | 43.00 | 165.15 | 108.8 | 32.63 | 5.96 | 96.70 | 121.08 |
| BMD reduction (25) | 48.42 | 135.45 | 82.11 | 25.67 | 5.13 | 71.51 | 92.70 |
Abbreviations: Max, maximum; Min, minimum; SD, standard deviation; SE, standard error.
The AUC is 0.76, with a 95% confidence interval of 0.65-0.87; the predictive values are 0.89 positive and 0.75 negative, respectively (Table 3).
| AUC value | Sensitivity | Specificity | PPV | NPV | 95% Confidence Interval | |
|---|---|---|---|---|---|---|
| Lower Bound | Upper Bound |
|||||
| 0.76 | 0.65 | 0.93 | 0.89 | 0.75 | 0.65 | 0.87 |
Abbreviations: AUC: area under the curve; NPV: negative predictive value; PPV: positive predictive value.
4. DISCUSSION
Dual-energy X-ray absorptiometry serves as the primary diagnostic modality for systemic osteoporosis, whereas bone mineral density assessment is routinely employed to evaluate overall bone health [11]. Although CT provides detailed information on jawbone architecture, Digital Panoramic Radiography (DPR) offers a simple, more accessible, and cost-effective alternative for routine dental practice [8, 10, 14, 15]. The DPR facilitates a comprehensive assessment of alveolar and cortical bone through visual, textual, and pictorial data. The PI analysis can preliminary indicate an association compared to conventional radiomorphometric indices [18, 19]. During the study, DPRs were acquired using the same panoramic unit, in which the tube voltage was automatically adjusted to the patient's size by the system’s automatic exposure control. Specifically, for medium-sized patients, the tube voltage was set to 75 kVp to ensure consistency across the images used for analysis. It is acknowledged that the calibration method (e.g., step wedge, phantom, or internal reference) influences the comparability of absolute PI values across subjects. The UniWeb Viewer (Version 6.1.1146) performed 8-bit grayscale conversion as a preprocessing step to standardize the image format. However, this step does not constitute radiometric calibration and therefore does not ensure full comparability of absolute PI values across subjects. Consequently, our analyses focus on relative differences within the standardized dataset, while noting that absolute PI value comparisons may be affected by the lack of a uniform calibration reference.
The study findings demonstrated that the Pixel Intensity (PI) values at the mandibular condyle were significantly lower in the bone mineral density reduction group than in the normal group, potentially indicating a reduction in bone density. This trend aligns with previous research reporting a correlation between decreased PI values in the subcortical region of the condylar heads and systemic bone loss [20]. The condyle’s PI for BMD reduction would have limited clinical usefulness, according to the AUC of 0.76 (95% confidence interval: 0.65–0.87). The optimal cut-off PI value (85) identified in this study showed lower sensitivity than previously reported thresholds [19], which may be attributed to differences in image bit depth, population characteristics, and methods of ROI standardization. At the selected cutoff, the test demonstrated high specificity (0.93) but only moderate sensitivity (0.65). This pattern suggests that while the test correctly identifies individuals without the disease, it fails to detect a substantial proportion of true cases. Consequently, the test may have value as a rule-in tool, but its ability to serve as a reliable standalone diagnostic or screening measure appears limited. Due to a large SD in the normal BMD group, a substantial homogenous population, such as limiting the variation in age range, a comprehensive recording of a patient’s history, focusing on weight-bearing exercise, taking a diet rich in calcium and vitamin D, and being a denture wearer, can ensure reliable data in the study [2]. Another possible factor influencing the study's results was the self-reported duration of amenorrhea. The condyle’s PI for BMD reduction may not be consistent with the amenorrhoea duration; for example, in some instances, the patient may not remember the onset of amenorrhoea. In addition, further basic research on trabecular microstructure is needed to better understand the extent of mandibular bone damage in post-menopausal women.
Age-related trabecular bone loss, exacerbated by menopause, is a well-documented factor contributing to skeletal degeneration. Women aged ≥55 years were included because osteoporosis prevalence and bone mineral density reduction increase substantially with advancing age in women, beginning several years after menopause due to estrogen deficiency and continuing independently of menopausal timing, making age a robust and practical criterion for identifying at-risk populations [2, 6, 21]. Consistent with these findings, the present study’s results revealed a decline in PI values with advancing age. Nevertheless, the relatively small sample size may have reduced the statistical power and increased variability within the groups. With age-related changes, the condylar height and width demonstrated a decreasing trend [22]. Potential measurement inaccuracies may have resulted from anatomical superimpositions, morphological variations of the condyle, and cortical overlap within the ROI. To minimize potential measurement bias associated with anatomical superimposition, the examiners were carefully calibrated to recognize and manage overlapping structures during ROI placement. This calibration process is supported by the high intra- and interobserver agreement observed for the condylar PI, indicating consistent and reliable application of the 10-mm2 ROI despite the challenges posed by adjacent cortical and anatomical structures.
5. STUDY LIMITATION
The PI measurement of the condylar head supports the potential of DPR-based PI measurements as an adjunctive tool for identifying individuals at risk of BMD reduction. The study population was primarily defined by specific inclusion criteria, such as geographic population and women aged over 55 years, which may not fully represent the findings across different ethnicities. Age-stratified or subgroup analyses were not performed because further stratification would have resulted in smaller group sizes and insufficient statistical power to detect meaningful differences in PI values. Future studies with larger, more diverse populations are warranted to enable age-stratified analyses, explore age-specific variations in PI measurements, and establish reliable PI cut-off values to validate their clinical applicability in osteoporosis screening. In addition, adjustments for multiple statistical comparisons were not applied due to the hypothesis-driven nature of the analyses and the limited number of predefined comparisons.
Certain inconsistencies in ROI selection may arise from the superimposition of adjacent anatomical structures, such as the overlap between the mandibular fossa and the styloid process, as illustrated in Fig. (3). Further refinement of ROI placement protocols and advanced image-processing techniques may enhance measurement accuracy. An extensive variability in the condylar shape and the temporomandibular joint’s temporal component could lead to some difficulties in the PI analysis of condyles. In addition, a small condylar head size and a cortical bone superimposition in the ROI might result in an alteration of the PI values.
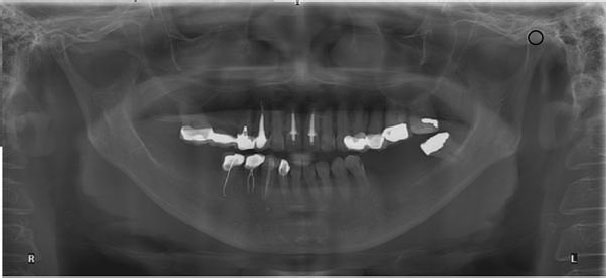
A maxillo-mandibular panoramic radiograph of an elderly female represents a superimposition (small black circle) among her left condylar head, mandibular fossa, and styloid bone period; R: right, L: left.
With age-related changes, the decreasing trend in condylar height and width may lead to certain inconsistencies in ROI selection during superimposition of adjacent anatomical structures, such as the overlap between the mandibular fossa and the styloid process, as illustrated in Fig. (3).
CONCLUSION
It may be concluded that reductions in BMD are associated with a negative correlation in condylar bone PI values measured from digital panoramic radiographs. Condylar PI measurements demonstrated high specificity but only moderate sensitivity, limiting their applicability as a standalone diagnostic tool and supporting their potential role as an adjunctive screening method. The observed differences in PI values were more pronounced in elderly women (aged ≥55 years), indicating that age-related bone changes may influence diagnostic performance. However, the limited sample size and the combination of osteopenia and osteoporosis into a single abnormal BMD group restricted the ability to establish PI-based diagnostic accuracy across distinct BMD categories. Future studies with larger, age-matched, and more diverse populations are required to validate these findings and to determine the clinical utility and optimal PI thresholds for assessing BMD using digital panoramic radiographs.
AUTHORS’ CONTRIBUTIONS
The authors confirm their contributions to the paper as follows: S.T.: Contributed to study conception and design and prepared the draft manuscript; S.T., W.T., and S.W.: Carried out data collection; S.T., W.T., and C.D.: Performed the analysis and interpretation of the results; and R.K. and T.P.: Contributed to visualization. All authors reviewed the results and approved the final version of the manuscript.
LIST OF ABBREVIATIONS
| AUC | = Area Under The Curve |
| BMD | = Bone Mineral Density |
| CIN | = Confidence Interval |
| CT | = Computed Tomography |
| CBCT | = Cone-Beam Computed Tomography |
| DICOM | = Digital Imaging And Communications In Medicine |
| DPR | = Digital Panoramic Radiography |
| DXA | = Dual-Energy X-Ray Absorptiometry |
| ICC | = Intraclass Correlation Coefficient |
| MRI | = Magnetic Resonance Imaging |
| PI | = Pixel Intensity |
| ROC | = Receiver Operating Characteristic Curve |
| ROI | = Region Of Interest |
| SD | = Standard Deviation |
| 2D | = Two-Dimensional |
| 3D | = Three-Dimensional |
ETHICS APPROVAL AND CONSENT TO PARTICIPATE
The study was approved by the Institutional Review Board - The Human Ethics Committee, Naresuan University, Thailand (COA No. 539/2017).
HUMAN AND ANIMAL RIGHTS
All procedures involving human participants were performed in accordance with the ethical standards of the institutional and/or research committees and the 1975 Declaration of Helsinki, as revised in 2013.
AVAILABILITY OF DATA AND MATERIALS
The data supporting the article's findings are available within the article.
FUNDING
Paper developed under the research project No RB2562B002, financed by the National Research Council of Thailand in the year 2019.
ACKNOWLEDGEMENTS
The authors would like to thank all the staff members of the Division of Oral and Maxillofacial Radiology and the Department of Oral Diagnosis, Faculty of Dentistry, Naresuan University, for their support for the research.

