All published articles of this journal are available on ScienceDirect.

Age Estimation using Pulp Chamber/Crown Volume Ratio of Permanent Maxillary and Mandibular Second Molars
 Norliza Ibrahim1
Muhammad Khan Asif2
Norliza Ibrahim1
Muhammad Khan Asif2
Authors Info & Affiliations
Abstract
Introduction/Objective
Age estimation is an essential component in defining multiple elements of the biological profile of unidentified individuals or people with undocumented age. This research examines the relationship between chronological age and the ratio of pulp chamber volume to crown volume in maxillary and mandibular second molars within a Malaysian population (comprising Malays and Chinese).
Methods
The study employs volumetric analysis using CBCT scans, enhanced with Mimics software, to evaluate this association. A total of 316 CBCT scans from 154 Malays and 162 Chinese, aged 18 to 65 years, were categorized into four distinct age groups for analysis.
Results
In this study, Pearson correlation analysis showed that the mandibular second molar (LM2) (-0.746) exhibited a slightly greater coefficient of correlation (R) compared to the maxillary second molar (UM2) (-0.739). The Fisher Z test demonstrated that dental age estimation is sex-independent. The study’s newly derived regression equation was validated on a separate set of 68 permanent second molars. The findings revealed Mean Absolute Error (MAE) results of 5.3 and 7.5 years for maxillary and mandibular second molars, respectively.
Discussion
The PC/CVR model showed a significant inverse correlation with age and higher accuracy in individuals under 50 years; however, performance decreased in older age groups (50+).
Conclusion
This study found that a volumetric change in the pulp chamber with age is a valid method for estimating dental age in the Malaysian population.
1. INTRODUCTION
Age estimation is an important component of forensic medicine and is applied in accidents, criminal investigations, and civil matters (hiring, marriage, and school attendance) [1]. Undocumented children have a higher risk of having their rights violated. Age estimation can also be applied to cases of missing documentation of adopted children and illegal immigrants [2, 3].
Dental age estimation is one of the most valid approaches of age determination, especially in individuals aged less than 25 years [4]. Teeth are made of calcified tissues, which are more resistant to mechanical forces, harsh chemical conditions, and extreme heat than other tissues. As a result, they can survive extreme conditions, particularly the upper/maxillary second molars (UM2) and lower/mandibular second molars (LM2). Posterior teeth are generally more resistant to the same hazardous conditions than the anterior teeth, as they are naturally shielded by the surrounding tissues, “i.e., the cheeks and the tongue”. As a result, human teeth, especially posterior teeth, are considered to be important biological tissues for human identification [5].
Techniques developed to estimate dental age using developmental phases and the eruption pattern have made age estimation easier among children and adolescents [6, 7]. In childhood, dental age can be determined using tooth development charts, whereas in young adulthood, crown and root morphology of the third molar is used to estimate age. Different stages of mineralization of permanent teeth are highly beneficial until the age of 15-16 years, which is when the development of the second molars is completed. Secondary dentin deposition is a reliable physiological age-related parameter that can be investigated to estimate an adult’s age [8, 9]. Physiological changes in teeth and their surrounding structures occur throughout a human's life. Once morphological changes in dental tissues are complete at age 25 (when the third molar is fully formed), examining the diminution of the pulp cavity resulting from secondary dentin formation becomes a useful physiological parameter for age estimation. Three-dimensional (3D) cone-beam computed tomography (CBCT) enables assessment of oral tissues with limited X-ray radiation exposure for patients [10]. This approach is one of the most reliable [7, 11-13] and least invasive methods for age determination among adults, as no tissue needs to be extracted from the body [14]; thus, this method can be applied to both living and deceased individuals. Cameriere and Ferrante [15] initially tested the pulp/tooth ratio method on periapical radiographs. Several researchers have since validated it on 3D scans [11, 16-20]. Currently, this approach is widely recognized and applied worldwide as a reliable, less intrusive technique for determining adult age. The original Cameriere approach was applied to many populations using CBCT scans [8, 11, 21, 22].
In previous studies, Asif and Nambiar [23] and Akbarizadeh and Tabrizi [24] analyzed CBCT images and found that the pulp chamber/crown (PC/C) approach had a stronger association with age than the pulp/tooth (P/T) approach. Realizing the potential of the pulp chamber/crown approach for age estimation, the authors adopted this method in the present study.
Despite numerous studies demonstrating that ethnic background and population origin significantly influence 3D dental pulp cavity volume and volumetric ratios [8, 25], other studies reported no difference regarding age estimation between ethnicities [26, 27]. However, various studies have suggested that a population-specific model remains essential for accurate age estimation.
The objective of this research was to formulate a regression equation for estimating age through studying the strength of correlation between the chronological age and the PC/C volume ratio of permanent second molars in a selected Malaysian population. This was performed using 3D CBCT scans of the permanent UM2 and LM2, as these teeth have greater longevity than the first molars and are less variable in morphology than the third molars. Statistical differences in the strength of correlation between sex (male and female) and ethnicity (Malays and Chinese) were also investigated. Subsequently, the new regression equation was applied to independent CBCT images to validate it.
2. MATERIALS AND METHODS
The ethical approval for this retrospective study was obtained from the University of Malaya Medical Ethics Committee (Ref. No: DF OS2002/0003(L)). This study was conducted in accordance with the ethical principles of the Declaration of Helsinki [28]. Patients were well aware that the data from their CBCT scans could be utilized for research and education at the faculty, and consented to their use. CBCT scans of 316 patients, 154 Malays and 162 Chinese, were retrieved from the database stored in the Oral and Maxillofacial Imaging Division, Faculty of Dentistry, University of Malaya, with exposure parameters of 120 KV and 18 mA. All scans were obtained with a medium Field Of View (FOV), a voxel size of 0.30 mm, and a scanning period of 20 seconds. The images were selected based on certain inclusion criteria, as only high-quality CBCT images of Malay and Chinese Malaysians aged 18 to 65 years with no evidence of caries or pathology associated with the targeted tooth were selected. Poor-quality CBCT images, or those not acquired using the scanning parameters of this study, and patients outside the inclusion age were excluded. In addition, any restorations, caries, or pathology associated with targeted teeth, as well as teeth with obliterated cementoenamel junctions or open apices, were excluded from the study. Sex and Gender Equity in Research (SAGER) guidelines were followed for reporting sex in this study [29].
To maintain a balanced and equally distributed sample, patients whose age ranged from 18 to 65 years were selected. The data were then categorized into four groups with 11-year intervals except for the above 50-year-old group.
The sample size of the study was calculated using G*Power software (version 3.1.9.4) by employing an F-test, Power of (1 – β err) 0.95, and α=0.05. The effect size (0.15) was determined by computing a 0.131 coefficient of determination (R2) value. The calculated sample size was 137; however, 210 UM2 and 197 LM2 were included in this study.
All selected CBCT scans were stored in Digital Imaging and Communications in Medicine (DICOM) format. A total of 316 high-quality scans stored from the i-CAT Cone Beam 3D Dental Imaging System (version 3.1.62 supplied by Imaging Sciences International, Hatfield, USA) were selected based on the patients’ age and ethnicity. Subsequently, 407 fully developed non-carious intact teeth (210 UM2 and 197 LM2) were retrieved from the database. Only one UM2 and one LM2 were selected per image to prevent any biased results when data were obtained twice from the same subject. Besides the study sample of 407 teeth, an independent sample of 68 UM2 and LM2 was selected to validate the newly developed regression equation.
2.1. Pulp chamber-to-crown Volume Ratio (PC/CVR) Measurement According to Asif et al. is as follows [8]
- The images were transferred to the Mimics software (Materialise NV, Belgium, version 16.0) as DICOM files.
- The CBCT scans were properly positioned in the axial, coronal, and sagittal views, so the targeted tooth could be identified in all three views.
- Using the segment tab, various thresholds were established to generate a binary mask that retained voxels within the upper and lower ranges for different parts (pulp and tooth).
- To isolate the tooth from adjacent structures, masks were meticulously reviewed segment by segment during the multiple-slice editing stage to ensure accurate segmentation and separation.
- The examiner chose a specific seed point to start a region growing within the targeted structure of the selected tooth, and new masks were generated for the targeted parts (pulp and tooth) of the investigated tooth, excluding unwanted surrounding structures.
- Specific refining tools, such as 'Edit Masks' and 'Multiple Slice Edit', were used for the manual inclusion or removal of unnecessary voxels.
- Following the mask editing process, the masks of the targeted pulp and tooth were selected, and then the ‘Calculate Part’ function was utilized to generate 3D-reconstructed models of both the pulp tissue and the tooth (Fig. 1).
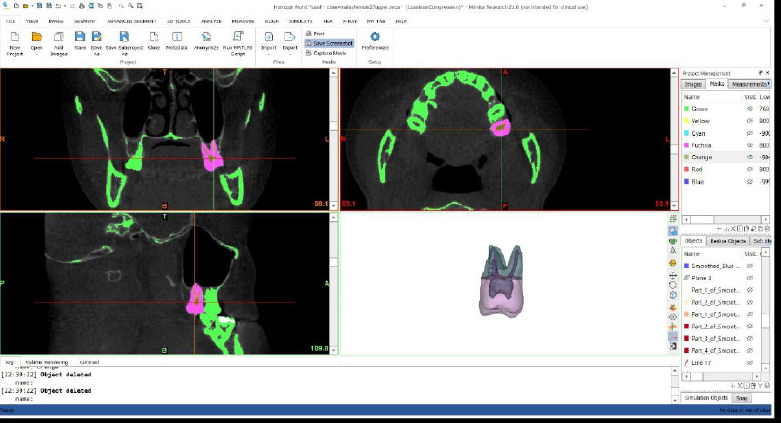 Fig. (1).
Pulp and tooth thresholding and the new mask of the maxillary left second molar.
- After generating three-dimensional models of the targeted pulp and tooth, a plane was established by selecting three points on the Cementoenamel Junction (CEJ) in the sagittal view. This plane was then aligned with the CEJ of the targeted tooth in both the coronal and axial views. Following the methodology described by Azim and Azim [30] for UM2, the floor of the pulp chamber in the coronal view was used as a reference point to distinguish the anatomical crown from the root. For LM2, the sagittal view was utilized, with the pulp chamber floor serving as a reference to separate the crown from the root [31].
- The plane on the 3D model was adjusted to align with the pulp chamber floor. Subsequently, the crown and root were separated using 3D tools at the level of the plane (Fig. 2). After selecting 'Properties' from the menu, the volume value (mm3) displayed in the box was recorded for every 3D reconstructed pulp chamber and each 3D reconstructed crown model.
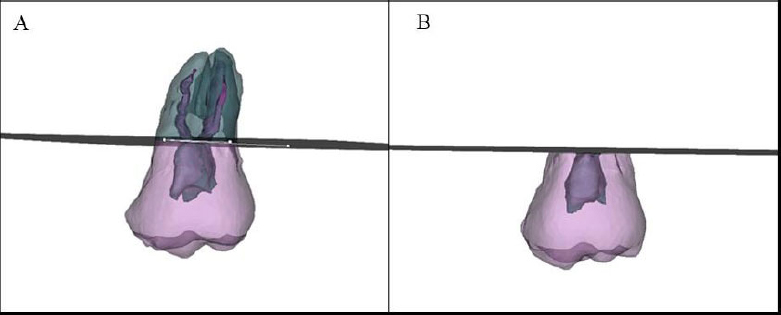 Fig. (2).
A: The plane separating different parts of a maxillary second molar 3D model. B: The separated pulp chamber and crown on the plane.
- Using Excel 2016, Pulp Chamber Volume (PCV) was divided by Crown Volume (CV) to obtain the Pulp Chamber/Crown Volume Ratio (PC/CVR).
3. RESULTS
To ensure the reproducibility of this method, an intraclass correlation coefficient (ICC) analysis was conducted to assess both intra-examiner and inter-examiner reliability. Volumetric measurements were performed on twenty randomly selected teeth, comprising ten UM2 and ten LM2, over a three-month period to evaluate intra-examiner reliability. Additionally, a second examiner, a postgraduate dental student, performed a volumetric analysis on the same sample to determine inter-examiner reliability. The ICC values obtained were 0.973 for intra-examiner reliability and 0.981 for inter-examiner reliability; these values are classified as excellent. These results demonstrate that the method is highly consistent and reproducible.
A statistical analysis using Fisher z-test showed no significant difference between ethnicity (Table 1) and sex (Table 2).
| Variables | r | Fisher’s Z test | |||
|---|---|---|---|---|---|
| Malay | Chinese | Z-value | P-value | ||
| Males | UM2 | -0.752 | -0.759 | 0.082 | 0.467 |
| LM2 | -0.738 | -0.755 | 0.186 | 0.426 | |
| Females | UM2 | -0.727 | -0.791 | 0.743 | 0.229 |
| LM2 | -0.772 | -0.759 | -0.149 | 0.441 | |
| Variables | r | Fisher's Z test | |||
|---|---|---|---|---|---|
| Male | Female | Z-value | P-value | ||
| Malays | UM2 | -0.776 | -0.727 | -0.272 | 0.393 |
| LM2 | -0.738 | -0.772 | 0.365 | 0.358 | |
| Chinese | UM2 | -0.759 | -0.791 | 0.402 | 0.344 |
| LM2 | -0.755 | -0.759 | 0.047 | 0.481 | |
In summary, there was no significant difference in the pulp chamber/crown volume ratio (PC/CVR) of UM2 and LM2 when compared by sex and ethnicity. As a result, the PC/CVR was deemed more appropriate for calculation across the entire study sample, examining the relationship between the PC/CVR of UM2 and LM2 and chronological age. This relationship was found to be significantly inverse (p < 0.05) (Table 3).
| Investigated Variable | UM2 (r) | LM2 (r) | UM2 and LM2 (r) |
|---|---|---|---|
| pulp chamber/crown VR | -0.739** | -0.746** | -0.741* |
* Significant at the 0.05 probability level
An independent t-test was applied to compare the effect of age within the two ethnicities. There was no significant difference in the mean values of PC/C volume ratio between ethnicities in the three age groups. However, the 29-39 age group showed a significant difference between Malay and Chinese populations (Table 4).
| Age Group | Malay Mean (SD) |
Chinese Mean (SD) |
t test | p-value |
|---|---|---|---|---|
| 18-28 | 0.0728 (0.018) | 0.0740 (0.013) | 0.6819 | 0.495 |
| 29-39 | 0.0492 (0.011) | 0.0621 (0.011) | 10.4201 | 0.000 |
| 40-50 | 0.0460 (0.011) | 0.0486 (0.010) | 2.2004 | 0.028 |
| 50+ | 0.0391 (0.011) | 0.0405 (0.009) | 1.2409 | 0.215 |
A multiple linear regression analysis was conducted to generate a newly derived age estimation model for Malaysian adults. A stepwise regression analysis was used to identify predictor variables that significantly contributed to the model. This is particularly useful in the current case as many predicted variables are included, so the non-significant predictors are excluded successively. It also shows different potential models, and therefore allows the researchers to choose the best predictive model. The results of the study indicated a significant linear relationship between the dependent and the independent variables. The results also showed that the assumptions of no multicollinearity and normal distribution of residuals were met.
The model yielded an R-square (R2) value of 0.543 and an adjusted R-square value of 0.540, indicating that 54.3% of the variation in age could be explained by the PC/CVR. Using stepwise regression analysis to derive an age estimation regression model, a forward selection approach was applied. All possible predictors were included in the model; gradually, the non-significant predictors were successively removed until the best model was built. Using stepwise regression analysis indicated that the p-value was less than 0.005 for ethnicity and sex, indicating that ethnicity has a significant effect on the estimated age (Table 5). Therefore, ethnicity and sex were included in the model. However, tooth type was excluded as the p-value (0.239) and standardized coefficient (-0.040) showed that it was not contributing significantly to the regression formula.
| Model | Value | Std. Error | Standardized Coefficient | t- value | P - value | 95% Confidence Interval | VIF | |
|---|---|---|---|---|---|---|---|---|
| Beta | Lower Bound | Upper Bound | ||||||
| Intercept | 66.643 | 2.469 | 26.996 | 0.000 | 60.987 | 69.090 | ||
| ethnicity | 3.021 | 0.921 | 0.110 | 3.281 | 0.001 | 1.178 | 4.798 | 1.003 |
| sex | 1.856 | 0.924 | -0.068 | 2.008 | 0.045 | -3.678 | -0.042 | 1.013 |
| measurements | -544.115 | 24.755 | -0.742 | -21.980 | 0.000 | -591.942 | -494.606 | 1.016 |
Age=66.643+3.021E-1.856S-544.115M
E= ethnicity (1=Malay, 2=Chinese) (categorical data)
S= sex (0=male, 1=female) (categorical data)
M= the obtained measurement of PC/CVR (continuous data)
Fisher z-test showed a significant difference between the study and validation samples with a p-value of 0.014 (Table 6). However, both groups exhibited a strong correlation with age.
| Investigated Variable | Validation Group (r) | Study Group (r) | Z-value | P-value |
|---|---|---|---|---|
| pulp chamber/crown VR | -0.847** | -0.741* | 2.191 | 0.014 |
The age estimation equation derived from the study was then evaluated using an independent validation group, consisting of 38 UM2 and 30 LM2. The results demonstrated acceptable values for the Mean Absolute Error (MAE) for the pulp chamber/crown volume ratio (PC/C VR) in both groups of teeth. This indicates that the derived age estimation formula is reliable and can serve as a valid method for estimating age among Malaysian adults. However, it was observed that all variables exhibited the weakest correlation in the age group above 50 years (Table 7).
| Age Group | Mean Absolute Error (MAE) (Year) | |
|---|---|---|
| UM2 | LM2 | |
| 18-28 | 4.5 | 6.5 |
| 29-39 | 3.9 | 4.5 |
| 40-50 | 3.9 | 4.2 |
| Above 50 | 9.1 | 14.9 |
| All groups | 5.3 | 7.5 |
4. DISCUSSION
Dental age estimation is one of the most reliable and valid methods of age estimation and identification in forensic sciences [23]. It is also considered valuable for identifying deceased individuals and determining the chronological age of living persons [6]. The disadvantage of using CBCT imaging is that it has limited visualization of the soft tissue. However, soft tissues are not important in some age estimation techniques [32]. Compared to other age-related physiological changes, tooth maturation exhibits less variability and has a strong correlation with chronological age [33]. Traditionally, age estimation relied on conventional imaging techniques that converted three-dimensional (3D) structures into two-dimensional (2D) images. This approach limited the visualization of crucial dental and surrounding tissue features, as they were primarily observed in the mesiodistal plane, while details in the buccolingual dimension were not fully captured [34]. Given the constraints associated with two-dimensional images, researchers have advocated for the use of 3D image analysis, specifically utilizing CBCT imaging to achieve more efficient diagnostic and treatment planning [35]. In addition, 3D imaging techniques have contributed to the age estimation domain with promising results, offering improved age estimation accuracy over traditional 2D radiography [8].
The deposition of secondary dentin occurs only after root development is completed [36]. As a result, teeth with open apices were not considered in this study. Given that secondary dentin formation may not yet have commenced in individuals under 18 years of age, they were also excluded. Consequently, the P/T (Pulp/Tooth ratio) is not a reliable method for age estimation in children and adolescents, and was not adopted [37, 38].
Previous studies reported a moderate correlation between chronological age and pulp volume [39-41]. However, pulp chamber volume as an indicator for age estimation remains debatable, as it varies between individuals, and even those of the same age may exhibit differences in pulp size [42, 43]. In contrast, the PC/CVR employed in this study mitigates individual variations in pulp chamber size more effectively than relying solely on pulp chamber volume [22]. Moreover, using pulp chamber cavity volume as the numerator is recommended to avoid the issue of a zero-value denominator in cases of pulp chamber obliteration [44].
Advances in three-dimensional (3D) imaging and image-processing software have improved forensic age estimation by enabling precise volumetric evaluation of the dental pulp cavity [45], with some researchers having chosen to reassess traditional methodologies using these innovative 3D techniques. For instance, several studies have applied the Cameriere method, which involves calculating the P/T area ratio, through 3D imaging [46-48]. Their findings demonstrated a moderate to strong correlation between the P/T area ratio and chronological age. Specifically, Salemi et al. [48] reported correlation coefficients of −0.767 for males and −0.794 for females. Similarly, Sue et al. [46] examined the P/T area ratio in maxillary and mandibular first molars, yielding determination coefficients of R2 = 0.586 and R2 = 0.609, respectively. Notably, these values align closely with the results obtained from our volumetric analysis, highlighting the consistency and reliability of 3D-based approaches in age estimation.
CBCT scans were used to assess the original Cameriere's approach on several populations. The current study's findings are compared to those of earlier research using CBCT pictures in this section. Yang et al. [21], Star et al. [22], and De Angelis et al. [18] reported a weak to moderate connection (R2 < 0.52) between the pulp/tooth volume ratio in single-rooted teeth and chronological age in the Belgian population. The PC/CVR determination coefficient values in our research (R2 = 0.54) are comparable to those found in their study.
Additionally, the correlation strength observed for the pulp chamber-to-crown volume ratio in second molars in this study was notably stronger (R = -0.741) compared to the correlations reported in previous research. Specifically, Aboshi and Takahashi [49], Yang and Fan [50], and Türk and Görmez [51] reported weaker correlations (R ≥ -0.45).
In other studies investigating pulp/tooth volume ratio, Zhan and Chen [52], Asif et al. [23], Krishnapriya and Debta [53], and Prakash [54] reported higher determination coefficients (R2>0.625) with age than those reported in the present study. However, it is worth mentioning that both studies investigated anterior teeth.
In this study, the association between age and the PC/CVR was stronger in males than in females for the UM2 among Malays. However, for the LM2 in Malays, females exhibited stronger correlation coefficient values than males. In contrast, among the Chinese population, females showed a stronger correlation than males for both UM2 and LM2. Notably, the Fisher’s Z test results indicated no statistically significant differences in the correlation coefficients between sexes, aligning with findings from previous studies [11, 18, 23, 55-57].
Asif et al. [23] and De Micco et al. [25] emphasized the necessity of developing population-specific regression equations to accurately estimate dental age in adult populations. Studies comparing equations derived from external populations with those specifically formulated for their own populations have demonstrated that the latter yield more precise results.
This study confirms the effect of ethnicity on age estimation accuracy, as stepwise regression analysis showed that ethnicity and sex contributed significantly to the age estimation model. Therefore, ethnicity and sex were included in the age estimation equation, while tooth type was excluded. Additionally, a t-test showed a significant difference in PC/CVR values between Malays and Chinese population among 29-39 age group, which justified the inclusion of ethnicity in the age estimation equation.
The multiple linear regression analysis conducted in this study revealed a moderate correlation between age and the predictor variables for both the study and validation sample. Furthermore, the results demonstrated that the MAE values for the younger age groups were more favorable than those for the 50+ age group. This could be due to the lesser number of samples included in the current study amongst this particular age group [58]. Moreover, it must be noted that dentine deposition is slower in the elderly due to diminishing of blood, lymphatic, and nerve supply to the tooth [59]. In our study, MAE values (≤7.5) showed higher accuracy than a previous study (8.41) [60]. At the same time, Anjani and Boedi [61], Kurniawan and Wibowo [62], and Song and Yang [63] reported higher accuracy than our study with MAE≤ 7.40.
In this study, a significant correlation was observed between the pulp chamber-to-crown volume ratio and chronological age in UM2s and LM2s among Malay and Chinese Malaysians. Even though research on age estimation using multi-rooted teeth remains scarce and is often time-intensive, different approaches could be exceedingly advantageous, as previous studies have suggested that the accuracy of the estimated age is significantly improved by combining two or more age-determining techniques [64]. Despite these challenges, acquiring population-specific data across different ethnic groups is crucial for enhancing the accuracy of adult age estimation. This newly developed age estimation model holds potential for effective application among Malaysian mongoloids (Malays and Chinese) aged 18 to 50 years. The age estimate model for adults can help in solving criminal cases and other jurisdictions within Malaysia's legal justice system.
One limitation of this study is that the ethnicity of the samples was determined based on the patients' recorded names in the database. This limitation is a result of our study’s retrospective design. Consequently, the rising trend of intermarriage among Malaysia's diverse ethnicities may have led to a biased sample distribution in a few cases. Also, in Malaysia, a person of Chinese or Indian descent who converts to Islam may adopt an Islamic/Arabic name. While determining ethnicity from names is a practical necessity in retrospective datasets lacking self-reported data, it introduces a known risk of non-differential misclassification bias. Within a multivariate regression framework, this can typically induce attenuation bias, which pushes the associated coefficients toward the null and underestimates true ethnic variance. However, the clinical and statistical impact of this attenuation is fundamentally limited by the shared phylogenetic and geographic ancestry of the studied populations. Because Malay and Chinese populations belong to the same broad East and Southeast Asian macro-ethnic lineage, the biological divergence in their dental development is relatively narrow.
Another concerning aspect is the inability of machine learning (ML) models to recognize different parts of teeth accurately; however, to reduce the effect of this error, the segmentation process in this study was a combination of automatic and manual segmentation. In addition, the 50+ group is poorly represented in this study sample due to increased loss of teeth in this age group.
CONCLUSION
The primary objective of our research was to formulate a regression equation for age estimation within the Malaysian population by examining the correlation between chronological age and the PC/CVR in UM2 and LM2. The results revealed a moderate inverse correlation between chronological age and the PC/CVR. The findings indicated no statistically significant differences in the strength of the correlation between chronological age and the PC/CVR across sexes. This study substantiates that the PC/CVR serves as a reliable metric for estimating age in the Malaysian population aged 18 to 50 years.
AUTHORS’ CONTRIBUTIONS
The authors confirm their contribution to the paper as follows: R.I.A., P.A/L.K.N N., N.W.C.: Study conception and design; R.I.A., N.I.: Data collection; R.I.A., P.A/L.K.N N., M.K.A.: Analysis and interpretation of results; R.I.A., N.W.C.: Draft manuscript. All authors reviewed the results and approved the final version of the manuscript.
LIST OF ABBREVIATIONS
| CBCT | = Cone Beam Computed Tomography |
| MIMICS | = Materialise Interactive Medical Image Control System |
| 2D | = Two-dimensional |
| 3D | = Three dimensional |
| R2 | = Coefficient of determination |
| R | = Correlation coefficient |
| Micro- CT | = Micro Computed Tomography |
| SPSS | = Statistical package for the social sciences |
| ICC | = Intraclass correlation coefficient |
| MAE | = Mean absolute error |
| DICOM | = Digital imaging and communications in medicine |
| PTV | = Pulp tooth volume |
| PCV | = pulp chamber volume |
| PC/CVR | = Pulp chamber/crown volume ratio |
| CEJ | = cementoenamel junction |
| UM2 | = maxillary second molar |
| LM2 | = mandibular second molar |
ETHICS APPROVAL AND CONSENT TO PARTICIPATE
The ethical approval for this retrospective study was obtained from the University of Malaya Medical Ethics Committee (Ref. No: DF OS2002/0003(L)).
HUMAN AND ANIMAL RIGHTS
This study was conducted in accordance with ethical principles of the Declaration of Helsinki.
CONSENT FOR PUBLICATIONS
Patients were well aware that the data from their CBCT scans could be utilized for research and education at the faculty, and consented to their use.
AVAILABILITY OF DATA AND MATERIALS
The data and supportive information is available within the article.
ACKNOWLEDGEMENTS
Declared none.