All published articles of this journal are available on ScienceDirect.

CBCT Analysis of Maxillary Incisor Root Resorption and Incisive Canal Changes After Clear Aligner Therapy Considering Demographic and Skeletal Patterns
Authors Info & Affiliations
Abstract
Introduction
Root resorption, a common adverse outcome of orthodontic treatment, frequently affects maxillary incisors. This retrospective cohort study evaluates root resorption, changes in the morphology of the incisive canal (IC), and changes in the spatial proximity between the maxillary central incisors (U1) and the IC following clear aligner-based retraction in extraction cases. Demographic (age, sex) and skeletal (sagittal and vertical) factors were also considered.
Methods
A total of 80 central incisors from 40 patients of Chinese Han ethnicity (15 males, 25 females; mean age, 22.54 ± 7.25 years) who underwent treatment with clear aligners (Invisalign®, Align Technology, CA, USA) following bilateral first premolar extractions were retrospectively analyzed. Sagittal skeletal classifications were as follows: Class I (n = 15) and Class II (n = 25) patterns, as well as low- (n = 10), average- (n = 13), and high-angle (n = 17) vertical facial types. Cone-beam CT scans were assessed before (T1) and after treatment (T2) for IC dimensions, cortical bone width, root–IC distances, and U1 root length and width at three heights above the labial CEJ (H1: 2 mm, H2: 4 mm, H3: 6 mm). Statistical analyses included non-parametric tests (Mann–Whitney U, Kruskal–Wallis, Wilcoxon), Chi-square tests, and logistic regression to assess group differences, associations, and predictors.
Results
The IC width and U1–IC distance decreased significantly in several subgroups, with females, adults, Class II patients, and those with high-angle patients showing the largest reductions. Root resorption was greater in females (1.13 ± 0.90 mm) than in males (0.53 ± 0.38 mm; p =0.029) and in Class II (1.06 ± 0.79 mm) compared to Class I (0.64 ± 0.76 mm; p =0.017). Closer post-treatment root–IC proximity was associated with higher resorption severity, particularly at the H1 level. Logistic regression identified U1 displacement as the most significant predictor of IC contact/invasion.
Discussion
The findings reveal distinct biomechanical effects of clear aligners on IC morphology and root resorption, with a greater susceptibility identified in females, Class II patients, and those with high-angle malocclusions. Notably, we observed a gender-specific disparity in IC remodeling, with males exhibiting superior expansion and females showing apical reduction. Crucially, statistical modeling identified the amount of maxillary incisor retraction as the strongest predictor for root-IC contact or invasion. This risk, elevated in Class II and high-angle cases, underscores the necessity of skeletal-specific treatment plans, including CBCT evaluation and modified force protocols. Clinically, these results advocate for reduced retraction forces in high-risk groups to minimize root-IC approximation and associated resorption.
Conclusion
Clear aligner-based retraction of maxillary central incisors in extraction cases can significantly alter the IC–U1 relationship and increase the risk of root resorption, particularly in females, Class II patients, and those with high angles. Pre-treatment CBCT assessment, careful torque control, reduced retraction per stage, and lighter forces are recommended for high-risk profiles to minimize IC contact and resorption.
1. INTRODUCTION
The maxillary central incisors (U1) play a pivotal role not only in dental esthetics but also in functions, such as articulation and mastication [1, 2]. Precise three-dimensional (3D) positioning of these teeth is therefore fundamental for accurate orthodontic diagnosis and treatment planning. In many cases involving dental protrusion or skeletal imbalances, retraction of the upper central incisors is a common therapeutic goal aimed at improving facial profile and occlusal relationships [3, 4].
However, the extent to which these teeth can be repositioned is constrained by anatomical and biomechanical limitations. These include the periodontium, the surrounding alveolar bone, and anchorage-dependent mechanics [3, 5, 6]. The widely referenced “envelope of discrepancy” outlines the physiological boundaries for orthodontic tooth movement, typically permitting retraction of up to 7 mm, protraction by 2 mm, and extrusion or intrusion by approximately 2–4 mm [3, 7]. In addition, a previous study of treated orthognathic cases has indicated the boundaries of overjet and sagittal skeletal discrepancy for these cases [8]. The mean overjet and reverse overjet for Class II and III malocclusions were 6.96 mm (95% CI, 6.40–7.53 mm) and 3.26 mm (95% CI, 2.87–3.65 mm), respectively [8]. These values, which are not markedly different from the “envelope of discrepancy” limits, further highlight the anatomical constraints in sagittal correction [8]. Notably, an often-overlooked constraint is the incisive canal (IC), located directly posterior to the central incisor roots, and enveloped by a dense cortical bone layer [9-11]. This anatomical proximity can restrict incisor movement and potentially pose clinical risks.
Of particular concern is the potential contact between the incisor roots and the IC during retraction, which has been associated with increased risk of apical root resorption, a serious complication that can undermine the long-term success of treatment [12-14]. Despite its relevance, the spatial relationship between the IC and U1 remains underexplored in the orthodontic literature, particularly through high-resolution 3D imaging, such as cone beam computed tomography (CBCT). Evidence from earlier studies suggests that excessive retraction may cause the incisor roots to impinge upon the IC, resulting in varying degrees of root damage and resorption [15, 16].
As clear aligner systems become increasingly popular, understanding how this treatment modality influences IC-root dynamics is critical. Unlike fixed appliances, aligners apply forces in a different manner, potentially resulting in distinct patterns of tooth movement and bone remodeling. However, there remains a paucity of data on how clear aligners affect the IC-U1 relationship.
This study seeks to bridge that gap by investigating changes in IC morphology, U1 spatial positioning relative to the IC, and associated root resorption following extraction-based retraction using clear aligners. Additionally, it examines how these outcomes are modulated by gender, age, and skeletal characteristics. By focusing on a demographically diverse patient sample, the study aims to enhance current clinical understanding and inform more individualized treatment planning in clear aligner therapy.
2. MATERIALS AND METHODS
2.1. Participants
This retrospective cohort study involved orthodontic patients who underwent maxillary incisor retraction using clear aligners (Invisalign®, Align Technology, CA, USA) following bilateral first premolar extractions in Zhenjiang Stomatology Hospital between 2015 and 2023. Ethical clearance was granted by the Institutional Review Board of the Stomatology Hospital (approval number: LZUKQ-2020-20), and all procedures adhered to the principles outlined in the Declaration of Helsinki. The study followed the STROBE guidelines for observational studies. The study followed the Sex and Gender Equity in Research guidelines (SAGER) to ensure appropriate inclusion and reporting of sex-related data.
The sample comprised 40 patients with a mean age of 22.54 ± 7.25 years. Females made up 62.5% of the cohort (n = 25), while males accounted for 37.5% (n = 15). Treatment protocols were designed to ensure precise force delivery near the anterior teeth's center of resistance, thereby reducing unwanted movements such as tipping, rotation, or vertical displacement. Direct anchorage was achieved with mini-screws positioned interdentally between the second premolars and first molars.
Sample size estimation was performed using G*Power software, targeting a power of 80% and an alpha of 0.05. The calculation was informed by prior data showing differences in root-IC spacing among subjects with varying vertical facial types (average face: 3.84 ± 1.35 mm, low face: 4.09 ± 1.21 mm, and high face: 3.05 ± 0.96 mm) [17]. Based on these values, 40 subjects were deemed sufficient and were consecutively selected.
Inclusion criteria were as follows: skeletal Class I (ANB 0°–4°) or Class II (ANB >4°-8°), subjects with maxillary or bimaxillary protrusion, as well as availability of high-quality pre-treatment (T1) and post-treatment (T2) CBCT and lateral cephalometric images. Cases were excluded if they involved craniofacial asymmetry (Menton deviation >2 mm), midline deviation >2 mm, large diastema (>2 mm), systemic or respiratory pathology, pre-existing root resorption, missing teeth (excluding third molars), congenital midline anomalies, or a history of orthodontic treatment.
Subjects were stratified into vertical skeletal categories using SN-MP angles: low angle (<27°), average (27°–37°), and high angle (>37°). Age grouping classified patients into two categories: teenagers (<18 years) and adults (≥18 years). To ensure homogeneity of treatment complexity across groups, the American Board of Orthodontics (ABO) Discrepancy Index (DI) was applied [18].
2.2. Radiographic Assessment and Measurements
All CBCT scans were obtained using a standardized imaging protocol (120 kVp, 5 mAs, voxel size: 0.3 mm) on a KaVo CBCT unit (KaVo® Dental GmbH, Germany), with images oriented parallel to the Frankfort horizontal plane. Analysis of the IC and U1 was performed on axial and sagittal views using Invivo software (version 6, Anatomage, San Jose, CA).
Three axial levels-H1 (2 mm), H2 (4 mm), and H3 (6 mm) above the labial cementoenamel junction of U1-were used to evaluate spatial relationships (Fig. 1A) [17, 19-21]. At each level, IC width (ICW) was measured as the maximum horizontal diameter through the radiolucent center (IC-Cen). The root-IC distance was defined as the shortest linear distance from the incisor root surface to the outer cortical border of the IC. Cortical bone width (CBW) was measured along the same axis from IC-Cen outward, and CBW-mid was assessed in the midsagittal slice (Fig. 1B).
The root of U1 was measured in mesiodistal and labiopalatal dimensions at the most medial (U1W-m), posterior (U1W-p), and labial-palatal (U1W-lp) aspects. Inter-root distances were recorded as Rm-Rm (most medial points) and Rp-Rp (posterior points) between the two central incisors (Fig. 1B). U1 root length was measured from the incisal tip to the apex in the sagittal plane. IC height was calculated as the vertical distance from the incisive foramen to the palatal CEJ.
Based on CBCT evaluation, post-treatment root-to-IC relationships were categorized as follows: separation, increased distance between root and IC cortical boundary; approximation, root nearing the IC without contact; contact, root abutting the IC cortical margin (distance = 0, Fig. 2A-B); and invasion, root partially or fully penetrating the IC cortical plate or lumen (distance < 0), with remaining CBW noted as zero if the lumen was involved (Fig. 2C-D).
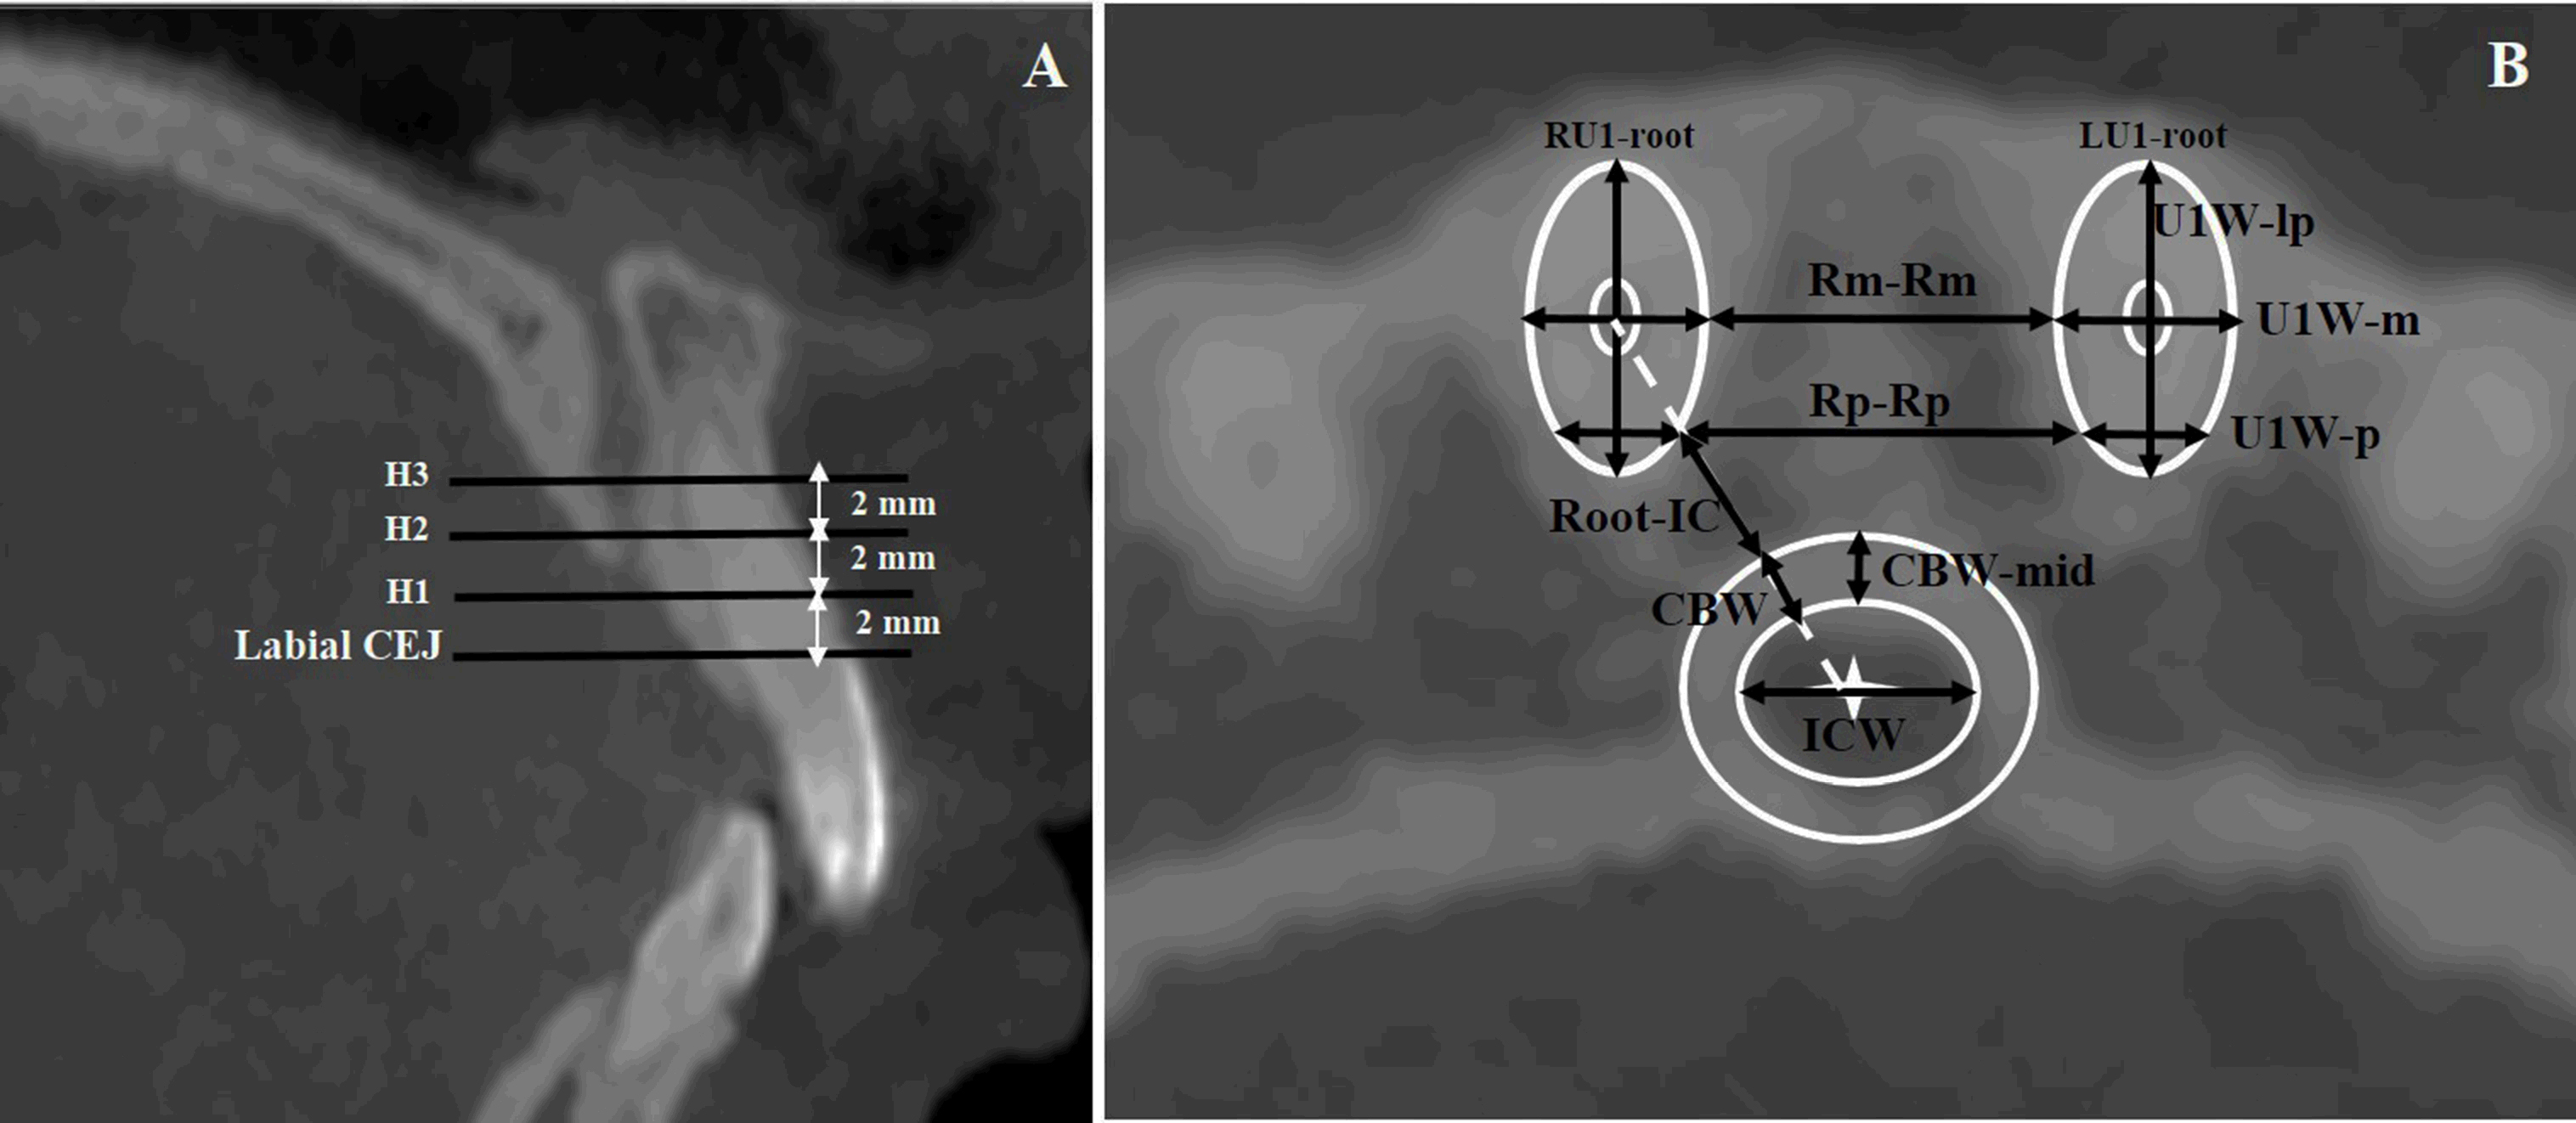
Evaluation of Central Incisor and Incisive Canal Measurements. A. Reference planes for analysis were positioned at three vertical levels-H1, H2, and H3-located 2 mm, 4 mm, and 6 mm above the labial cementoenamel junction (CEJ) of the maxillary central incisor. B. IC width (ICW) was recorded at its maximum horizontal diameter across the center of the canal (IC-Cen, marked with a white star). Cortical bone width (CBW) and root-to-IC distance were measured along a direct line between the IC-Cen and the central point of the incisor root (indicated by the dotted white line). The CBW measured at the midsagittal slice (CBW-mid) was also included. U1 root width was determined at various points: medial (U1W-m), posterior (U1W-p), and along the labial-palatal axis (U1W-lp). Inter-root spacing was measured medially (Rm-Rm) and posteriorly (Rp-Rp).
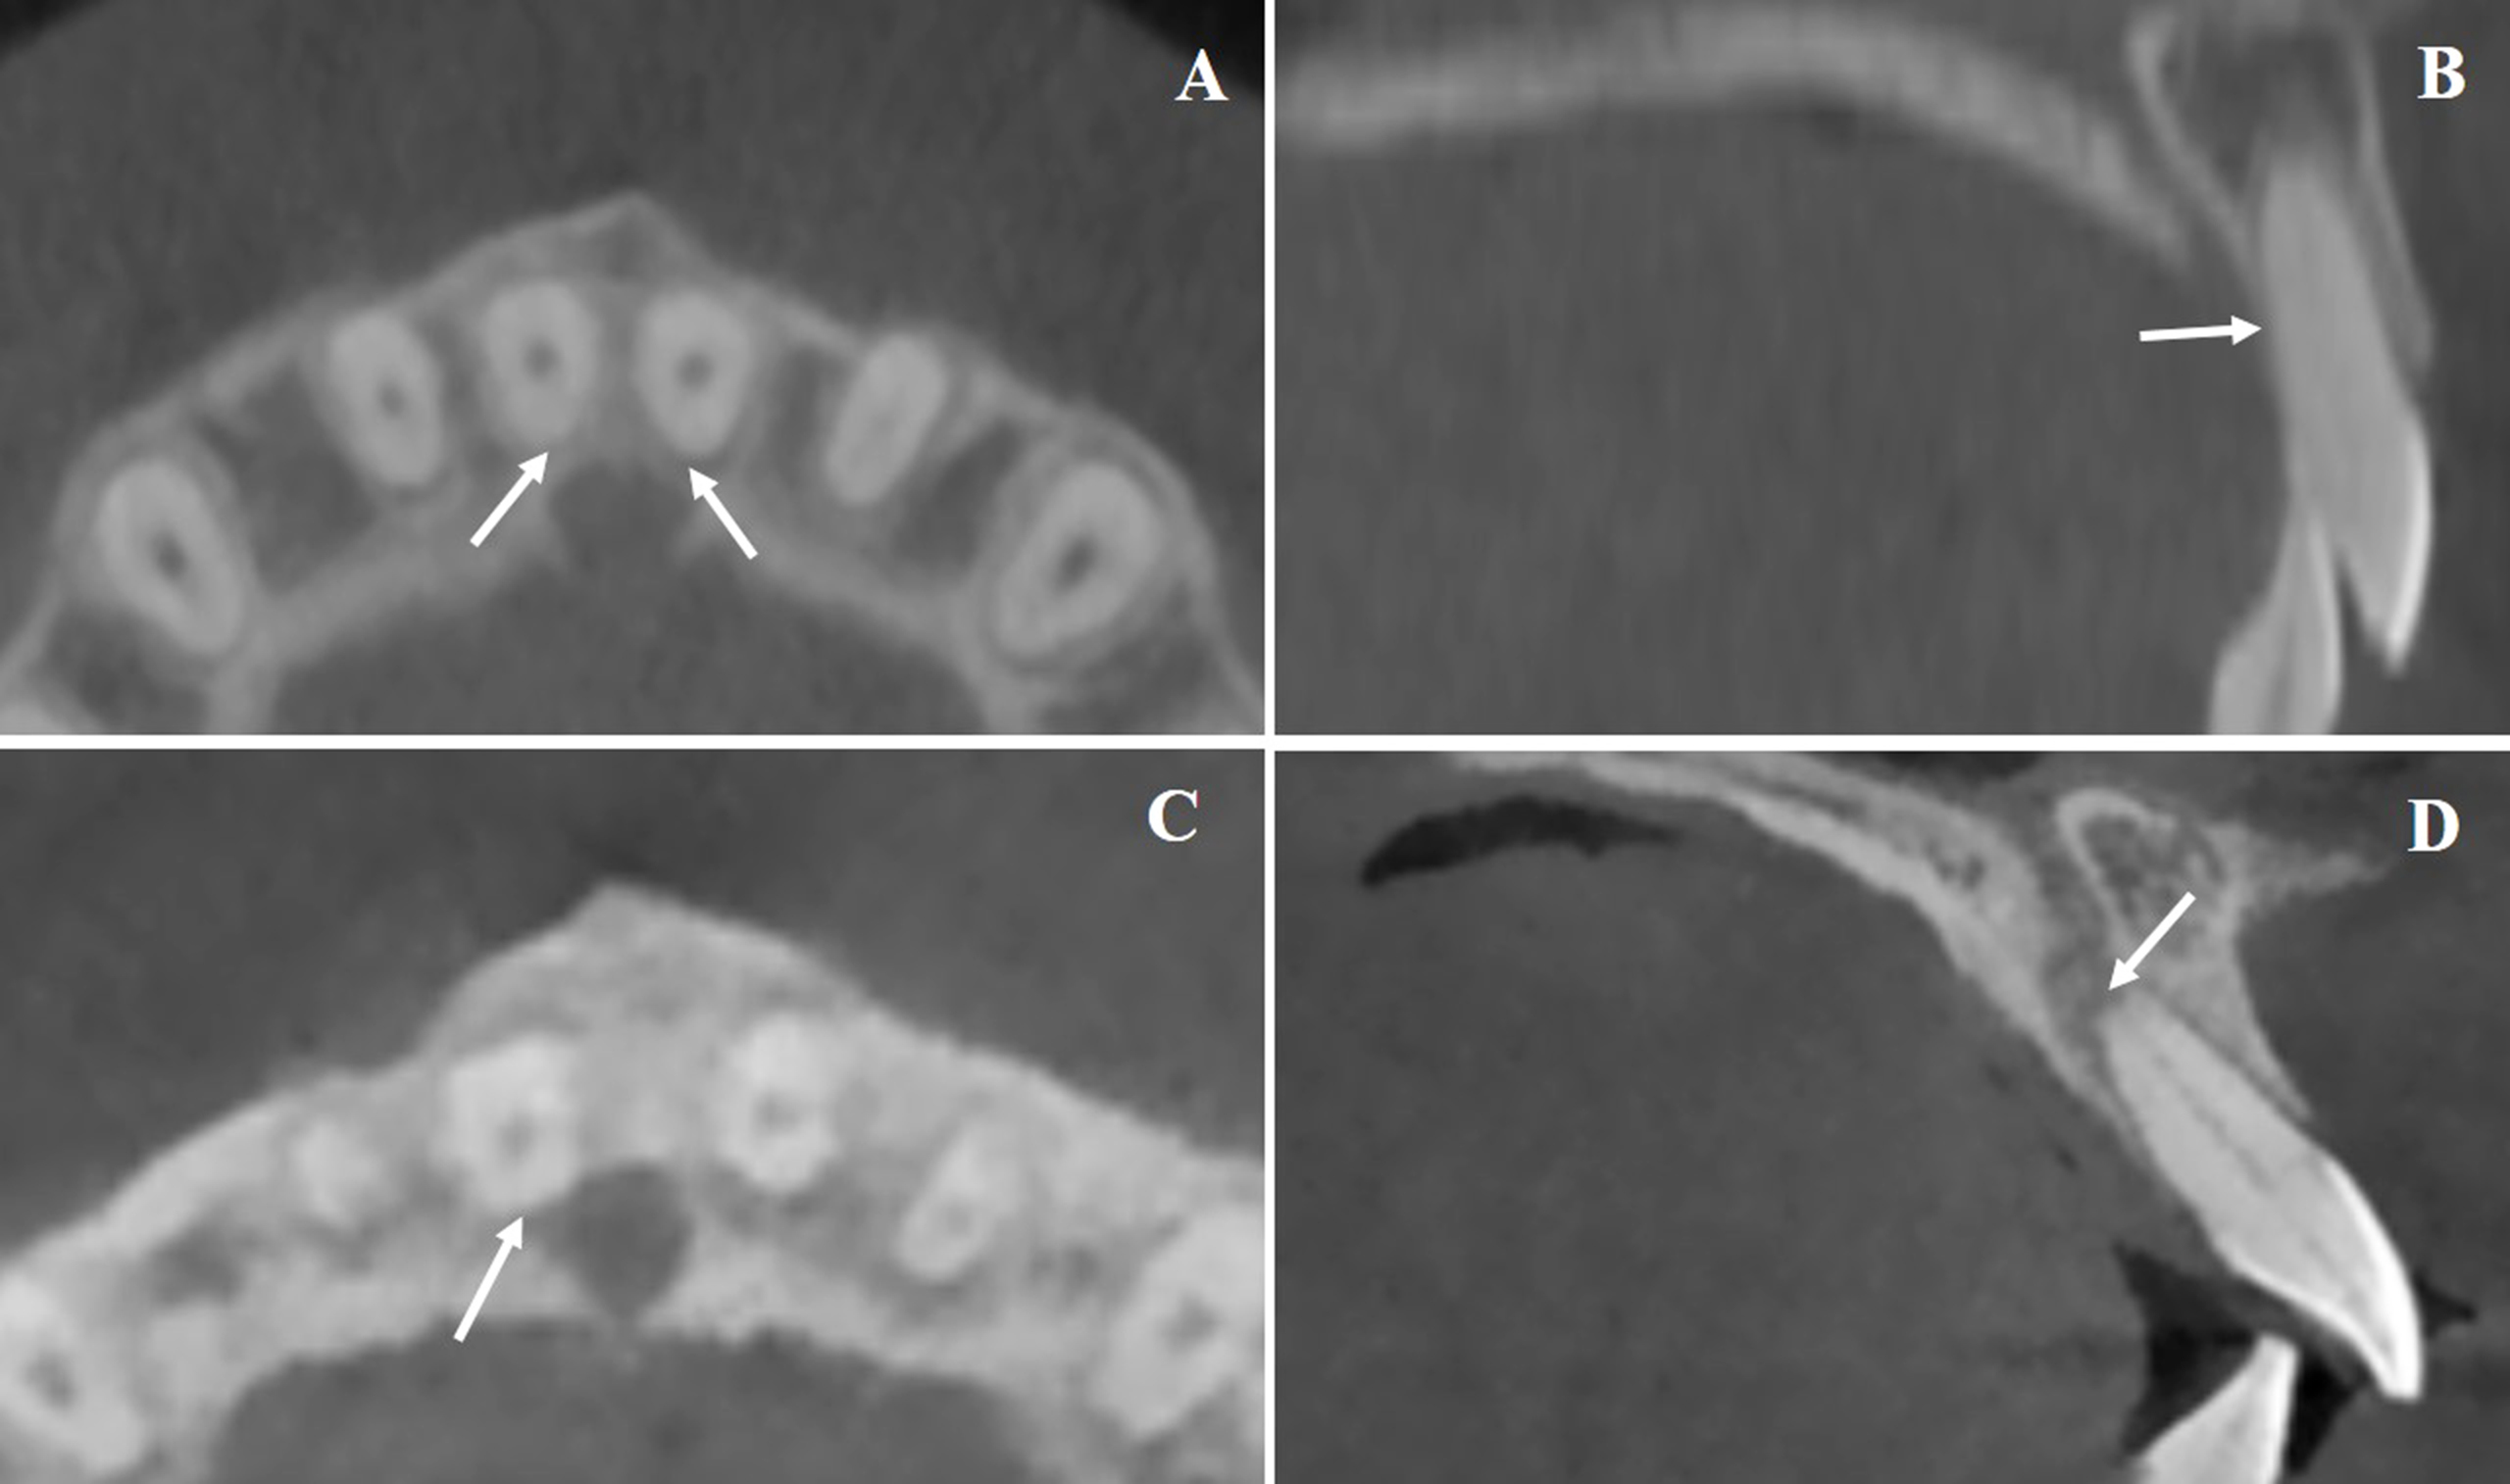
Representative Patterns of U1 Root and Incisive Canal Proximity. A and B. Representative CBCT images showing direct contact between the incisor root and the lateral wall of the incisive canal (highlighted by arrows). C and D. Examples illustrating root invasion into the IC lumen, with cortical disruption clearly visible (indicated by arrows).
Root resorption was assessed through changes in U1 root length and width, comparing T1 and T2 (Fig. 3). Incisor movement was calculated via CBCT-based cranial base superimposition. Other cephalometric variables recorded included SNA angle, U1-SN angle, and overall treatment duration.
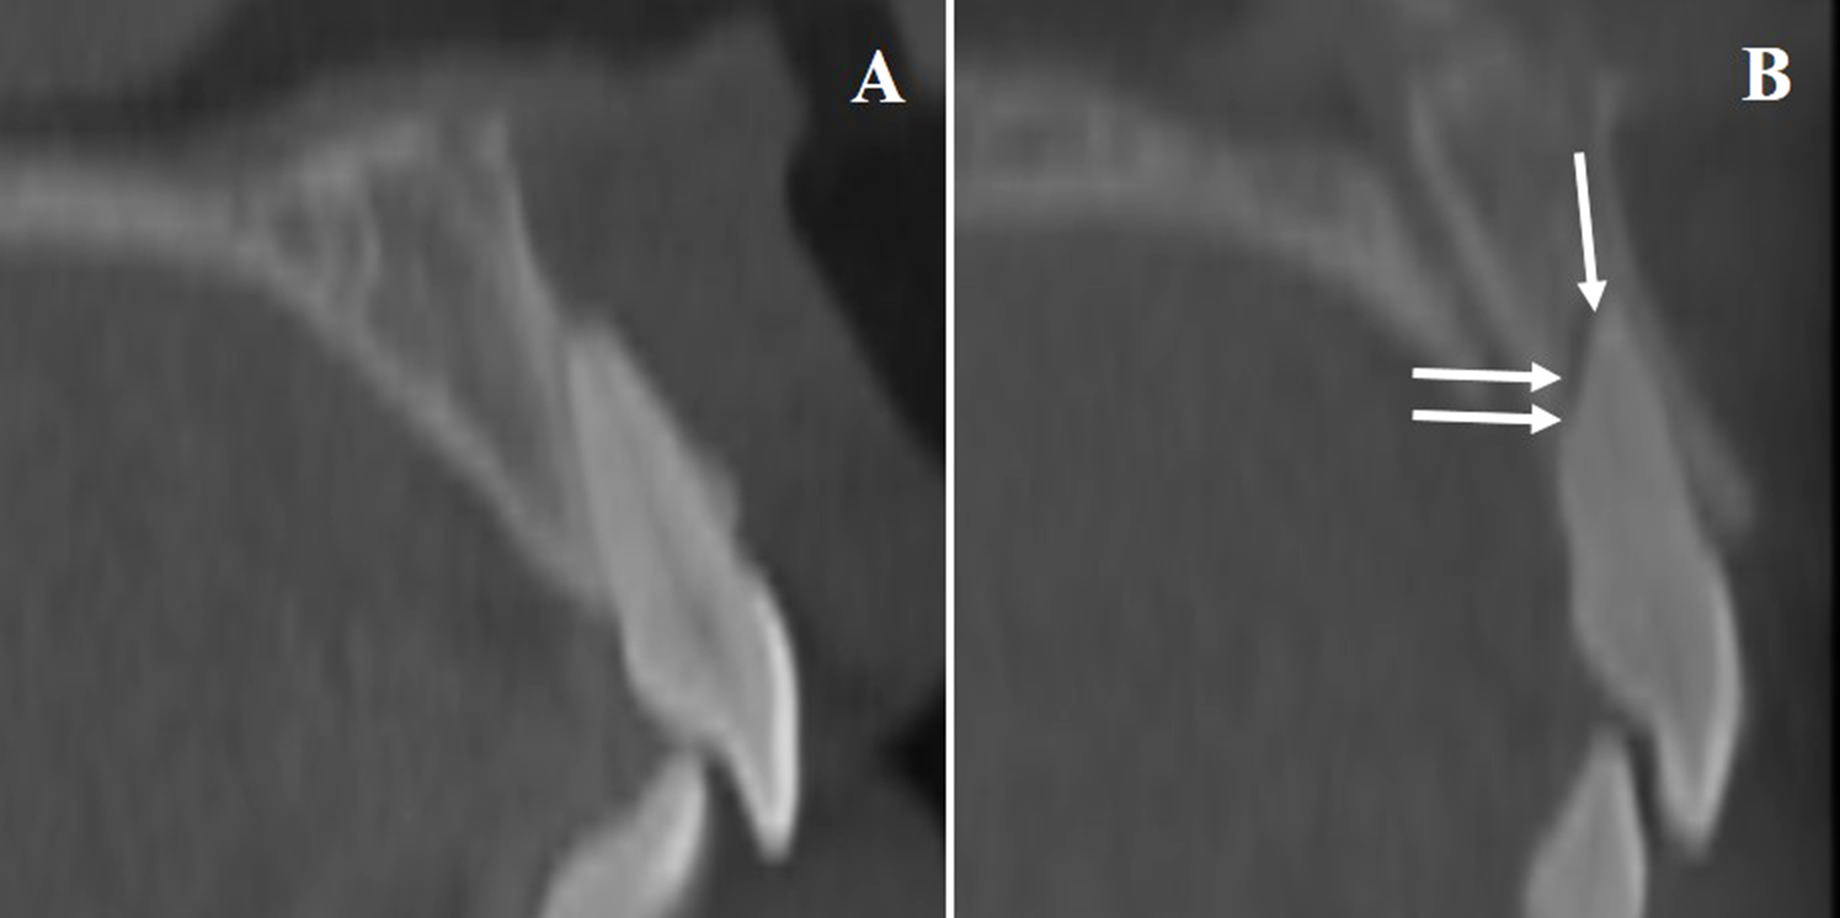
Illustration of Root Resorption in U1. A). Baseline CBCT image of a maxillary central incisor prior to treatment. B). Post-treatment scan revealing evidence of apical and horizontal root resorption (arrows mark the affected zones).
| Item | Gender | Age Groups | Skeletal Sagittal Groups | Skeletal Facial Groups | ||||||
|---|---|---|---|---|---|---|---|---|---|---|
| Male, (15) | Female, (25) | Teenagers (15) | Adults (25) | Class I (15) | Class II (25) | Low (10) | Average (13) | High (17) | ||
| Age, y | 21.00±7.21 | 23.46±7.27 | 14.90±1.14 | 27.12±5.14 | 19.57±6.46 | 24.32±7.23 | 23.60±7.62 | 25.54±7.34 | 19.62±6.17 | |
| Treatment duration, y | 3.23±1.46 | 2.75±1.27 | 2.73±1.43 | 3.05±1.31 | 2.59±1.09 | 3.14±1.46 | 2.85±1.08 | 2.38±1.33 | 3.40±1.40 | |
| U1 move, mm | -1.76±0.72 | -2.43±2.14* | -1.64±1.46 | -2.50±1.87 | -1.04±1.33 | -2.87±1.65* | -3.15±0.83* | -2.78±2.13 | -1.15±1.34 | |
| ABO score | ||||||||||
| Overjet | 1.00±1.20 | 2.08±1.55* | 1.47±1.73 | 1.80±1.38 | 0.87±0.92 | 2.16±1.60* | 2.60±0.84* | 2.46±1.51 | 0.53±1.01 | |
| Overbite | 1.27±1.44 | 1.88±1.54 | 0.93±1.03 | 2.08±1.61* | 0.67±0.98 | 2.24±1.48* | 2.80±2.04* | 1.85±0.90 | 0.82±1.01 | |
| Anterior open bite | 2.00±2.85* | 0±0 | 1.53±2.53* | 0.28±1.40 | 2.00±2.85* | 0±0 | 0±0 | 0±0 | 1.76±2.75* | |
| Posterior open bite | 0±0 | 0±0 | 0±0 | 0±0 | 0±0 | 0±0 | 0±0 | 0±0 | 0±0 | |
| Crowding | 0.60±0.83 | 0.48±0.77 | 0.87±0.92* | 0.32±0.63 | 0.87±0.92* | 0.32±0.63 | 0.40±0.84 | 0.46±0.78 | 0.65±0.79 | |
| Occlusion | 4.27±2.81 | 4.16±1.62 | 3.87±2.97 | 4.40±1.41 | 4.27±3.10 | 4.16±1.28 | 4.40±2.07 | 3.69±0.75 | 4.47±2.79 | |
| Posterior crossbite | 0±0 | 0±0 | 0±0 | 0±0 | 0±0 | 0±0 | 0±0 | 0±0 | 0±0 | |
| ANB | 1.63±2.41 | 2.90±2.73 | 1.17±2.01 | 3.17±2.75* | 0±0 | 3.87±2.37 | 3.40±3.10 | 2.31±2.66 | 1.93±2.38 | |
| SN-GoGn | 0.44±0.76 | 0.47±0.97 | 0.94±1.08* | 0.17±0.61 | 0.99±1.14* | 0.15±0.51 | 0.87±1.14 | 0±0 | 0.58±0.95 | |
| IMPA | 2.23±3.51 | 2.90±3.39 | 2.31±3.67 | 2.84±3.29 | 0.89±2.19 | 3.70±3.60* | 5.74±3.53* | 1.94±3.40 | 1.36±2.10 | |
| Total ABO score | 16.06±6.07 | 15.27±6.29 | 14.81±4.53 | 16.02±6.98 | 12.36±5.64 | 17.49±5.70* | 20.34±6.06* | 13.41±5.10 | 14.41±5.69 | |
2.3. Statistical Analysis
All analyses were conducted using SPSS version 25.0 (IBM Corp., Armonk, NY). The Mann–Whitney U test was applied to compare outcomes by gender, age, and sagittal skeletal class. The Kruskal–Wallis test was used to assess differences among vertical skeletal subgroups. Paired comparisons between T1 and T2 were conducted using the Wilcoxon signed-rank test.
Chi-square testing evaluated distribution patterns of root-IC proximity types (separation, approximation, contact, invasion) across groups. Root resorption across these categories was analyzed using the Kruskal–Wallis test with Tukey’s post hoc analysis. Logistic regression (univariate and multivariate) was employed to identify predictors of negative root-IC relationships. Statistical significance was established at p < 0.05. All measurements were independently recorded by two calibrated examiners, and intra-/inter-rater agreement was confirmed by intraclass correlation coefficients (ICCs) ranging from 0.85 to 0.98.
3. RESULTS
Participant characteristics and baseline ABO discrepancy index scores were categorized by gender, age group, sagittal skeletal classification, and vertical skeletal pattern (Table 1 and Supplementary Table 1). Across subgroups, most baseline parameters showed comparable distributions.
3.1. Changes in Incisive Canal and U1 Dimensions
As shown in Table 2, IC width increased significantly at the H2 level in males post-treatment, whereas females exhibited a notable reduction in IC width at both H1 and H2. While cortical bone width (CBW and CBW-mid) appeared stable, both metrics decreased significantly from T1 to T2. Males initially showed slightly larger root-IC distances at all three levels compared to females; however, both groups experienced significant reductions following retraction therapy (p < 0.001). U1 root length decreased more in females (mean 1.13 ± 0.90 mm) than in males (0.53 ± 0.38 mm). Root width also declined, especially at H1, with both sexes exhibiting statistically significant narrowing.
In both teenagers and adults, IC width remained generally stable pre- and post-treatment except for a notable decrease at H1 (p = 0.014 for teens; p = 0.005 for adults), as summarized in Table 3. CBW and CBW-mid showed consistent reductions across all levels in both age groups. Adults initially presented with greater root-IC distances than teenagers at all measurement levels, but this distance diminished significantly in both groups after treatment, with adults showing a larger reduction (p < 0.001). U1 root length decreased in both groups, from 22.10 mm to 21.32 mm in teenagers and from 21.15 mm to 20.17 mm in adults. Root width also decreased post-treatment, with significant narrowing at H1 in the adult group.
| Measure, mm | Male | p-value‡ | Female | p-value‡ | p-value† | ||
|---|---|---|---|---|---|---|---|
| T1 | T2 | T1 | T2 | ||||
| IC width | |||||||
| H1 | 3.56±0.62 | 3.54±0.17 | 0.969 | 4.05±0.88 | 3.45±0.78 | <0.001* | 0.004* |
| H2 | 3.48±0.23 | 3.57±0.33 | 0.009* | 3.50±0.89 | 3.32±0.87 | 0.005* | 0.001* |
| H3 | 3.01±0.21 | 3.10±0.35 | 0.462 | 3.32±0.82 | 3.15±0.77 | 0.094 | 0.065 |
| IC cortical bone width | |||||||
| H1 | 1.05±0.15 | 0.81±0.26 | 0.004* | 0.99±0.23 | 0.45±0.44 | <0.001* | 0.065 |
| H2 | 0.98±0.20 | 0.80±0.31 | 0.030* | 0.98±0.18 | 0.62±0.41 | <0.001* | 0.079 |
| H3 | 1.00±0.16 | 0.83±0.23 | 0.004* | 0.92±0.23 | 0.73±0.30 | 0.001* | 0.157 |
| IC cortical bone width-mid | |||||||
| H1 | 1.04±0.28 | 0.85±0.15 | 0.030* | 0.98±0.21 | 0.74±0.27 | 0.004* | 0.896 |
| H2 | 1.12±0.14 | 0.88±0.30 | 0.003* | 0.90±0.20 | 0.74±0.19 | <0.001* | 0.426 |
| H3 | 1.01±0.14 | 0.99±0.18 | 0.980 | 0.91±0.22 | 0.84±0.15 | 0.335 | 0.874 |
| U1 root-IC distance | |||||||
| H1 | 1.47±0.65 | 0.68±0.72 | <0.001* | 1.36±0.93 | 0.11±0.55 | <0.001* | 0.157 |
| H2 | 2.22±0.98 | 1.26±1.16 | <0.001* | 1.78±1.01 | 0.59±0.81 | <0.001* | 0.041* |
| H3 | 2.94±1.37 | 2.01±1.65 | <0.001* | 2.41±1.09 | 1.33±1.04 | 0.004* | 0.308 |
| U1 length | 22.83±1.92 | 22.30±2.01 | <0.001* | 20.71±1.73 | 19.58±1.87 | <0.001* | 0.029* |
| U1 width | |||||||
| H1 | 4.17±0.67 | 3.90±0.49 | 0.007* | 3.90±0.38 | 3.70±0.45 | 0.036* | 1.000 |
| H2 | 3.27±0.52 | 3.34±0.37 | 0.948 | 2.94±0.45 | 2.85±0.42 | 0.422 | 0.275 |
| H3 | 2.56±0.46 | 2.67±0.35 | 0.150 | 2.15±0.31 | 1.87±0.87 | 0.438 | 0.258 |
* p-values Significant at 0.05 level.
| Measure, mm | Teenagers | p-value‡ | Adults | p-value† | p-value† | ||
|---|---|---|---|---|---|---|---|
| T1 | T2 | T1 | T2 | ||||
| IC width | |||||||
| H1 | 3.94±067 | 3.60±0.57 | 0.014* | 3.82±0.91 | 3.41±0.66 | 0.005* | 0.724 |
| H2 | 3.49±0.64 | 3.50±0.59 | 0.946 | 3.49±0.76 | 3.36±0.80 | 0.188 | 0.218 |
| H3 | 3.17±0.69 | 3.11±0.54 | 0.901 | 3.22±0.67 | 3.15±0.70 | 0.237 | 0.585 |
| IC cortical bone width | |||||||
| H1 | 1.09±0.21 | 0.73±0.37 | 0.031* | 0.96±019 | 0.50±0.43 | <0.001* | 0.643 |
| H2 | 1.01±0.16 | 0.65±0.39 | <0.001* | 0.96±0.20 | 0.71±0.39 | 0.001* | 0.511 |
| H3 | 0.96±0.19 | 0.82±0.12 | 0.029* | 0.94±0.22 | 0.74±0.34 | <0.001* | 0.632 |
| IC cortical bone width-mid | |||||||
| H1 | 1.00±0.25 | 0.80±0.14 | 0.024* | 1.00±0.24 | 0.77±0.28 | 0.007* | 1.000 |
| H2 | 1.01±0.22 | 0.82±0.28 | 0.014* | 0.96±0.20 | 0.77±0.22 | <0.001* | 0.852 |
| H3 | 0.92±0.20 | 0.97±0.19 | 0.057 | 0.96±0.20 | 0.85±0.16 | 0.021* | 0.010* |
| U1 root-IC distance | |||||||
| H1 | 1.14±0.58 | 0.40±0.60 | 0.001* | 1.56±0.92 | 0.27±0.72 | <0.001* | 0.065 |
| H2 | 1.62±0.85 | 0.71±1.02 | 0.008* | 2.13±1.06 | 0.91±0.99 | <0.001* | 0.643 |
| H3 | 2.20±1.04 | 1.48±1.12 | 0.034* | 2.86±1.27 | 1.65±1.45 | <0.001* | 0.295 |
| U1 length | 22.10±2.27 | 21.32±2.58 | <0.001* | 21.15±1.88 | 20.17±2.08 | <0.001* | 0.417 |
| U1 width | |||||||
| H1 | 4.12±0.48 | 3.92±0.43 | 0.053 | 3.93±0.54 | 3.69±0.48 | 0.012* | 0.476 |
| H2 | 3.28±0.50 | 3.24±0.40 | 0.706 | 2.94±0.46 | 2.91±0.47 | 0.890 | 0.798 |
| H3 | 2.55±0.49 | 2.40±0.80 | 0.627 | 2.15±0.29 | 2.04±0.81 | 0.629 | 0.585 |
Table 4 highlights significant decreases in IC width in Class II patients at all measurement levels, compared to more modest changes in Class I individuals. Similarly, CBW and CBW-mid reductions were more substantial in the Class II group. The U1 root-IC distance declined notably in Class II patients, with a sharper drop than in Class I (p < 0.001). U1 length decreased significantly more in Class II than in Class I cases (1.06 ± 0.79 mm vs. 0.64 ± 0.76 mm, p = 0.017). Root width also decreased in both groups, with statistically significant differences at H1 and H3 (p = 0.015 and p = 0.004, respectively).
Table 5 demonstrates that IC width remained relatively stable across low-, average-, and high-angle groups, except for a marked reduction at H1 in the low-angle (p = 0.002) and average-angle (p = 0.030) subgroups. CBW and CBW-mid decreased at various levels: CBW declined significantly across all heights in the low-angle group, at H1 and H3 in the average group, and at H2 in the high-angle group. CBW-mid dropped significantly at all levels in the average-angle group and selectively in the low and high groups. All facial types exhibited a reduction in U1 root-IC distance, especially at H1 and H2, with the average-angle group showing the most pronounced pre-treatment spacing. U1 length and width decreased in all facial groups, with a particularly significant reduction at H1 in both the average and high-angle groups.
3.2. Root-IC Spatial Relationship
Among the 80 maxillary central incisors, post-treatment proximity patterns were as follows: H1 Level, 12.5% separation, 50% approximation, 22.5% contact, and 15% invasion; H2 Level, 12.5% separation, 72.5% approximation, 2.5% contact, and 12.5% invasion; H3 Level, 10% separation, 87.5% approximation, 2.5% contact, and no invasions noted. Differences were also apparent across demographic and skeletal classifications. Males were more likely to show approximation, whereas females had higher rates of contact and invasion. Teenagers tended toward approximation, while adults exhibited more instances of contact and invasion. Class I patients showed more approximation, while Class II cases demonstrated more invasive contacts, especially at H1. High-angle patients exhibited higher approximation rates, whereas low-angle cases had more contact and invasion. Left versus right side differences were minimal, though left incisors tended to show more approximation and invasion at selected levels (Table 6).
| Measure, mm | Class I | p-value‡ | Class II | p-value† | p-value† | ||
|---|---|---|---|---|---|---|---|
| T1 | T2 | T1 | T2 | ||||
| IC width | |||||||
| H1 | 3.60±0.64 | 3.40±0.68 | 0.025* | 4.02±0.88 | 3.54±0.60 | 0.002* | 0.048* |
| H2 | 3.27±0.69 | 3.34±0.68 | 0.110 | 3.62±.0.70 | 3.46±0.76 | 0.036* | 0.013* |
| H3 | 2.82±0.59 | 2.80±0.35 | 0.082 | 3.43±0.62 | 3.33±0.69 | 0.029* | 0.009* |
| IC cortical bone width | - | ||||||
| H1 | 1.01±0.20 | 0.73±0.35 | 0.046* | 1.01±0.21 | 0.50±0.44 | <0.001* | 0.263 |
| H2 | 0.95±0.17 | 0.76±0.37 | 0.060 | 1.00±0.20 | 0.65±0.39 | <0.001* | 0.264 |
| H3 | 0.95±0.20 | 0.88±0.06 | 0.248 | 0.95±0.22 | 0.70±0.33 | <0.001* | 0.051 |
| IC cortical bone width-mid | - | ||||||
| H1 | 1.05±0.24 | 0.87±0.10 | 0.024* | 0.97±0.24 | 0.73±0.28 | 0.013* | 0.950 |
| H2 | 1.01±0.23 | 0.80±0.30 | 0.008* | 0.96±0.20 | 0.78±0.21 | <0.001* | 0.735 |
| H3 | 0.91±0.19 | 0.96±0.18 | 0.053 | 0.97±0.21 | 0.86±0.17 | 0.044* | 0.009* |
| U1 root-IC distance | - | ||||||
| H1 | 0.85±0.29 | 0.42±0.51 | 0.010* | 1.73±0.87 | 0.26±0.76 | <0.001* | <0.001* |
| H2 | 1.48±0.51 | 0.88±0.66 | 0.071 | 2.22±1.14 | 0.81±1.17 | <0.001* | 0.004* |
| H3 | 2.16±0.87 | 1.62±0.94 | 0.077 | 2.88±1.33 | 1.57±1.53 | <0.001* | 0.045* |
| U1 length | 21.73±3.14 | 21.09±3.58 | <0.001* | 21.37±1.04 | 20.31±1.02 | <0.001* | 0.017* |
| U1 width | |||||||
| H1 | 4.41±0.50 | 3.94±0.60 | 0.001* | 3.75±0.35 | 3.68±0.35 | 0.218 | 0.015* |
| H2 | 3.28±0.63 | 3.12±0.71 | 0.089 | 2.93±0.35 | 2.99±0.22 | 0.363 | 0.055 |
| H3 | 2.58±0.53 | 1.99±1.28 | 0.061 | 2.14±0.23 | 2.28±0.30 | 0.061 | 0.004* |
Table 5.
| Measure, mm | Low | Average | High | p-value‡ | ||||||
|---|---|---|---|---|---|---|---|---|---|---|
| T1 | T2 | p-value† | T1 | T2 | p-value† | T1 | T2 | p-value† | ||
| IC width | ||||||||||
| H1 | 4.25±0.92 | 3.51±0.69 | 0.002 | 3.95±0.75 | 3.55±0.70 | 0.030 | 3.57±0.74 | 3.42±0.55 | 0.323 | 0.079 |
| H2 | 3.58±0.84 | 3.43±0.58 | 0.176 | 3.46±0.80 | 3.37±0.94 | 0.410 | 3.46±0.59 | 3.45±0.64 | 0.845 | 0.405 |
| H3 | 3.31±0.77 | 3.20±0.63 | 0.225 | 3.31±0.84 | 3.10±0.83 | 0.229 | 3.06±0.43 | 3.13±0.50 | 0.246 | 0.090 |
| IC cortical bone width | ||||||||||
| H1 | 0.98±0.16 | 0.31±0.40 a | 0.002 | 1.07±0.22 | 0.53±0.38ab | <0.001 | 0.99±0.21 | 0.79±0.36b | 0.300 | 0.025 |
| H2 | 1.01±0.20 | 0.62±0.53 | 0.008 | 0.90±0.18 | 0.60±0.44 | 0.055 | 1.02±0.17 | 0.80±0.17 | <0.001 | 0.751 |
| H3 | 0.98±0.18 | 0.67±0.36 | 0.008 | 0.89±0.24 | 0.67±0.32 | 0.001 | 0.97±0.21 | 0.90±0.04 | 0.429 | 0.060 |
| IC cortical bone width-mid | ||||||||||
| H1 | 1.10±0.21 | 0.77±0.16 a | 0.002 | 1.07±0.19 | 0.64±0.30 a | <0.001 | 0.90±0.26 | 0.90±0.15b | 0.949 | 0.002 |
| H2 | 0.99±0.22 | 0.77±0.28 | 0.070 | 0.90±0.18 | 0.72±0.11 | 0.003 | 1.04±0.21 | 0.85±0.29 | 0.002 | 0.775 |
| H3 | 0.95±0.21 | 0.90±0.16 | 0.627 | 0.91±0.19 | 0.82±0.13 | 0.009 | 0.97±0.21 | 0.95±0.20 | 0.113 | 0.126 |
| U1 root-IC distance | ||||||||||
| H1 | 1.38±0.86 | -.18±0.40a | 0.002 | 1.55±0.98 | 0.19±0.56a | <0.001 | 1.30±0.71 | 0.71±0.66b | 0.003 | 0.020 |
| H2 | 1.98±0.41 | 0.39±0.44a | 0.002 | 2.00±1.25 | 0.59±0.88 a | 0.001 | 1.87±1.10 | 1.30±1.15b | 0.019 | <0.001 |
| H3 | 2.71±0.71 | 1.25±1.17 | 0.002 | 2.79±1.35 | 1.68±1.36 | 0.001 | 2.41±1.37 | 1.71±1.42 | 0.022 | 0.292 |
| U1 length | 20.48±1.27 | 19.31±1.73 | 0.002 | 21.70±1.10 | 20.69±1.32 | <0.001 | 21.96±2.76 | 21.29±2.92 | <0.001 | 0.674 |
| U1 width | ||||||||||
| H1 | 3.78±0.34 | 3.65±0.41 | 0.406 | 4.26±0.57 | 4.00±0.31 | 0.024 | 3.93±0.50 | 3.68±0.55 | 0.012 | 0.659 |
| H2 | 2.83±0.23 | 2.89±0.11 | 0.365 | 3.08±0.48 | 3.14±0.21 | 0.822 | 3.19±0.59 | 3.04±0.68 | 0.237 | 0.657 |
| H3 | 2.17±0.22 | 1.74±0.93 | 0.521 | 2.17±0.29 | 2.27±0.30 | 0.410 | 2.48±0.54 | 2.35±0.95 | 0.710 | 0.357 |
| Item | Gender | Age Groups | Skeletal Sagittal Groups | Skeletal Facial Groups | U1 Side | ||||||
|---|---|---|---|---|---|---|---|---|---|---|---|
| Male | Female | Teenagers | Adults | Class I | Class II | Low | Average | High | Right | Left | |
| H1 | |||||||||||
| Separation | 0 (0) | 10 (20) | 4 (13.3) | 6 (12) | 8 (26.7) | 2 (4) | 0 (0) | 2 (7.7) | 8 (23.5) | 4 (10) | 6 (15) |
| Approximation | 27 (90) | 13 (26) | 19 (63.3) | 21 (42) | 18 (60) | 22 (44) | 4(20) | 14(53.8) | 22(64.7) | 18 (45) | 22(55) |
| Contact | 1(3.3) | 17 (34) | 5 (16.7) | 13(26) | 0 (0) | 18(36) | 8(40) | 6 (23.1) | 4 (11.8) | 12(30) | 6 (15) |
| Invasion | 2(6.7) | 10 (20) | 2 (6.7) | 10(20) | 4(13.3) | 8(16) | 8(40) | 4(15.4) | 0(0) | 6(15) | 6 (15) |
| p-value | <0.001* | 0.212 | <0.001* | <0.001* | 0.419 | ||||||
| H2 | |||||||||||
| Separation | 0 (0) | 10 (20) | 4 (13.3) | 6 (12) | 6 (20) | 4 (8) | 0 (0) | 4 (15.4) | 6 (17.6) | 6 (15) | 2 (10) |
| Approximation | 28(93.3) | 30 (60) | 22 (73.3) | 36 (72) | 22(73.3) | 36 (72) | 16(80) | 16 (61.5) | 26 (76.5) | 26 (65) | 32(80 |
| Contact | 1 (3.3) | 1(2) | 1(3.3) | 1(2) | 0 (0) | 2 (4) | 0 (0) | 0 (0) | 2 (5.9) | 2 (5) | 0 (0) |
| Invasion | 1 (3.3) | 9 (18) | 3 (10) | 7 (14) | 2 (6.7) | 8 (16) | 4 (20) | 6 (23.1) | 0 (0) | 6 (15) | 4 (10) |
| p-value | 0.002* | 0.967 | 0.251 | 0.006* | 0.386 | ||||||
| H3 | |||||||||||
| Separation | 0 (0) | 8 (16) | 4 (13.3) | 4 (8) | 4 (13.3) | 4 (8) | 0 (0) | 4 (15.4) | 4 (11.8) | 4(10) | 4(10) |
| Approximation | 30(100) | 40 (80) | 26(86.7) | 44 (88) | 26(86.7) | 44(88) | 20(70) | 20(76.9) | 30 (88.2) | 36(90) | 34(85) |
| Contact | 0 (0) | 2 (4) | 0 (0) | 2 (4) | 0 (0) | 2 (4) | 0 (0) | 2 (7.7) | 0 (0) | 0(0) | 2 (5) |
| Invasion | 0 (0) | 0 (0) | 0 (0) | 0 (0) | 0 (0) | 0 (0) | 0 (0) | 0 (0) | 0 (0) | 0 (0) | 0 (0) |
| p-value | 0.016* | 0.439 | 0.439 | 0.093 | 0.627 | ||||||
| U1 Root-IC Relationship | U1 Root Resorption, mm | p-value |
|---|---|---|
| H1 | - | <0.001* |
| Separation (n = 10) | 0.29±0.48a | - |
| Approximation (n = 40) | 0.58±0.47ab | - |
| Contact (n = 18) | 1.01±0.87bc | - |
| Invasion (n = 12) | 1.38±0.94c | - |
| H2 | - | 0.075 |
| Separation (n = 10) | 0.24±0.46 | - |
| Approximation (n = 58) | 0.83±0.76 | - |
| Contact (n = 2) | 1.04±0.00 | - |
| Invasion (n = 10) | 1.04±0.84 | - |
| H3 | - | <0.001* |
| Separation (n = 8) | 0.04±0.19a | - |
| Approximation (n = 70) | 0.90±0.74b | - |
| Contact (n = 2) | 0.03±0.00ab | - |
| Invasion (n = 0) | - | - |
| Factor | U1-IC Relationship | Univariate Analysis | Multivariate Analysis | |||
|---|---|---|---|---|---|---|
| Positive (28) | Negative (212) | p-value | p-value | OR | 95% CI | |
| Age, y | 22.70±7.14 | 22.51±7.27 | 0.939 | - | - | - |
| Treatment duration, y | 2.56±1.17 | 2.99±1.36 | 0.343 | - | - | - |
| U1 movement, mm | -.71±0.64 | -2.68±1.65 | <0.001* | 0.023* | 243.549 | 2.994-198.778 |
| U1 length, mm | 18.53±1.70 | 21.86±1.75 | <0.001* | - | - | - |
| Rm-Rm distance, mm | 2.15±0.21 | 2.78±1.04 | 0.60 | - | - | - |
| Rp-Rp distance, mm | 3.34±0.28 | 4.22±1.06 | 0.012* | - | - | - |
| IC height, mm | 4.56±1.16 | 3.41±0.51 | 0.003* | - | - | - |
| IC width, mm | 3.59±0.85 | 3.91±0.81 | 0.244 | - | - | - |
| U1-IC distance, mm | 0.87±0.33 | 1.61±0.91 | 0.010* | - | - | - |
| ABO index score | 7.65±3.24 | 16.70±5.56 | <0.001* | - | - | - |
| SNA (°) | 80.32±4.47 | 83.22±4.19 | 0.041* | - | - | - |
| U1-SN (°) | 105.23±6.96 | 105.29±7.62 | 0.982 | - | - | - |
3.3. Root Resorption by Proximity Category
As seen in Table 7, resorption severity correlated with the degree of IC proximity. At the H1 and H3 levels, statistically significant differences in root resorption were observed across categories (p < 0.001), with increasing resorption from separation to invasion. The progression from approximation to contact and invasion consistently demonstrated a worsening resorption trend.
3.4. Factors Influencing U1–IC Relationships
Among the 240 recorded measurements (both right and left U1s at three levels), a negative U1–IC relationship (contact, approximation, or invasion) was observed in 212 cases, with only 28 showing separation. Univariate analysis identified several predictors for negative U1–IC interaction: U1 displacement magnitude, initial root length, posterior inter-root distance (Rp-Rp), IC height, U1–IC distance, SNA angle, and ABO discrepancy score (p < 0.05) (Table 8). Multivariate logistic regression isolated U1 displacement as the strongest independent predictor of negative root–IC proximity (p = 0.023; OR = 243.549; 95% CI = 2.994–198.778), suggesting that larger incisor movements significantly increase the risk of IC encroachment.
4. DISCUSSION
This investigation explored how anterior retraction using clear aligners influences the morphology of the incisive canal, its spatial association with the maxillary central incisors, and the degree of root resorption in cases involving premolar extraction. Unlike earlier studies centered on fixed appliance therapy, this research offers novel insight into the biomechanical and anatomical effects of clear aligners, particularly when stratified by gender, age, and skeletal pattern.
Post-treatment, changes in IC width were evident, especially at the H1 and H2 reference levels. Among male patients, expansion was noted at H2, whereas female participants exhibited IC narrowing at both H1 and H2. These findings echo the concept that orthodontic forces can induce bone remodeling within the anterior maxilla, although responses appear to differ by sex, potentially due to hormonal factors and underlying bone density variation [22]. Interestingly, while teenagers and adults both showed reduced IC width at H1, their IC dimensions remained relatively stable otherwise, contrasting with earlier findings from fixed appliance studies that reported broader IC changes. This may reflect the more targeted and controlled forces exerted by clear aligners, which could result in localized rather than extensive skeletal remodeling.
Cortical bone measurements consistently decreased across genders and age groups, indicating the potential for retraction forces to alter cortical architecture, even in aligner-based mechanics. Notably, men demonstrated greater thinning at H2 and H3, whereas women had significant reductions at H1, reinforcing the idea that gender-specific physiological differences influence how bone responds to mechanical stress during orthodontic treatment [22].
A pronounced decline in U1 root-to-IC distance post-treatment was found in all subgroups, but this change was more marked in females and adults. This narrowing of spatial separation was accompanied by a greater reduction in U1 root length and width in these groups. Such trends align with prior research indicating that adult patients and females are more susceptible to orthodontic root resorption, likely due to variations in bone turnover rates and mechanical sensitivity [15, 23].
The sagittal skeletal pattern also influenced the extent of root displacement and resorption. Class II cases, characterized by more protrusive maxillary anatomy, experienced greater reductions in U1–IC distance and a higher incidence of root contact or invasion-particularly at H1 and H3. These results support the notion that anatomical predisposition in Class II patients may amplify the risk of root proximity to the IC when anterior teeth are retracted.
Vertical facial classification offered additional insights. High-angle patients showed the greatest drop in root-IC spacing, particularly at H1 and H2. These individuals, often exhibiting thinner alveolar bone, appear more vulnerable to root encroachment on the IC during retraction. This underscores the need for clinicians to consider vertical skeletal characteristics when planning incisor movement, especially in extraction protocols.
Overall, root resorption was more pronounced in females and Class II patients, with average resorption of 1.13±0.90 mm in females compared to 0.53±0.38 mm in males, and 1.06±0.79 mm in Class II versus 0.64±0.76 mm in Class I subjects. These results align with those of earlier studies, indicating that specific demographic and skeletal profiles are associated with a higher risk of adverse root changes. The combination of reduced root-IC spacing and increased IC contact likely contributes to elevated resorption rates in these groups.
When examining proximity patterns at three measurement levels (H1–H3), contact and invasion were most frequent at H1, while approximation dominated at H2 and H3. This aligns with findings linking increased resorption severity to closer IC-root relationships [15, 16, 19]. Gender-specific trends persisted, with males primarily showing approximation, and females experiencing more frequent contact and invasion. Similar patterns were observed across age and skeletal classifications: adults and Class II/high-angle patients exhibited more IC-root invasions, whereas teenagers and Class I/low-angle patients showed greater approximation without contact.
The clinical relevance of the current findings is substantial. Recognizing that specific groups, such as females, adults, and individuals with Class II or high-angle profiles, are more prone to root resorption and IC proximity helps clinicians tailor interventions accordingly. These patients may benefit from lighter retraction forces, reduced displacement targets, or more frequent radiographic monitoring to limit risks.
Our findings align with prior CBCT-based research on fixed appliances, which reported that maximal anterior retraction can reduce root–IC distance and increase resorption risk [15, 16, 24]. However, the present study demonstrates that clear aligners, despite their staged force application, can produce similar proximity changes in susceptible subgroups. In contrast to reports where fixed appliances caused more generalized IC remodeling, our results suggest that aligners appear to produce more localized changes, potentially due to differences in force vectors and torque control.
To mitigate the risk of root–IC contact, especially in females, Class II patients, and those with high-angle skeletal patterns, aligner treatment plans should incorporate strategies, such as reducing the retraction amount per stage, using optimized torque and root control attachments in the anterior segment, and employing mini-screw anchorage to facilitate bodily movement rather than tipping. Techniques such as pre-adjusted edgewise brackets with customized torque values or segmented arch mechanics may offer improved root positioning control, though these methods require careful biomechanical planning to avoid overloading or imprecision [25, 26]. In addition, increasing the frequency of radiographic monitoring in high-risk profiles and staging extraction space closure to allow adequate bone remodeling before final root positioning can further reduce the likelihood of adverse root–IC interactions.
The IC exhibits considerable variation in shape, ranging from Y-shaped and cylindrical to funnel-shaped morphologies, which may influence root proximity outcomes. Future studies should evaluate whether these morphological subtypes correlate with different resorption risks and adapt force protocols accordingly.
While the present findings provide meaningful insight into IC–root interactions during clear aligner therapy, they should be interpreted with caution. The retrospective design, limited subgroup sizes, and reliance on linear CBCT measurements mean that the results are preliminary and require confirmation in larger, prospective cohorts. Thus, clinical recommendations, such as routine CBCT screening or adjustments in retraction staging, should be viewed as provisional guidelines rather than definitive protocols. Compared with fixed appliances, where continuous forces often produce broader patterns of root resorption and more generalized IC remodeling, clear aligners appear to induce more localized changes, likely due to their segmented force delivery and torque expression. Nevertheless, the overall biomechanical risks, particularly in high-risk profiles, such as females, adults, and Class II or high-angle patients, remain similar between treatment modalities. Future work should integrate volumetric or morphometric assessments, account for potential confounders, such as treatment duration, compliance, and adjunctive anchorage use, and explore patient-specific factors like bone density and genetic susceptibility to further refine risk prediction and clinical decision-making.
5. STUDY LIMITATIONS
Several limitations warrant acknowledgment. First, the retrospective design introduces potential selection bias and restricts control over confounding variables such as treatment variability and patient compliance. Second, although the overall sample size was statistically justified, subdivision into gender, age, and skeletal subgroups reduced statistical power for certain analyses, increasing the risk of type II errors. Third, all outcomes were assessed using linear CBCT measurements; volumetric or surface-based morphometric approaches, as well as finite element modeling, would provide a more comprehensive 3D evaluation of IC and root changes. Fourth, while inter- and intra-rater reliability was high, potential observer bias cannot be entirely excluded. Fifth, the CBCT voxel size of 0.3 mm may underestimate subtle root resorption or cortical remodeling; future studies employing smaller voxel sizes may improve detection. Sixth, root morphology variation (e.g., conical, dilacerated forms), a known factor in resorption susceptibility, was not classified in this study and warrants future investigation. Finally, additional confounders such as treatment duration, aligner wear compliance, and use of adjunctive anchorage (e.g., mini-screws) were not systematically accounted for, which may have influenced outcomes.
Future prospective and randomized studies with larger, more balanced samples are needed to validate these findings. Incorporating volumetric analyses, standardized root morphology classifications, and direct comparisons with fixed appliance mechanics will provide deeper biomechanical insights. Moreover, emerging approaches, such as bone density assessment, genetic predisposition testing, and computational biomechanical simulations, may enhance the prediction of resorption risk and guide individualized treatment planning.
CONCLUSION
Clear aligner retraction of maxillary central incisors in extraction cases significantly influences incisor root resorption and proximity to the incisive canal, with variation by gender and skeletal pattern. Greater incisor retraction, particularly in females, Class II, and high-angle patients, increases the risk of root resorption and canal contact. Treatment should incorporate CBCT-based evaluation, reduced forces, and close monitoring in high-risk cases to minimize anatomical compromise.
AUTHORS’ CONTRIBUTIONS
All authors contributed to the study conception and design: R.K.A., X.D., R.J., and K.A.S.: Material preparation, data collection, and analysis were performed; R.K.A. and K.A.S.: The first draft of the manuscript was written; and all authors commented on previous versions of the manuscript. All authors read and approved the final manuscript.
LIST OF ABBREVIATIONS
| IC | = Incisive canal |
| UI | = Maxillary central incisor |
| H1, H2, H3 | = Heights 2 mm, 4 mm, and 6 mm above the labial cementoenamel junction of U1, respectively |
| ICW | = Incisive canal width |
| CBW | = Cortical bone width |
| U1W-m | = U1 root width at the most medial points |
| U1W-p | = U1 root width at the most posterior points |
| U1W-lp | = U1 root width at the most labiopalatal points |
| Rm–Rm | = Inter-root distance at the most medial points |
| Rp–Rp | = Inter-root distance at the most posterior points of the U1 root |
ETHICS APPROVAL AND CONSENT TO PARTICIPATE
This study was approved by the Ethics Committee of the Zhenjiang Stomatology Hospital, Zhenjiang, China (LZUKQ-2020-20).
HUMAN AND ANIMAL RIGHTS
All human research procedures followed were in accordance with the ethical standards of the committee responsible for human experimentation (institutional and national), and with the Helsinki Declaration of 1975, as revised in 2013.
AVAILABILITY OF DATA AND MATERIALS
The data supporting the findings of the article is available at Zhenjiang Stomatological Hospital, China drive (https://www.zjkqyy.net/wapZjkqIndex).
ACKNOWLEDGEMENTS
Declared none.

