All published articles of this journal are available on ScienceDirect.

A Study on the Correlation between the Expression of a Cysteine Protease, Cathepsin L, and its Inhibitor, Cystatin A, in Oral Lichen Planus
Authors Info & Affiliations
Abstract
Background
Cathepsin L (Cat-L), a cysteine protease, and cystatin A (Cys-A), a cysteine protease inhibitor, are known to be involved in Oral Lichen Planus (OLP). The imbalance in expression between these two proteins may favor OLP pathogenesis.
Objective
This study aimed to evaluate the correlation between the expression of Cat-L and Cys-A in OLP.
Methods
Thirty specimens of OLP and 30 specimens of normal tissue were used for immunohistochemistry. The pattern of cell staining, number of positive cells, and cell staining intensity were recorded. An Immunoreactive Score (IRS) was also assigned.
Results
Cat-L and Cys-A were found in all OLP specimens. In the control group, Cat-L and Cys-A were demonstrated in 83.33% and 96.67% of cases, respectively. Cat-L was primarily seen in the stratum basale in the OLP and control groups. In contrast, Cys-A expression was seen in the whole epithelium in both groups, and the intensity was lowest in the stratum basale. The percentage of positive cells, score of positive cells, staining intensity, and IRS of Cat-L and Cys-A were significantly higher in OLP than in control specimens (p < 0.05). Interestingly, a positive correlation between Cat-L and Cys-A was found in the control group but not in the OLP group.
Conclusion
The expressions of Cat-L and Cys-A were significantly higher in OLP tissues compared to normal tissues. The alterations in expression of the Cat-L cysteine protease and its Cys-A inhibitor in OLP may indicate that these two proteins play a role in the pathogenesis of OLP.
1. INTRODUCTION
Oral Lichen Planus (OLP) is a common chronic mucocutaneous inflammatory disease that affects 1-2% of the population [1]. It is found mostly in middle-aged female patients [2]. Clinically, OLP presents as red and white lesions that can cause varying degrees of oral discomfort. The histology of OLP is characterized by a dense, band-like subepithelial lymphocytic infiltration, degeneration of basal keratinocytes, and disruption of the basement membrane. The etiology and pathogenesis of OLP are not clearly understood, but some evidence points out that immunological processes, such as cell-mediated immune responses, play a role [2]. Previous research has suggested that OLP is primarily a T-lymphocyte-mediated disease, with CD4+ lymphocytes being the most common type of T-lymphocyte in the subepithelial area, and is triggered by antigens associated with Major Histocompatibility Complex (MHC) class II expressed by Langerhans cells or keratinocytes. The CD4+ lymphocyte then activates the CD8+ lymphocyte to perform apoptotic activity [3]. Non-specific immune responses, such as the activity of mast cells and many chemokines in OLP, have also been shown to play a role in pathogenesis [2].
Cathepsin L (Cat-L) is a lysosomal cysteine protease that participates in inflammatory processes and immune responses, including toll-like receptor signaling pathways, MHC class II-mediated antigen presentation, and generation of natural killer T-cells and CD4+ lymphocytes [4, 5]. Cat-L is upregulated in chronic inflammatory skin diseases, such as atopic dermatitis, psoriasis, lupus erythematosus, cancer, and lichen planus [4, 6, 7]. A previous study suggested that Cat-L is implicated in OLP pathogenesis [7]. Cat-L is regulated by endogenous inhibitors, such as cystatins, thyropins, serpins, and other proteins [5]. Loss of balance in the activity can lead to a pathological condition [5]. Cystatin A (Cys-A) is a cysteine protease inhibitor that forms a tight and reversible covalent bond with Cat-L [8]. Cys-A-conjugated liposome as a drug carrier system has also been shown to target Cat-L [8]. Furthermore, an earlier study revealed Cys-A to be overexpressed in OLP when compared to normal tissues, suggesting the possible role of Cys-A in OLP [9]. Another report investigated the expression of Cat-L and Cys-A in normal skin, seborrheic keratosis, and Squamous Cell Carcinoma (SCC) using Immunohistochemistry (IHC) [10, 11]. The results indicated that in terms of the staining cell intensity of the two enzymes, there was a reverse relationship between the well-differentiated SCC and the undifferentiated SCC. From the aforementioned studies, it is possible that the imbalance of Cat-L and Cys-A is related to the pathogenesis of OLP; however, there has been no study on the correlation between these two proteins in OLP.
Therefore, this study aimed to evaluate the correlation between the expression of Cat-L and Cys-A in OLP by IHC. The results from this study may improve the understanding of the roles of Cat-L and Cys-A in OLP.
2. MATERIALS AND METHODS
2.1. Specimens
The G*-power program was used for sample size calculation, with the study size effect of 0.8 and the power of 0.8 [12]. From the calculation, it was estimated that the sample size used in this study should not be less than 26 per group. In this study, 30 paraffin-embedded specimens from OLP patients were analyzed. OLP was clinically and histopathologically diagnosed in all specimens by oral medicine specialists and oral pathologists. For the control group, 30 normal tissue specimens were collected during the third molar removal surgery from volunteers who had given written informed consent. The tissue specimens used in this study were fixed in 10% formalin for 24 hours and then histologically processed and embedded into a paraffin block. The paraffin-embedded tissues were from the year 2018-2020.
The research project was approved by the ethical committee for research on human subjects at Srinakharinwirot University with approval number SWUEC-029/2563X.
2.2. Immunohistochemistry (IHC)
The immunohistochemical staining was performed using the EnVision kit (Dako Agilent, California, USA). Briefly, 4 μm-paraffin-embedded specimens were deparaffinized and rehydrated. Antigen retrieval was performed in pH 6.0 citrate buffer by using a microwave method (700 W). Endogenous peroxidase activity blocking was done after cooling the samples down. Following the use of a wash buffer, the specimens were treated with mouse monoclonal cathepsin L antibody (SC-32320, Santa Cruz Biotechnology, Texas, USA) or mouse monoclonal cystatin A antibody (SC-376759, Santa Cruz Biotechnology, Texas, USA) at a concentration of 1:500 and incubated at 4°C overnight. Next, the sections were incubated with a secondary antibody, which was followed by a washing process. Immunoreactivity was visualized with 3,3’-diaminobenzidine (DAB) for 5 minutes. The slides were counterstained with hematoxylin, dehydrated, and mounted with a mounting medium (Bio Mouth HM, Bio-Optica, Milano, Italy). The specimens of a human kidney and stomach were used as the positive controls of Cat-L and Cys-A, respectively. A protein block with no primary antibody was used as the negative control.
2.3. Data Collection and Interpretation
Eight areas from each slide were selected and captured with 400× magnification using a light microscope (Olympus, Tokyo, Japan) (four areas from epithelium and four areas from connective tissue were randomly selected). The cell staining pattern of Cat-L and Cys-A expression was recorded. The ImageJ program was used for counting the number of cells manually. A total of at least 1,000 cells was counted on each slide. Among these, the number of cells that showed a brown color in the cytoplasm or nucleus of the cells was considered positive. The percentage of positive cells was graded as follows: 0 = no positive cells, 1 = <10% positive cells, 2 = 10-50% positive cells, 3 = >50-80% positive cells, and 4 = >80% positive cells. The staining intensity was scored as follows: 0 = no color staining, 1 = mild staining, 2 = moderate staining, and 3 = intense staining. The multiplication of the positive cell scores (0-4) with the staining intensity scores (0-3) yielded Immunoreactive Scores (IRS) in a range of 0-12. An IRS can be interpreted as follows: 0-1 = negative, 2-3 = mild, 4-8 = moderate, and 9-12 = strongly positive [13]. The correlation between Cat-L and Cys-A expression was also evaluated.
| - | OLP (n=30) |
Control (n=30) |
p-value |
|---|---|---|---|
|
Age (years) Mean ± SD Range |
54.03±16.39 22 – 84 |
25.73±10.79 18 - 61 |
<0.001 |
|
Gender Male Female |
11 (36.7%) 19 (63.3%) |
12 (40%) 18 (60%) |
0.791 |
|
Type of OLP Atrophic Erosive Reticular Plaque |
20 (66.7%) 7 (23.3%) 2 (6.7%) 1 (3.3%) |
n/a n/a n/a n/a |
n/a |
|
Site of Biopsy Gingiva Buccal mucosa Palate Muccobuccal fold |
6 (20%) 22 (73.33%) 1 (3.33%) 1 (3.33%) |
30 (100%) 0 (0) 0 (0) 0 (0) |
n/a |
|
Duration of lesions (months) Mean ± SD Range |
18.84±20.94 0 – 72 |
n/a n/a |
n/a |
The evaluation of cells with positive staining and cell staining intensity was performed by one investigator (N.P.). The interpretation of IHC was calibrated by an oral pathologist (W.H.). Regarding inter-investigator calibration, Cohen’s weighted kappa value was 0.834.
2.4. Statistical Analysis
The data were analyzed using SPSS version 26.0 (SPSS Inc., Illinois, USA). Mean percentages of positive cells were analyzed by Student’s t-test. The differences between groups were verified using the Mann-Whitney U test. A p-value < 0.05 was considered to be of statistical significance. Correlation analysis was performed by using Spearman’s rank.
3. RESULTS
Demographic data of the OLP and control groups are presented in Table 1. The ratio of women to men was 3:2 in both groups. The mean ages of the OLP and control groups were 54.03±16.39 and 25.73±10.79 years, respectively. The difference in age between the OLP and control groups was noted (p < 0.001). The samples of the OLP group were derived from buccal mucosa (73.33%), gingiva (20%), palate (3.33%), and mucobuccal fold (3.33%). All the control samples were obtained from gingiva. The most common clinical type of OLP in this study was the atrophic type (66.7%).
3.1. The Cell Staining Pattern of Cat-L and Cys-A
Cat-L and Cys-A were expressed in all 30 OLP specimens. In the control group, there was an expression of Cat-L and Cys-A in 25 (83.33%) and 29 (96.67%) specimens, respectively. Cat-L in OLP and normal tissues was expressed in the cytoplasm of epithelial cells. Cat-L was found mainly in the lower stratum spinosum and stratum basale (Fig. 1). However, Cys-A immunostaining in OLP and normal tissues was expressed in both the cytoplasm and nucleus of epithelial cells, and it was exhibited in the whole epithelium (Fig. 2). The staining intensity of Cys-A was mild in the stratum basale and strong in the upper layers of epithelium and intercellular space. In connective tissue of OLP, the expressions of Cat-L and Cys-A were mostly found in inflammatory cells. For the control group, the staining pattern of Cat-L and Cys-A was similar to that of the OLP group, but the staining intensity was weaker than that in the OLP group (Figs. 1, 2).
3.2. The Percentage and Score of Positive Cells, Staining Intensity, and IRS
The mean percentages of Cat-L and Cys-A positive cells were significantly higher in the OLP group than in the control group (p < 0.001 and p = 0.037, respectively). The scores of positive cells in the OLP group ranged from 1 to 3 for Cat-L and 1 to 4 for Cys-A, while the scores of positive cells in the control group ranged from 0 to 2 for Cat-L and 0 to 3 for Cys-A, respectively. In the OLP group, 57% of samples displayed moderate staining intensity for Cat-L, and 73% displayed intense staining intensity for Cys-A. Contrarily, most of the control group displayed mild staining intensity for Cat-L and moderate staining intensity for Cys-A. The scores of positive cells and staining intensity for both Cat-L and Cys-A were significantly higher in the OLP group than in the control group (p < 0.001). Additionally, the majority of the OLP group had moderate IRS for Cat-L and Cys-A, whereas most of the control group had negative IRS for Cat-L and moderate IRS for Cys-A (p < 0.001) (Table 2).
3.3. Correlation between Cat-L and Cys-A Expression
Because the cells with positive staining were mainly found in the epithelial layer, we analyzed the correlation between the two enzymes in epithelium, connective tissue, and the whole tissue. In the control group, a strong positive correlation between Cat-L and Cys-A regarding the percentage of positive cells was found in the epithelium (r=0.658, p<0.05), but a moderate positive correlation was found in the whole tissue (r=0.410, p<0.05). There was also a moderate positive correlation found between Cat-L and Cys-A with regard to the score of positive cells and the IRS in epithelium (r=0.563, p<0.01 and r=0.439, p<0.05, respectively). However, there was no correlation observed between Cat-L and Cys-A expression in the OLP group (Table 3).
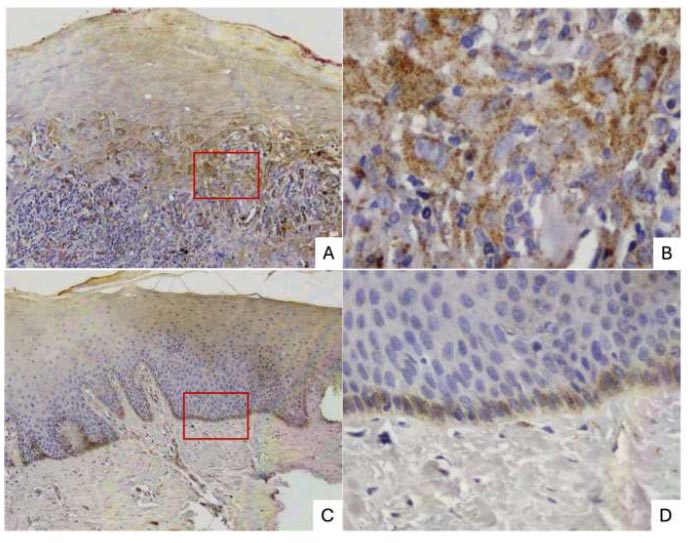
(A) ×100 In OLP, Cat-L was mainly stained at the lower stratum spinosum and stratum basale of epithelium, as well as in the inflammatory cells of the connective tissue layer.
(B) ×400 In OLP, Cat-L was expressed in the cytoplasm of epithelial cells and the nucleus of inflammatory cells.
(C) ×100, (D) ×400 In normal tissue, Cat-L was expressed as mild intensity and observed at stratum basale and stratum spinosum of epithelium.
(OLP: oral lichen planus).
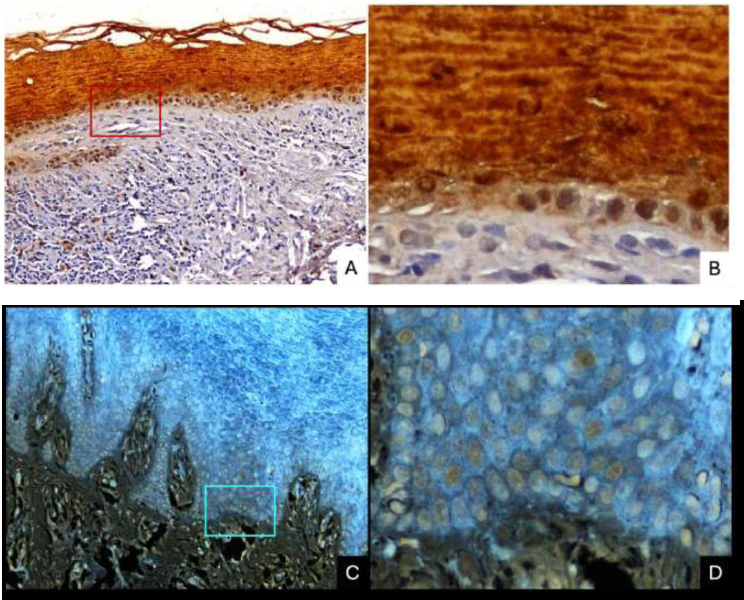
(A) ×100 Cys-A in OLP showed positive staining in the whole epithelium, with lower staining intensity at the stratum basale and high expression at the intercellular space. Cys-A expression was also found in the connective tissue, mostly in inflammatory cells.
(B) ×400 Cys-A in OLP was expressed in the whole epithelium with lower staining intensity at the stratum basale.
(C) ×100, (D) ×400 Cys-A in normal tissue showed positive staining in the whole epithelium, with lower staining intensity at stratum basale and high expression at intercellular space.
(OLP: oral lichen planus).
4. DISCUSSION
Our group had previously investigated the expression of Cat-L and Cys-A in OLP in a separate study. Because Cys-A has been shown to selectively inhibit Cat-L activity and to have the potential for use in cancer treatment [8], we aimed to evaluate the correlation between the expression of Cat-L and Cys-A in OLP lesions. We found Cat-L and Cys-A in all OLP specimens. While Cat-L and Cys-A were found in 25 (83.33%) and 29 (96.67%) of the control specimens, respectively, Cat-L and Cys-A expressions were higher in the OLP group in terms of the number of positive cells, staining intensity, and IRS, than those in the control group. These results have been found to be consistent with our previous findings [7, 9], which have reported the overexpression of Cat-L and Cys-A in OLP and further confirmed the involvement of these two enzymes in OLP. Additionally, correlation analysis revealed a positive relationship between Cat-L and Cys-A in normal tissues, but no correlation was found in OLP tissues. The findings have suggested that the alterations in the levels of Cat-L and its inhibitor, Cys-A, in OLP, might be involved in the pathogenesis of the disease.
| - | Cat-L | p-value | Csy-A | p-value | ||
|---|---|---|---|---|---|---|
| OLP | Control | - | OLP | Control | - | |
|
No. of positive cases No. of negative cases |
30 0 |
25 5 |
- | 30 0 |
29 1 |
- |
| Percentage of positive cells: Mean ± SD | 28.35±16.88 | 9.45±15.29 | < 0.001 | 38.02±20.71 | 27.14±18.70 | 0.037 |
|
Score of positive cells: n (%) 0 = no positive cell 1 = < 10% 2 = 10-50% 3 = > 50-80% 4 = > 80% |
0 (0) 6 (20) 21 (70) 3 (10) 0 (0) |
5 (16.7) 17 (56.7) 8 (26.7) 0 (0) 0 (0) |
< 0.001 | 0 (0) 3 (10) 18 (60) 7 (23.3) 2 (6.7) |
1 (3.3) 6 (20) 20 (66.7) 3 (10) 0 (0) |
< 0.001 |
|
Staining intensity: n (%) 0 = no color 1 = mild 2 = moderate 3 = intense |
0 (0) 13 (43.33) 17 (56.7) 0 (0) |
5 (16.7) 22 (73.3) 3 (10) 0 (0) |
< 0.001 | 0 (0) 4 (13.3) 4 (13.3) 22 (73.3) |
1 (3.3) 10 (33.3) 12 (40) 7 (23.3) |
< 0.001 |
|
IRS: n (%) 0-1 = negative 2-3 = mild 4-8 = moderate 9-12 = strongly positive |
6 (20) 7 (23.3) 17 (56.7) 0 (0) |
22 (73.3) 5 (16.7) 3 (10) 0 (0) |
< 0.001 | 3 (10) 1 (3.3) 18 (60) 8 (26.7) |
5 (16.7) 8 (26.7) 15 (50) 2 (6.7) |
< 0.001 |
| - | Correlation (r) between Cat-L and Cys-A | ||||
|---|---|---|---|---|---|
| Percentage of Positive Cells | Score of Positive Cells | Staining Intensity | IRS | ||
| OLP | ALL | 0.232 | 0.262 | - 0.130 | 0.124 |
| EPI | 0.084 | 0.095 | - 0.130 | 0.003 | |
| CNT | 0.322 | 0.145 | - 0.268 | - 0.430 | |
| Control | ALL | 0.410a | 0.237 | 0.334 | 0.292 |
| EPI | 0.658a | 0.563b | 0.352 | 0.439a | |
| CNT | 0.166 | 0.220 | 0.301 | 0.276 | |
aCorrelation is significant at the 0.05, bCorrelation is significant at the 0.01
In this study, the pattern of Cat-L expression was markedly detected in the cytoplasm of basal cells of OLP. The cytoplasmic staining of Cat-L could possibly be explained by the production of Cat-L from the endoplasmic reticulum adjacent to the nucleus, which is then released as lysosomes and dispersed throughout the cytoplasm [14]. This pattern of expression also corresponded to the histopathological characteristics of OLP, including basal cell degeneration. In the normal control specimens, Cat-L was expressed in a similar pattern to that in OLP, but its levels were lower in terms of percentage of positive cells, score of positive cells, and staining intensity. This may represent the function of Cat-L in normal conditions, such as regulating epithelial layer balance, proteolytic activity, and enhancing immune response, in which various cell activities may be more prevalent in the stratum basale [14].
Elevated Cat-L in inflammatory diseases seems to be a consequence of the pathophysiological functions of this protein. Cat-L has been found to play an important role in MHC class II in terms of the proteolytic process of endocytosed antigens and cleavage of invariant chains in MHC class II molecules [14]. The IL-8 precursor was turned into the IL-8 active form by Cat-L modulation [15]. The immunohistochemical analysis revealed significantly higher expression of IL-8 in OLP compared to the normal control [16]. In apoptosis activity, Cat-L is involved in perforin processing through cleavage of the protein at the C-terminus [17]. Cat-L is also involved in the formation of CD4+ lymphocytes and helps CD8+ lymphocytes to function optimally. Moreover, Cat-L has been found to regulate the innate immune response through association with toll-like receptor 9 function [18]. All Cat-L functions stated above are possibly involved in OLP pathogenesis. Thus, the upregulation of Cat-L may indicate a crucial role of Cat-L in the pathogenesis of this disease.
In our current study, the expression pattern of Cys-A in OLP and normal tissues was discovered in the whole epithelial layers; it was more intense in the nucleus and intercellular space, but control specimens expressed significantly less expression. These patterns of Cys-A expression in our study have been found to be consistent with those from the study of Gupta et al., which reported the activities of Cys-A at desmosomes between keratinocytes [19]. Furthermore, under normal conditions, Cys-A protects the epithelium of the skin from not only endogenous protease, but also exogenous protease from microorganisms and parasites [20]. Cys-A is mainly expressed in the differentiating and cornified layers of the epidermis of humans [11]. These pieces of evidence additionally support our study, which detected Cys-A expression in the upper epithelium of OLP and normal tissues.
Cathepsins can be regulated by their inhibitors, including cystatins [21]. According to the current research, both expressions of Cat-L and Cys-A in OLP were higher than in the controls. A positive correlation between Cat-L and Cys-A expression in normal tissues was found in this study, which may explain the function of the protease and its inhibitors in normal mucosa. However, the absence of correlation between the two enzymes in OLP may suggest abnormal functions of the proteins, which could lead to the pathological condition of OLP. Nonetheless, to validate the intracellular action of Cat-L and Cys-A, double immunofluorescence labelling would be an appropriate technique to investigate the distribution of these two proteins in the same sample of cells.
In addition to Cat-L and Cys-A, other cysteine proteases and inhibitors are involved in the pathogenesis of OLP [7, 9, 22, 23]. Previous studies have reported significantly increased expression of cathepsin K [22] and cathepsin B [24] in OLP compared to normal tissues analyzed by using the IHC method. Talungchit et al. reported that cystatin SA may be used as a salivary biomarker in OLP [23]. The activity of a cysteine protease is regulated by a number of inhibitors, including the three cysteine groups, tyropins, serpins, and others [5]. Besides, a report showed redundancy among cysteine cathepsins in murine experimental autoimmune encephalomyelitis [25], implying that many proteases and their inhibitors could be involved in OLP pathogenesis. Thus, a quantitative study should be performed in the future to determine which type of cathepsin plays the most important role in OLP.
There are some limitations to this study. The mean age of the OLP group was significantly different from the control group because the control specimens were derived from 18-30 years old patients who had undergone third molar removal surgery. Thus, the comparison of tissue characteristics or cellular processes with aging factors may be limited. Moreover, most OLP specimens were derived from buccal mucosa, which is a non-keratinized tissue. On the other hand, all specimens from the control group were derived from gingiva, which is a keratinized tissue. Although we mainly investigated the epithelium layer in both types of tissues, the different types of tissue in this study may affect the interpretation of the results. Thus, a future study that controls these factors is required for better clarification of Cat-L and Cys-A functions in OLP.
CONCLUSION
The principal findings of this study are that Cat-L and Cys-A play a role in OLP. The pathophysiology of OLP may be related to changes in the expression of the cysteine protease, Cat-L, and its inhibitor, Cys-A. This has been the first study to investigate the correlation between Cat-L and Cys-A in OLP. However, further study is required to conclusively determine the relationship between these two proteins in OLP.
LIST OF ABBREVIATIONS
| Cat-L | = Cathepsin L |
| Cys-A | = Cystatin A |
| DAB | = 3,3'-diaminobenzidine |
| IHC | = Immunohistochemistry |
| IL-8 | = Interleukin-8 |
| IRS | = Immunoreactive Score |
| MHC | = Major Histocompatibility Complex |
| OLP | = Oral Lichen Planus |
| SCC | = Squamous Cell Carcinoma |
AUTHORS’ CONTRIBUTION
It is hereby acknowledged that all authors have accepted responsibility for the manuscript's content and consented to itssubmission. They have meticulously reviewed all results and unanimously approved the final version of the manuscript.
ETHICS APPROVAL AND CONSENT TO PARTICIPATE
This research was approved by the ethics committee for human research at Srinakharinwirot University with certification number SWUEC-029/2563X.
HUMAN AND ANIMAL RIGHTS
All human research procedures were followed in accordance with the ethical standards of the committee responsible for human experimentation (institutional and national), and with the Helsinki Declaration of 1975, as revised in 2013.
CONSENT FOR PUBLICATION
Tissue specimens were collected during the third molar removal surgery from volunteers who had given their written informed consent.
AVAILABILITY OF DATA AND MATERIALS
The data supporting the findings of the article are available upon reasonable request from the corresponding author [P.T].

