All published articles of this journal are available on ScienceDirect.

Artificial Intelligence for Detecting Periodontitis: Systematic Literature Review
Authors Info & Affiliations
Abstract
Background
The determination of the diagnosis of inflammatory periodontitis is generally based on clinical examination, which is then strengthened by radiographic examination. Still, the inequality of assessment of clinical conditions, along with limitations of radiographic interpretation, makes determining the diagnosis of the periodontal disease difficult. The use of artificial intelligence as a digital system approach is believed to reduce costs, time, the need for medical services, and medical errors that may occur due to human factors.
Objective
This systematic review study is to analyze the use of dental and panoramic radiographs combined with the use of artificial intelligence in establishing the diagnosis of periodontitis based on the parameters of periodontal disease severity according to the 2017 American Academy of Periodontology/European Federation of Periodontology Workshop (pocket depth, clinical attachment loss (CAL) and the pattern and level of alveolar bone damage that occurs).
Methods
Journal searches for articles published in English were carried out through the PubMed and Scopus databases in the 2011-2021 period, using the search terms periodontitis, periodontal disease, food impaction, trauma occlusion, periapical radiograph, panoramic, machine learning, artificial intelligence, and periodontal bone loss, after going through article selection, two suitable articles were obtained.
Results
Two studies fell into the analyzed category. Both list periodontal bone loss as a parameter that marks periodontitis, and the use of panoramic photos in detecting this parameter assisted by Convolutional Neural Networks as artificial intelligence.
Conclusion
The use of panoramic radiographs and Convolutional Neural Networks as artificial intelligence that serves as a tool to detect periodontal bone damage has almost the same results as experienced clinicians In order for this method to be developed in the future to help clinicians establish the diagnosis, more clinical and image data will be required.
1. INTRODUCTION
1.1. Background Systematic Review
The development of science and innovation in recent years has resulted in many significant advances in the determination of diagnosis, treatment, and even the determination of preventive measures against periodontal disease [1]. The diagnosis of periodontal disease, which includes damage to soft and hard tissues, should be systematic and should involve clinical examination and radiographic examination [2-5]. Radiographs play an important role in the diagnosis, research, and treatment of periodontal disease, although there are sometimes limitations when periodontal abnormalities are not indicated in radiographic images [6, 7]. The best approach to the diagnosis of periodontal disease is clinical examination and radiographic examination, to establish the diagnosis of periodontal disease or to obtain other supporting evidence for determining the diagnosis [7, 8]. Several types of conventional radiographic examinations can be used to diagnose periodontal disease and even determine prognosis, including periapical, bitewing, and panoramic [2, 6]. Full-mouth periapical radiographs have been the first choice and also the gold standard for evaluating periodontal disease abnormalities [4, 7, 8]. Panoramic radiographs, which capture the entire mouth, have been widely used for their advantages over intra-oral images, such as better patient comfort and easier procedure. The selection of the use of periapical radiograph techniques for the determination of diagnosis should also pay attention to the radiation dose. The recommended recommendation for the radiation dose of one periapical photo is 0.001 mSv, and the recommended radiation dose for panoramic photos is 0.007 mSv [9, 10]. Selection of panoramic radiographs, if necessary, should be combined with periapical radiographs to reduce the amount of radiation that occurs [11]. However, there are often many things that influence consideration in the selection of appropriate radiographic techniques in determining the diagnosis of periodontal disease, especially among clinicians [12, 13].
The use of artificial intelligence in dentistry can be widely applied, depending on needs, ranging from dental emergencies to prosthetic planning. In the use of artificial intelligence, machines will learn from old experiences or data, adapt new data, and process like humans [14, 15]. As the trend of digital systems approaches in dentistry has increased in the last 10-20 years, clinicians lacking accurate diagnostic skills are driving the need for the use of technology, especially Artificial Intelligence (AI) software. This system is believed to reduce costs, time, the need for medical services, and also medical errors that may occur due to human factors [16]. Artificial intelligence intends to reproduce the cognitive processes of the human being and obtain the same result, in this case, the determination of the diagnosis of a disease with that produced by the clinician, with more accuracy and shorter time [17]. In establishing the diagnosis of periodontal disease, AI can be the link between disease indicators, immunology, and microbiology to obtain a diagnosis of periodontal disease [17].
1.2. Research Objectives
The purpose of this systematic review study is to evaluate the use of conventional periapical, bite-wing, and panoramic radiographs that have been an option in helping to establish the diagnosis of periodontal disease, combined with the use of machine learning as artificial intelligence to determine the diagnosis of periodontal disease based on severity parameters periodontal disease according to the 2017 AAP / EFP Workshop, which are pocket depth, clinical attachment loss (CAL) and the pattern and level of alveolar bone damage that occurs. This study reviewed observational research types, such as cross-sectional, cohort, and randomized controlled clinical trials (RCT study), to see the relationship between determining the diagnosis of periodontitis influenced by periodontal disease severity parameters based on periapical and panoramic conventional radiographic examinations. Study indicators are those who are diagnosed with periodontitis and have conventional radiographic supporting examinations accompanied by supporting data that show the severity of the periodontal disease.
2. MATERIALS AND METHODS
2.1. Research Protocol
This systematic review research protocol follows the rules of PRISMA (Preferred Reporting Items for Systematic Reviews and Meta-Analyses, which provides research protocol points linked to references used in systematic reviews. This research question uses the PICOS method (Population) for Patients with a diagnosis of periodontitis and aggressive periodontitis aggravated by local predisposing factors, food impaction, food retention, and occlusion trauma (Intervention). The use of machine learning and artificial intelligence in Panoramic photographs in the determination of periodontal diagnosis, (Comparison) Periapical and bitewing radiographic photographs, (Outcomes) CAL, pocket depth, and periodontal bone loss, (Study) Cohort, cross-sectional and randomized control trials.
2.2. Eligibility Criteria
2.2.1. Inclusion Criteria
In the systematic literature review, all articles focus on patients diagnosed with periodontitis with the provision of criteria adapted to the research question (PICOS), namely a study participant diagnosed with periodontitis, the presence of panoramic photos or periapical / bite-wing photos that can confirm periodontitis, which is characterized by several indicators contained in conventional radiographic photos, such as periodontal bone loss, and clinical attachment loss, the use of machine learning which also functions as Artificial Intelligence (AI) and the use of conventional radiographic photos (panoramic and periapical/bitewing) which confirm the presence of abnormalities. There are quantitative data related to the determining parameters of the diagnosis of periodontitis contained in panoramic photos or periapical / bite-wing photos and are observational cohort, cross-sectional, and RCT studies.
| - | Inclusion Criteria | Exclusion Criteria |
|---|---|---|
| Source | Pubmed, Scopus | Another database |
| Dates | Dec 18, 2011 – Dec 17 2021 | Studies published before or after this period |
| Language | English | Other |
| Population | Periodontitis Periodontal disease Aggressive periodontitis Local predisposing factors Trauma occlusion Food Impaction Food retention |
Other |
| Intervention/Exposure | Panoramic Machine learning Artificial intelligent |
Other |
| Comparative | Dental radiography Periapical dental radiography Bite-wing |
- |
| Outcome measure | Level of Periodontitis (parameters: PBL, CAL, Pocket depth) | Other |
| Studies | All | |
| Type of Publication | Free full text | Other and paid |
2.2.2. Exclusion Criteria
Literature review research or meta-analysis, without the intervention of the use of artificial intelligence, and there is no tentative data related to periodontal disease severity parameters that can be detected through conventional radiographic photos (Table 1).
2.3. Literature Search
The literature search for this research includes relevant studies over the past 10 years. The database search engines used in this study were Pubmed and Scopus. The same keyword is used for searches in both databases using the Boolean terms “OR” and “AND.” With the following filters: free full text, humans, English, and MEDLINE.
2.4. Selection of Studi
Two independent researchers (D.F., Y.S.) independently analyzed titles, abstracts, and full text to identify articles eligible for systematic review based on inclusion and exclusion criteria. Disagreements between researchers regarding the selection of articles were resolved by agreement.
2.5. Data Collection
Researchers (D.F) analyze and check data related to research methodology and heterogeneity of clinical parameters. Analysis of data from each article as follows: research design studies (cohort, cross-sectional, or randomized clinical trial), characteristics of participant studies, such as diagnosed periodontitis, local predisposing factors that affect periodontitis, the use of artificial intelligence in reading conventional radiographic image data and quantitative data (parameters used (outcome)), such as Clinical Attachment Loss (CAL), alveolar/periodontal bone loss and pocket depth. Use sensitivity and specificity values for each existing quantitative data (outcome).
3. RESULTS
3.1. Determination of Research Design Studies and Research Characteristics
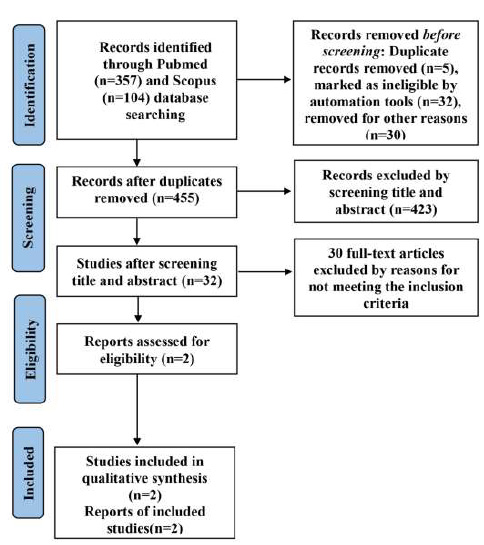
The total number of research studies that fit the inclusion criteria of this system literature review research obtained from the journal article search database (Pubmed and Scopus) is 32 journal articles published between 2011 and 2021 (December 18, 2011, to December 17, 2021). After passing the examination which includes the title, abstract, free full text, and language used, then only 2 journal articles meet the criteria, as shown in the PRISMA chart below [18, 19] (Fig. 1).
The detailed characteristics of the 2 research studies that are eligible for the criteria appear in the following table, accompanied by researchers in each research study, year of publication, time of study, research design, and parameters used as quantitative data.
3.2. Results from Each Research Study
Research conducted by Kim et al. [20] and Krois et al. [21], (Tables 2 and 3) aimed to determine the severity of periodontal disease with periodontal bone damage parameters using panoramic radiographs analyzed by machine learning, then compared with the determination of periodontal bone loss, previously marked by clinicians who are observers, whose reliability will be assessed intra- and inter-rater between observers (Table 4) [20, 21]. To the best of our knowledge, determining periodontal bone damage on dental radiographs is often difficult due to the limitations of different clinicians for damage determination periodontal bone [20-23]. Kim et al. [20] used a Deep Neural Transferred Network (DeNTNet), which is a development of the Convolutional Neural Network (CNN) used in the research conducted by Krois et al. [21]
| No. | Author/Year | Study Period | Country | Method | Sampling Method | Sample Size | Parameter of Periodontal Status |
|---|---|---|---|---|---|---|---|
| 1. | Jaeyoung Kim, Hong-Seok Lee, In-Seok Song, Kyu-Hwan Jung/2019 [20] | January 1, 2014- February 14, 2016 | South Korea | Cross-sectional | N/A | 12,179 panoramic | Periodontal bone loss |
| 2. | Joachim Krois, Thomas Ekert, Leonie Meinhold, Tatiana Golla, Basel Kharbot, Agnes Wittemeier, Christof Dörfer,Falk Schwendicke/2019 [21] | 2018 | Berlin, Germany | Cross-Sectional | N/A | 305 panoramic | Periodontal bone loss |
| No. | Author | Radiographic / Aircraft Engineering | Artificial Intelligence | Sample set | Parameter of Periodontal Status |
|---|---|---|---|---|---|
| 1. | Jaeyoung Kim, Hong-Seok Lee, In-Seok Song, Kyu-Hwan Jung [20] | Panoramic / Orthophos XG 3 (Sirona, Bensheim, Germany, year of construction: 2009) | Deep Neural Transferred Network (DeNTNet) | 12,179 panoramics: 800 image segments; 190 for validation 11.189 training |
Periodontal bone loss |
| 2. | Joachim Krois, Thomas Ekert, Leonie Meinhold, Tatiana Golla, Basel Kharbot, Agnes Wittemeier, Christof Dörfer,Falk Schwendicke [21] | Panoramic (HDXWILL, South Korea), Hyper-XCM (Asahi, Japan), CS 9300 (Carestream Dental, USA), Papaya (Genoray, South Korea), and PHT-30LFO (Vatech, South Korea) | Deep convolutional neural networks (DCNNs) | 305 panoramic: 1750 image segments; 350 for validation; 1400 training |
Periodontal bone loss |
| No. | Author | Inter-rater Observer | Periodontal Bone Loss |
|---|---|---|---|
| 1. | Jaeyoung Kim, Hong-Seok Lee, In-Seok Song, Kyu-Hwan Jung [20] | Kappa: (N/A) Validity; 0.98 (Automatic panoramic determination of PBL) |
Yes/No |
| 2. | Joachim Krois, Thomas Ekert, Leonie Meinhold, Tatiana Golla, Basel Kharbot, Agnes Wittemeier, Christof Dörfer,Falk Schwendicke [21] | Kappa 0.52 (moderate) Validity: PBL 20% = 0.45 PBL 25% = 0.31 PBL 30% = 0.20 (Manual determination of panoramic PBL on cropped images) |
Yes/No (PBL in % of the root length) Percentage distance from CEJ to apex alveolar bone: distance from CEJ to the apex of the tooth root. (on single root tooth) For double root teeth, the measurement is the same as for a single root, only it is done 2 times for the mesial side and the distal side, then what is taken is the largest value between mesial/distal on the teeth. |
For the determination of bone damage (Table 4), Krois et al. [21] used 3 parameters, there are cemento enamel junction (CEJ) in the mesial and distal regions of the tooth, the most apical point of the apex of the tooth, and the most apical point of extension loss of the apex of the alveolar bone, then determined the percentage value of bone damage, which calculates the distance from CEJ to the top of the alveolar bone divided by the distance from CEJ to the dental apex [21], if the tooth is covered by the restoration, the most apical point of the restoration is taken as CEJ [24]. For premolar and molar, which have two or more dental roots, the largest percentage is taken in the distal or mesial region. The use of periodontal bone loss percentages instead of precise calculations, such as millimeters, helps reduce radiographic film distortion caused by the position of the patient and magnification of the panoramic plane [21]. While Kim et al determine bone damage, based on the presence or absence of alveolar bone damage [20]. Both studies used clinicians with sufficient practical experience as dentists, periodontists, and radiologists [20, 21].
Table 4 shows the agreement among the clinicians. There were six dentists in the study conducted by Krois et al. [21]; two of them specialized in operative dentistry and periodontology, and four of them were general dentists [21]. The score of Kappa (0,52 as a moderate’s score) determined the intra-rater reliability of this study [25, 26]. In the study conducted by Kim et al. [20], the determination of bone damage began with a pre-trained model, namely the determination of ROI (region of interest) in panoramic, then the determination of ROI in the trained model to predict periodontal bone loss (PBL) on each tooth. Then, the premolars and molars are made a separate assessment on the existing trained model, and this is due to the morphology of the two types of teeth, which sometimes cannot be seen in panoramic photos, which could need the training data set twice, compared to anterior teeth (incisive and canine) which have one root, this is because, in research conducted by Kim et al., ROI segmented for premolar and molar are performed vertical split [20]. The image data will be adjusted up to 512x512 pixels. While in research conducted by Krois et al [21], image data will be processed digitally, previously it will be converted to gray-scale, and then teeth on the upper jaw will be flipped in the next process. Then, the image data is adjusted to 64x64 pixels to facilitate data reading. Randomly, the data set will be divided into two data sets: a training data set and a validation data set [21]. The results of research conducted by Kim et al. and Krois et al. with diagnostic tests produced sensitivity values with a range of 0.70 to 0.90 and specificity of 0.46 up to 0.96 (Table 5) [20, 21].
| No. | Author | Diagnostic Test Results | Periodontal Bone Loss |
|---|---|---|---|
| 1. | Jaeyoung Kim, Hong-Seok Lee, In-Seok Song, Kyu-Hwan Jung [20] | Clinician (1-5) Sensitivity/Specificity = 0.78/0.92 PPV/NPV = 0.62/0.96 Baseline Sensitivity/Specificity = 0.66/0.94 PPV/NPV = 0.65/0.94 |
Yes/No |
| 2. | Joachim Krois, Thomas Ekert, Leonie Meinhold, Tatiana Golla, Basel Kharbot, Agnes Wittemeier, Christof Dörfer,Falk Schwendicke [21] | PBL 20% Sensitivity/Specificity = 0.92/0.63 PPV/NPV = 0.68/0.90 PBL 25% Sensitivity/Specificity = 0.95/0.53 PPV/NPV = 0.48/0.96 PBL 30% Sensitivity/Specificity = 0.96/0.46 PPV/NPV = 0.31/0.98 |
Yes/No Percentage distance from CEJ to apex alveolar bone: distance from CEJ to the apex of the tooth root. (on single root tooth) For double root teeth, the measurement is the same as for a single root, only it is done 2 times for the mesial side and the distal side, then what is taken is the largest value between mesial/distal on the teeth. |
| No. | Author | Diagnostic Test Results | Periodontal Bone Loss |
|---|---|---|---|
| 1. | Jaeyoung Kim, Hong-Seok Lee, In-Seok Song, Kyu-Hwan Jung [20] | Clinician (1-5) Before ROI Segmentation: Average periodontal bone damage in all teeth: 0.66 After ROI Segmentation: Average periodontal bone damage in all teeth:0.68 After ROI Segmentation+ pre-trained weight: Average periodontal bone damage in all teeth:0.70 After ROI Segmentation+ pre-trained weight + auxiliary loss: Average periodontal bone damage in all teeth:0.72 After ROI Segmentation+ pre-trained weight + auxiliary loss + ensembled network: Average periodontal bone damage in all teeth:0.75 |
Yes/No |
| 2. | Joachim Krois, Thomas Ekert, Leonie Meinhold, Tatiana Golla, Basel Kharbot, Agnes Wittemeier, Christof Dörfer,Falk Schwendicke [21] | Incisive 20% Sensitivity/Specificity = 0.89/0.58 PPV/NPV = 0.68/0.84 Caninus 20% Sensitivity/Specificity = 0.91/0.67 PPV/NPV = 0.54/0.95 Premolar 20% Sensitivity/Specificity = 0.91/0.65 PPV/NPV = 0.62/0.92 Molar 20% Sensitivity/Specificity = 0.95/0.2 PPV/NPV = 0.79/0.92 |
Yes/No Percentage distance from CEJ to apex alveolar bone: distance from CEJ to the apex of the tooth root. (on single root teeth) For double root teeth, measurements are the same as single roots, only they are done 2 times for the mesial side and the distal side, then what is taken is the largest value between the mesial/distal on the tooth. |
The assessment of diagnostic test results based on bone damage in each segment of the dentition can be seen in Table 6 below.
Accuracy in the anterior region (incisive and canine) is lower than in the posterior region (premolars and molars). Radiographic interpretation of the anterior region is often influenced by the speed and inclination of the rotation of the panoramic plane, affecting the radiographic image of the anterior region and giving the picture that the anterior region is narrower than the posterior region [27].
4. DISCUSSION
Periodontal inflammation caused by bacterial infection can affect the condition of the gingiva and the underlying periodontal structure. It can result in periodontal bone damage, which, if not properly diagnosed, can result in tooth loss, leading to a detrimental effect on quality of life also general health [28, 29]. The use of dental and panoramic radiographs plays an important role in the early detection of periodontal bone loss. Panoramic radiographs provide better comfort, easier and faster, for patients and clinicians in treatment procedures than dental radiographs [9, 30]. For screening patients, panoramic radiographs provide less radiation than dental radiographs, as well as provide a wider field of view and get to know the patterns of damaged bones, periapical lesions, and pathological lesions in the oral cavity [16]. The use of CNNs as an artificial intelligence application in both studies is due to the ability of the CNN to extract image data automatically. It can be excellent for analyzing large clinically relevant data sets [31-33]. Image classification is the most important and basic thing in machine learning [34-36]. A different data set will have an impact on the result, and a large data number of data sets will affect the accuracy of classification, and to obtain a large data set is not something easy [37]. Algorithm CNN has important step as follow: feature extraction, classification, identification, and prediction or making a decision [38]. Processing of segmentation of panoramic radiographs is difficult cause there is no homogeneity between panoramic radiographs with one another, determined by noise level, vertebral column images, and low contrast [39, 40]. Previously, the image had to be extracted manually for further processing [41], and using multiple layers simultaneously with the appropriate algorithm allows for more complex filters. The existence of complex filters cannot only detect more complex shapes in the image but it can improve the appearance of the model when compared with the conventional methods. In fact, in the use of CNNs, errors in the weighting of output values can be eliminated so that complex filters are expected to produce outputs according to the following desired [41, 42]. Convolutional Neural Network is formed from several layers: (1) the convolutional layer, which is based on convolutional operation, aims to extract information from data and transform it into several forms of data; (2) the pooling layer, which aims to reduce the dimension of data in the next layer, (3) Dense layer, which is the last layer that connects neurons in first layer and next layer to produce output, which can be a classification [42]. The important thing to know in terms of choosing this deep learning technique is that this method requires a lot of image data with good quality [42]. The accuracy of CNNs is improved when image data and clinical data are analyzed simultaneously. Also, the morphological assessment of periodontal bone loss (horizontal or vertical bone loss) and root morphology can predict periodontal abnormalities more accurately using algorithms [43]. The use of panoramic radiographs that provide a broad picture of the upper jaw and lower jaw has the disadvantage of low resolution in each tooth [9, 30].
CONCLUSION STRENGTHS AND LIMITATIONS OF EACH STUDY
The strength of this review is the systematic approach and teamwork (dentist, periodontist, restorative dentist) and almost all reviewed articles and examinations related to disease severity parameters periodontal is performed by dentists, periodontists, and oral surgeons and there is sufficient quantitative data so that it is possible to proceed to meta-analysis research. The limitations of this review are the need to use more data to produce more adequate results, as well as weak reliability among observers.
LIST OF ABBREVIATIONS
| CAL | = Clinical Attachment Loss |
| PRISMA | = Preferred Reporting Items for Systematic Reviews and Meta-Analyses |
| PBL | = Periodontal Bone Loss |
AVAIALABILITY OF DATA AND MATERIALS
All the data and supportive information are provided within the article.
SUPPLEMENTARY MATERIAL
PRISMA checklist is available as supplementary material on the publisher’s website along with the published article.
Supplementary material is available on the publisher’s website along with the published article.

