All published articles of this journal are available on ScienceDirect.

Variability in Tooth Color Selection by Different Spectrophotometers: A Systematic Review
Authors Info & Affiliations
Abstract
Objective:
The objective of this study is to evaluate the variability in the precision and reliability of tooth color selection among different spectrophotometers.
Methods:
A search was performed in the following databases: MEDLINE (PubMed), Google Scholar, Scopus, and Web of Science. A manual search was also performed based on the reference lists of the relevant articles. Screening, data extraction, and quality assessment were performed independently and in duplicate.
In the search strategy, medical subject heading (MeSH) words were used in PubMed, and free terms were used for the titles and abstracts of each article. Each keyword was separated by the Boolean operator OR to later be combined with the Boolean operator AND. All three authors were independently involved in study selection based on the inclusion criteria, data extraction, and bias assessment. The assessment of the risk of bias in the In vivo studies was based on the parameters assigned by the Newcastle–Ottawa tool, and the risk of bias in the in vitro studies was categorized by applying the modified ARRIVE and CONSORT criteria. There was great heterogeneity in the experimental design of the articles that were included: however, no article mentioned or adhered to the indications given by the ISO_TR_28642_2016 standard for color measurement. Six studies were included, two studies provided data on the precision and repeatability of the spectrophotometers, three provided data on repeatability, and one provided data on reliability.
Results:
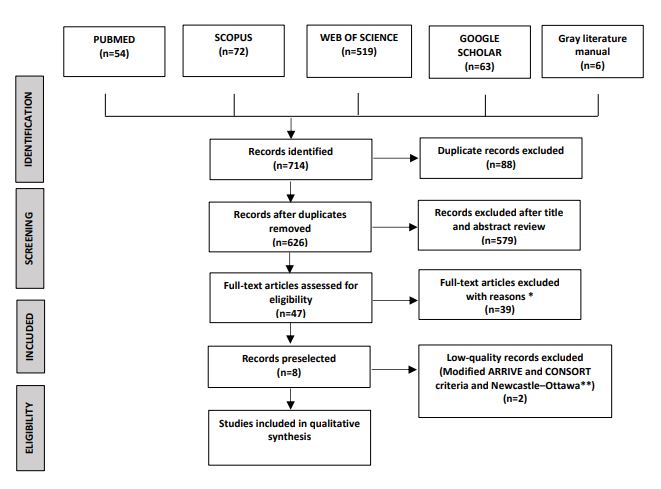
The selection process using the PRISMA flow chart. The search yielded 714 studies. Of these, 88 duplicates were excluded. A total of 579 studies were excluded because their titles and abstracts did not meet the eligibility criteria. The full texts of the other 47 studies were examined, which led to the exclusion of 39 articles that did not meet the inclusion criteria. Two of the remaining eight articles were excluded after applying the modified ARRIVE and CONSORT criteria and the Newcastle–Ottawa criteria. Of the six studies included in the systematic review, two examined the precision and repeatability of the spectrophotometers, three examined repeatability, and one examined reliability.
Conclusion:
The SpectroShade Micro and VITA Easyshade show better variability in terms of precision, but they have no significant advantages in reliability.
The protocol was registered with PROSPERO (the international prospective register of systematic reviews) under number CRD42021268853.
1. INTRODUCTION
In restorative, biomimetic, and especially aesthetic dentistry, one of the most important challenges is dental color matching [1-8]. The color of the final restoration must match the color of the tooth, whether the material used is composite or ceramic [9-15]. The main methods for assessing tooth color are the conventional visual method and instrumental methods [2, 10, 16-19].
The conventional visual method is best known to dentists; in this method, the color of the tooth is compared with the color guides of different commercial companies [15, 20-25]. In the instrumental method, color measurement devices, such as digital cameras, spectrophotometers, and digital scanners, are used [8, 10, 26-28]. Fatigue, age, color blindness, emotions, observer experience, ambient light, surface texture, translucency, and environmental colors are factors that affect human perception. Therefore, digital devices have been introduced to reduce or overcome these limitations [13-18, 25, 28, 29].
The most commonly used instrument for evaluating tooth color is the spectrophotometer, which measures the full spectrum of reflected or transmitted light, which is then converted into tristimulus data or CIELAB color space values [9-11, 15]. The International Commission on Illumination (CIE, for its name in French) converts the tristimulus data into L*, a*, and b* coordinates. L* represents lightness on a scale from 0 to 100 (black–white); a* and b* represent the values of hue and chroma: a* (+) red/a* (-) green, b* (+) yellow and b* (-) blue [11-15, 28-32]. The color difference between two objects is represented as ΔE, which is used in dentistry to establish thresholds of perceptibility and clinical acceptability [6, 10, 12, 23, 29, 31].
An important consideration is the ability of these instruments to reliably and accurately measure the color of teeth [11, 15, 19, 32-34]. These terms have not been explained concretely and clearly that could make research studies easily reproducible [13-15, 34-37]. Reliability can be defined as the degree to which repeated measurements of the same quantity, with the same measuring instrument, give the same readings [5, 8, 10, 27-29, 38]. Precision refers to how close the measurements are to each other [14-17, 21-29]. Few standardized studies have evaluated the precision and reliability of spectrophotometers for measuring tooth color, and there is no agreement among the results of individual studies. Additionally, no synthesis or general evaluation has been performed, which hinders the integration of knowledge on the subject, generating a gap between research and decision-making [8-11, 28, 29, 34, 39-41].
For this reason, the objective of this systematic review was to evaluate the variability in the precision and reliability of tooth color matching among different spectrophotometers.
2. MATERIALS AND METHODS
2.1. Protocol and Registration
The protocol was registered with PROSPERO (the international prospective register of systematic reviews) under number CRD42021268853. Ethics approval was not required for this research. This systematic review was performed according to the Preferred Reporting Items for Systematic Reviews and Meta-Analyses (PRISMA) guidelines.
2.2. Search Strategy
The bibliographic search was carried out by two authors (ACL and PCA) in four digital databases, MEDLINE/PubMed, Scopus, Web of Science, and Google Scholar. Full-text articles with titles compatible with the research aims were searched without limiting the year of publication or language. In vitro, descriptive, and In vivo studies were included. In the search strategy, medical subject heading (MeSH) words were used in PubMed, and free terms were used for the titles and abstracts of each article. Each keyword was separated by the Boolean operator OR to later be combined with the Boolean operator AND. Two authors (ACL and PCA) performed the search separately, and in the case of disagreement over an article, discussion with a third researcher (DAR) was requested until a consensus was reached. The keywords used according to the PICO (population, intervention, comparison, outcomes) questions are listed in Table 1.
| PUBMED | - |
| P | (“dental color”[MeSH Terms] OR “dental color” OR “tooth color”[MeSH Terms] OR “tooth color” OR “shade guide”[Title/Abstract] OR “shade matching”[Title/Abstract]) |
| I | (“tooth spectrophotometer”[Title/Abstract] OR “easyshade”[Title/Abstract] OR “degudent”[Title/Abstract] OR “cristaleye”[Title/Abstract] OR “spectroshade”[Title/Abstract] OR “shade pilot”[Title/Abstract]) |
| C | #1 AND #2 AND #3 |
| O | (“delta E”[Title/Abstract] OR “ΔE”[Title/Abstract] OR “cielab”[Title/Abstract] OR “ciede2000”[Title/Abstract]) |
| SCOPUS | - |
| P | TITLE-ABS-KEY(“dental color” OR “tooth color” OR “shade guide” OR “shade matching”) |
| I | (“tooth spectrophotometer” OR “easyshade” OR “degudent” OR “cristaleye” OR “spectroshade” OR “shade pilot”) |
| C | #1 AND #2 AND #3 |
| O | (“delta E” OR “ΔE” OR “cielab” OR “ciede2000”) |
| WOS | - |
| P | TI=(“dental color” OR “tooth color” OR “shade guide” OR “shade matching”) |
| I | (“tooth spectrophotometer” OR “easyshade” OR “degudent” OR “cristaleye” OR “spectroshade” OR “shade pilot”) |
| C | #1 AND #2 AND #3 |
| O | (“delta E” OR “ΔE” OR “cielab” OR “ciede2000”) |
| - | |
| P | in tittle: (“dental color” OR “tooth color” OR “shade guide” OR “shade matching”) |
| I | (“tooth spectrophotometer” OR “easyshade” OR “degudent” OR “cristaleye” OR “spectroshade” OR “shade pilot”) |
| C | #1 AND #2 AND #3 |
| O | (“delta E” OR “ΔE” OR “cielab” OR “ciede2000”) |
2.3. Eligibility Criteria
Articles that mentioned the difference in color coordinates ΔE, evaluated precision (repeatability or reproducibility) and reliability between different spectrophotometers and measured the color of live teeth, extracted teeth, and used color guides were included in the review.
*: 30 only used a spectrophotometer, 9 did not compare spectrophotometers
**: Did not describe the sample size calculation, did not have the same observer, or did not specify the calibration of the operator and the instrument. For more information, visit www.prisma-statement.org
The following articles were excluded: articles that did not compare more than one spectrophotometer; articles that involved the shade of unhealthy dental organs, tooth whitening, materials milled in CAD-CAM, dental organs with endodontics, or stained teeth (e.g., by tetracycline, enamel hypoplasia, or fluorosis, among others); and articles that used color guides that were not intended for dental use.
2.4. Criteria and Selection
Studies were screened in two phases. In phase 1, the studies found in the searches (excluding duplicates) were independently reviewed by two researchers (ACL and PCA) by reading the titles and abstracts to determine whether the studies met the inclusion criteria. In phase 2, the full text of each article selected for its title and abstract was read, and the modified ARRIVE and CONSORT criteria were applied [29] (Fig. 1). The risk of bias was assessed to evaluate the methodological quality of the article in terms of its correct execution as well as the structure of the title, abstract, introduction, methods, results, discussion, and conclusions [30]. A manual search of all the selected articles was performed with respect to the inclusion criteria. Any disagreement about the inclusion of an article was resolved by discussion with the third author (DAR).
2.5. Selection, Management, and Data Collection
The data were extracted independently by two authors (ACL and PCA). The full-text articles selected for inclusion were managed using a standardized form in digital format (Office Excel 2016 software, Microsoft Corporation, Redmond, WA, USA). The authors compiled information on the authors, year of publication, study design, sample size, spectrophotometer used, results, conclusions, and risk of bias.
2.6. Assessment of Risk of Bias and Methodological Quality
The assessment of the risk of bias in the In vivo studies was based on the parameters assigned by the Newcastle–Ottawa tool, as follows: (a) selection (representativeness, selection, ascertainment, and demonstration); (b) comparability; and (c) outcome (assessment, follow-up, and adequacy of follow-up) [36].
If the article was assigned 3 to 4 stars in the selection category, 1 or 2 stars in the comparability category, and 2 or 3 stars in the outcome/exposure category, it was classified as good quality. If the article was assigned 2 stars in the selection category, 1 or 2 stars in the comparability category, and 2 or 3 stars in the outcome/exposure category, it was classified as fair quality. The article was classified as poor quality if it scored 0 or 1 star in the selection category, 0 stars in the comparability category, or 0 or 1 star in the outcome/exposure category.
The risk of bias in the in vitro studies was categorized as described in a previous study [29] according to the following five parameters: (a) standardization of sampling procedures; (b) single operator; (c) description of the sample size calculation; (d) calibration of the instrument used according to the standards and specifications; and (e) observer calibration. If the article clearly reported on a parameter, it received a score of 0 for that parameter. If a specific parameter was reported but reported unclearly, the score was 1. If it was not possible to find this information, the score was 2.
Articles with a score of 0 to 3, 4 to 7, and 8 to 10 were classified as having a low, moderate, and high risk of bias, respectively. The risk of bias in the in vitro and In vivo studies included in the review was evaluated independently, in duplicate, by two authors (ACL and PCA), and any disagreement in the evaluation was resolved by consensus.
2.7. Analysis and Synthesis of Data
There was great heterogeneity in the experimental design of the articles that were included, including in the sample size, digital instruments used, color guides, and dentition at the time of color acquisition. No articles mentioned or adhered to the indications given by the ISO_TR_28642_2016 standard for color measurement [32].
3. RESULTS
3.1. Search and Selection
The selection process using the PRISMA flow chart is shown in Fig. (1). The search yielded 714 studies. Of these, 88 duplicates were excluded. A total of 579 studies were excluded because their titles and abstracts did not meet the eligibility criteria. The full texts of the other 47 studies were examined, which led to the exclusion of 39 articles that did not meet the inclusion criteria. Two of the remaining eight articles were excluded after applying the modified ARRIVE and CONSORT criteria and the Newcastle–Ottawa criteria. Of the six studies included in the systematic review, two examined the precision and repeatability of the spectrophotometers, three examined repeatability, and one examined reliability (Table 2).
| S.No | Author | Year | Type of Study | Sample | Color Guide | Spectrophotometer | Results | Conclusions | |||
| Mean | SD | ||||||||||
| 1 | Tsiliagkou et al. [28] | 2016 | In vitro | 10 shade tabs | VITA Classic | VITA Easyshade | 4.155e* | 3.77e* | (ES) Repeatability low under standardized and free-hand conditions | ||
| SpectroShade Micro | 1.662e* | 1.88e* | (ES) Precision good–fair under standardized condition and low under free-hand condition | ||||||||
| ShadeVision | 2.032e* | 3.19e* | (SS) Repeatability good under standardized and free-hand conditions | ||||||||
| VITA 3D Master | VITA Easyshade | 6.496ma* | 5.07ma* | (SS) Precision high under free-hand and standardized conditions | |||||||
| SpectroShade Micro | 1.682ma* | 1.49ma* | (SV) Repeatability low under standardized condition | ||||||||
| ShadeVision | 2.517ma* | 2.07ma* | (SV) Precision moderate under standardized condition | ||||||||
| 2 | Khurana et al . [11] | 2007 | In vivo | 120 teeth | VITA classic | VITA Easyshade | Kappa 0.50 | SS had better repeatability than ES and SV | |||
| SpectroShade Micro | Kappa 0.80 | ||||||||||
| ShadeVision | Kappa 0.597 | ||||||||||
| 3 | Dozic et al. [25] | 2007 | In vivo | 25 natural teeth | VITA Lumin | ShadeScan | 0.5p* - 0.5f* | ES was the most reliable instrument both in vitro and In vivo | |||
| Ikam | 0.6p* - 0.5f* | ||||||||||
| ShadeEye | 1.7p* - 1.9f* | ||||||||||
| VITA Easyshade | 0.0p* - 0.0f* | No significant difference in operator precision or accuracy | |||||||||
| IdentaColor II | 1.0p* - 2.2f* | ||||||||||
| In vitro | 5 shade tabs | ShadeScan | 1.5p* - 1.8f* | Most devices were more reliable in vitro than In vivo | |||||||
| Ikam | 0.4p* - 2.9f* | ||||||||||
| ShadeEye | 0.7p* - 2.4f* | SE and IC were less reliable than ES and IK | |||||||||
| VITA Easyshade | 0.4p* - 2.5f* | ||||||||||
| IdentaColor II | 0.7p* - 3.4f* | ||||||||||
| 4 | Llena et al. [33] | 2011 | In vivo | 60 natural teeth | VITA classic | VITA Easyshade | 2.28 | 2.25 | ES and SS showed excellent repeatability and can be used in the office to evaluate tooth color or color changes after treatment | ||
| VITA 3D Master | SpectroShade Micro | 1.69 | 4.32 | ||||||||
| p = 0.184 | |||||||||||
| 5 | Panagiotis et al. [19] | 2007 | In vitro | 31 extracted teeth | VITA classic | VITA Easyshade | 0.714-0.756 p = 0.731 |
ES: greater repeatability in L* value | |||
| 0.894-0.813 p = 0.255 |
No difference in reliability between spectrophotometers | ||||||||||
| VITA 3D Master | ShadeEye | ||||||||||
| Color difference 0.866-0.640 p = 0.036 |
No difference in repeatability with color guide | ||||||||||
| 6 | Kim-Pusateri et al. [34] | 2004 | In vitro | 62 shade tabs | VITA classic | SpectroShade Micro | 15.59p* - 0.69f* | Highest reliability with SV, followed by SS and ES and finally SSc | |||
| ShadeVision | 1.44p* - 0.40f* | ||||||||||
| VITA 3D Master | ShadeScan | 1.89p* - 1.33f* | Greatest precision with ES, followed by SV, SS, and SSc | ||||||||
| VITA Easyshade | 1.05p* - 0.75f* | ||||||||||
| Difference z = 0.15f* |
15.59p* - 0.69f* | ||||||||||
| Difference z = 6.53p* |
|||||||||||
3.2. Assessment of Risk of Bias and Methodological Quality
The three In vivo studies included in the systematic review presented a fair risk of bias. The three in vitro studies included had a low risk of bias. No article had a high risk of bias (Fig. 2a and b and Table 3a and b). The risks of bias most frequently found in the studies originated from the calculation of the sample size and the calibration of the instrument according to the manufacturer's specifications.
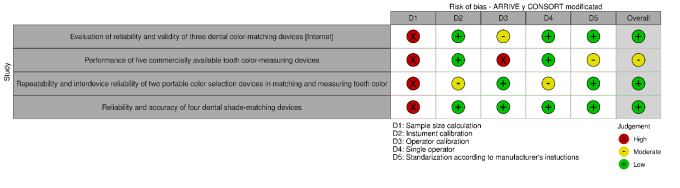
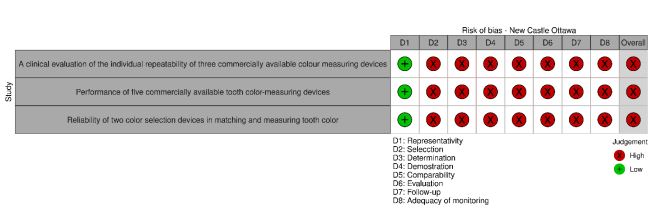
Table 3a.
| S.No. | Title | Author | Year | Type of study | Newcastle–Ottawa | Quality | |||||||
| Selection | - | Outcome | |||||||||||
| Representativeness | Selection | Ascertainment | Demonstration | Comparability | Assessment | Follow-up | Adequacy of follow-up | ||||||
| 1 | A clinical evaluation of the individual repeatability of three commercially available color-measuring devices | Khurana et al. [11] | 2007 | In vivo | * | - | - | - | - | - | - | - | Poor |
| 2 | Performance of five commercially available tooth color-measuring devices | Dozić et al. [25] | 2007 | In vitro/In vivo | * | - | - | - | - | - | - | - | Poor |
| 3 | Reliability of two color selection devices in matching and measuring tooth color | Llena C. et al. [33] | 2011 | In vivo | * | * | - | * | - | - | - | - | Moderate |
| S.No. | Title | Author | Year | Type of Study | Modified CONSORT | Quality | ||||
| Sample Size Calculation | Instrument Calibration | Operator Calibration | Same Observer | Standardization According to the Manufacturer's Instructions | ||||||
| 1 | Evaluation of reliability and validity of three dental color-matching devices [Internet] | Tsiliagkou et al. [28] | 2016 | In vitro | 2 | 0 | 1 | 0 | 0 | Low risk |
| 3 | Performance of five commercially available tooth color-measuring devices | Dozić et al. [18] | 2007 | In vitro/In vivo | 2 | 0 | 2 | 0 | 1 | Moderate risk |
| 5 | Repeatability and interdevice reliability of two portable color selection devices in matching and measuring tooth color | Panagiotis et al. [19] | 2007 | In vitro | 2 | 1 | 0 | 0 | 0 | Low risk |
| 6 | Reliability and accuracy of four dental shade-matching devices | Kim-Pusateri et al. [34] | 2004 | In vitro | 2 | 0 | 0 | 0 | 0 | Low risk |
4. DISCUSSION
Color differences that can be detected by the human eye are limited to some extent. The threshold of acceptability and the clinical perceptibility of color differences have been controversial topics in the literature [8, 14-19, 34, 41-45]. Ruyter et al. [38] established the threshold of clinical acceptability at 3.3, which means that color differences with ΔE ≤ 3.3 are clinically acceptable, while differences with ΔE > 3.4 will be rejected.
To overcome the limitations of human visual color matching, digital color measurement devices were created and considered to represent an important technological advance in dentistry [19, 21-40, 46-51]. It is crucial that these devices have high precision and reliability. Different studies on the precision and reliability of dental color-matching devices have presented contradictory results with the same devices [21, 34, 37-41, 52, 53]. The lack of a gold standard for measuring and comparing color differences is the main drawback to investigating the precision and reliability of these devices [15, 22, 54-57].
The results obtained from this systematic review, whose objective was to evaluate the variability in the precision and reliability among different spectrophotometers, show that the VITA Easyshade and the SpectroShade Micro have excellent repeatability and reliability [11, 25]. Two of the six articles included showed no significant difference in reliability or repeatability of the VITA Easyshade [41, 58, 59]. Llena et al. [33] measured the color of 60 natural anterior teeth and obtained an average of 2.28 for the VITA Easyshade; Lagouvardos et al. [19] performed an in vitro study in which the color of 31 extracted anterior teeth was measured with the VITA Easyshade obtained an average of 0.714.
This result may be attributed to the fact that the investigators had a lot of experience with the device, and small variations in instrument repositioning may also have contributed to discrepancies in instrument consistency.
In an in vitro study, Kim-Pusateri et al. [34] found the best reliability for the ShadeVision, with a standard deviation of 0.40, followed by the SpectroShade Micro, with a standard deviation of 0.69, and the VITA Easyshade, with a standard deviation of 0.75. The VITA Easyshade had the greatest shade-matching accuracy, with a standard deviation of 1.05. However, in an In vivo and in vitro study, Dozić et al. [25] found greater reliability when using the VITA Easyshade, with a value of 0.0.
The result obtained is because as in vitro studies the devices will obtain better reliability because they are too sensitive to the movement of the patient or the equipment. In relation to In vivo studies, factors such as pressure, angle, probe position, differences in internal design and viewing geometry that affect the way the instruments pick up and measure reflectance on the tooth surface and the anatomical shape of the tooth surface, its polychromatic nature and its different translucency and surface texture can play a role in color determination. It should be emphasized that Vita Easyshade demonstrated greater accuracy in the studies analyzed because, as recommended by the manufacturer, shade measurements should be repeated until 2 identical and consecutive measurements of the same tooth are achieved. Following this protocol allowed Easyshade more opportunities to correctly determine color, which can achieve greater accuracy.
In an In vivo study, Khurana et al. [11] analyzed the repeatability of spectrophotometers in measuring tooth color and found high values for the SpectroShade (kappa = 0.80), indicating a substantial degree of agreement. In an in vitro study, Tsiliagkou et al. [28] determined the precision and repeatability of three spectrophotometers under two conditions: free-hand and standardized. They found better results for the SpectroShade, with an average of 1.682 and 1.662, respectively. The VITA Easyshade presented low repeatability under both the standardized and free-hand conditions, at 4.155 and 6.496, respectively, and between good and fair precision under both conditions [21, 39, 60].
In general terms, spectrophotometers can be classified as: point measurement device or whole tooth measurement device. The Spectroshade being a whole tooth measuring device, has better repeatability because they present a color topographic map of the entire tooth in a single image and it has been suggested that this provides more consistent and reproducible information about the tooth structure; in contrast, the Vita Easyshade is an example of a spot measuring device, which measures a small area on the tooth determined by the diameter of the aperture of the optical device. Consequently, several reference measurements may be necessary.
This study is not free of limitations. Some of these limitations are mentioned below. First, there are no validated criteria for evaluating the methodological quality and risk of bias of in vitro studies; we chose to apply the modified ARRIVE and CONSORT criteria [29]. Second, the studies did not follow a standardized protocol in the experimental phase according to ISO_TR_28642_2016; instead, they were governed by the specifications of the manufacturer of each spectrophotometer [32]. Third, there is the possibility of variations in the shade tabs of color guides from the same manufacturer. Fourth, the samples were small, and most studies were performed In vitro, which widens the margin of error in the clinical setting.
CONCLUSION
Based on the results of this systematic review, the following conclusions were drawn:
The SpectroShade Micro and VITA Easyshade show better variability in terms of precision, but they have no significant advantages in reliability.
Reliability and precision data are useful for comparing these devices in vitro and can predict their performance in a clinical setting.
To improve the quality of future research, it is suggested to perform In vivo experimental tests using larger samples and standardized protocols.
LIST OF ABBREVIATIONS
| CIE | = The International Commission on Illumination |
| PRISMA | = Preferred Reporting Items for Systematic Reviews and Meta-Analyses |
CONSENT FOR PUBLICATION
Not applicable.
AVAILABILITY OF DATA AND MATERIALS
The authors confirm that the data supporting the findings of this study are available within the manuscript.
FUNDING
This work was self-financed.
STANDARDS OF REPORTING
PRISMA guideline has been followed.
CONFLICT OF INTEREST
The authors declare that they have no known competing financial interests or personal relationships that could have appeared to influence the work reported in this paper.
ACKNOWLEDGEMENTS
Declared none.
SUPPLEMENTARY MATERIAL
PRISMA checklist is available as supplementary material on the publisher’s website along with the published article.

