All published articles of this journal are available on ScienceDirect.

Accuracy, Precision, and Efficiency of Three-Dimensional (3D) Dental Lab Scanners: A Comparative Study of Two Systems
Authors Info & Affiliations
Abstract
Purpose:
To compare the accuracy, repeatability, reproducibility, and time efficiency between two digital lab scanners (inEos X5 Sirona and KaVo SMD ARCTICA CAD/CAM Scanners) by the traditional method using a digital caliper.
Methods:
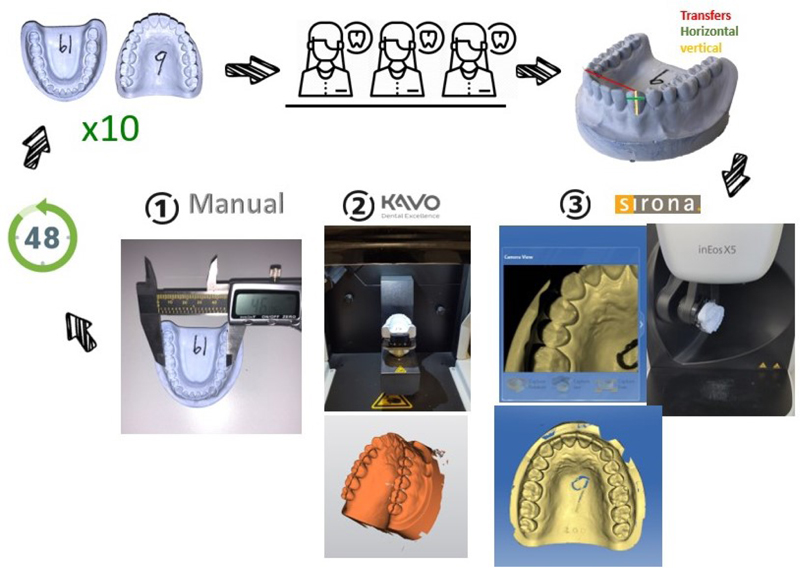
Pair of dental casts (upper and lower) were duplicated using an elastic putty mold to make ten copies of each. Following that, a total of twenty models were scanned in each scanner (Sirona and KaVo) separately by three different calibrated operators. Each operator repeated the scan at an interval of 48 hours. Fifteen measurements for each model were obtained in three different planes (vertical, horizontal, and transfers) following the same protocol. Measurements were obtained manually using a Boley gauge and digitally by the scanner company software. The two scanners that were assessed were; Sirona and KaVo indirect lab Scanners.
Results:
The coefficient of variations was between 1%- 8%, although statistically significant in some groups, but clinically the differences were insignificant and within the accepted range. Correlations between the inter and Intra operator reliability were assessed using the Intraclass Correlation Coefficient in Tables 5-6. The reliability of the increased distance of the measurement seems more consistent. The variations of Correlations among operators increased as the distance measured decreased, even though all operators were calibrated respectively. Operators’ feedback was that KaVo was easier to learn. However, timewise Sirona seemed more efficient. The average time for the Sirona scanner was less than half a minute with average scanner time (4.3 and 3.8 minutes). Based on various parameters recorded, both scanners proved to be accurate with no clinically significant differences detected between the groups.
Conclusion:
Both scanners proved to be accurate with no clinically significant differences detected between the groups. These two scanners were reliable tools to scan and reproduce digital dental records. The inEos X5 Sirona Scanner seemed to be more efficient time-wise than the KaVo SMD ARCTICA CAD/CAM Scanners.
1. INTRODUCTION
Obtaining accurate dental records is a critical step for the dentist to proceed with the right prognosis. Traditionally, this has been accomplished by taking imprints and casting them in plaster. Three-dimensional (3D) dental lab scanners have recently been used in dentistry to obtain three-dimensional (3D) virtual images of the tooth and oral cavity. It was found that digital models in dentistry will be the future trend [1]. It was reported that there were no significant differences in determining the tooth dimensions of traditional models and their corresponding digital models [1]. This transition from the traditional (manual) method to the digital method helps the dentist to store the patient's digital records on specific software and easily analyze the measurements of focused areas. In orthodontics, for example, the dentist needs to perform space analysis, which is used to visualize and measure the patient's occlusion and dentition in all aspects, to diagnose and decide the proper treatment plan. In a study done in 2005, they pointed out that digital models have been successfully used in orthodontic records [2]. In the 1980s the first digital scanner was introduced by a Swiss dentist, Dr. Werner Mermman, and an Italian electrical engineer, Marco Bandstand [3]. Over the years, many companies have improved and produced 3D dental lab scanners that are more efficient, convenient, and useful for capturing virtual 3D images of the tooth. Scanners in dentistry are divided into two main categories: direct and indirect scanners. The direct scanner captures the tooth intraorally. They differ in terms of their working principle such as light source and imaging technique. The indirect scanner, on the other hand, is used in the laboratory to capture dental models and impressions. Sirona and Kavo are two companies in this industry, and their systems feature high-quality scanning standards and optical measuring systems. These scanners work by projecting a laser source to scan the entire parts of the object, and then the images are processed by the scanning software that creates a 3D surface model. Utilizing digital dental models can eliminate many of the problems associated with traditional plaster models [4]. Digital technology helps to permanently store the recordings as data in the software, which makes it easier for the operator to retrieve them when needed. In contrast, the manual technique of storing the plaster casts of the patient requires storage space and archiving systems; both of which are space and manpower intensive. Storing plaster casts is not only space-consuming but also carries the risk of damaging or losing the records. On the other hand, digital technology comes at a high cost initially, unlike the traditional method, which is affordable for many institutions. Moreover, the manual method is simpler to use, whereas digital technology requires the training of operators by an expert. The traditional method of duplicating involves many stages, unlike the digital method, which uses 3D scanning and printing technologies. Although scanners are useful and effective nowadays, they still have some limitations. Since these systems have only been on the market for a short time, not enough studies have investigated their usability and time efficiency. Therefore, the present study aims to compare the analysis and measurements of the two approaches; the digital technique (Sirona and Kavo scanners) and manual technique, in terms of; accuracy, repeatability, reproducibility, and time efficiency.
2. MATERIALS AND METHODS
The aim of this study is to compare the measurements of dental casts collected in two ways; manual measurements of the plaster casts; and software measurements of digital scans of plaster casts generated using two laboratory scanning systems (Kavo and Sirona).
In this study, accuracy, repeatability, reproducibility, and time efficiency were investigated. The following is an adapted definition for this purpose [5, 6].
Accuracy; “the fact of being exact or correct” or “agreement of a particular measurement with an accepted standard” or “conforming to a standard or true value”; Repeatability and Reproducibility refer to the “capacity of a measuring procedure to produce the same result on each occasion in a series of procedure” but the difference between them is the repeatability is under the same condition, in contrast of reproducibility which occurs under different conditions, and time efficiency.
The measurements of the dental cast were conducted by two main techniques: the traditional (manual) technique and the digital technique. In the traditional technique, the digital caliper was used, while in the digital technique, two different laboratory scanners were used: inEos X5 Sirona Scanner (Sirona) and SMD ARCTICA CAD/CAM scanner (KaVo). These two scanner systems were used for both scanning and obtaining measurements through their included software.
2.1. Materials
Using an elastic putty mold, a set of dental casts (upper and lower) were duplicated (standardization for each duplication was ensured in a calibrated stone-water ratio and at a controlled temperature). A total of ten identical copies of each cast were made. The total of twenty jaw models (10 maxillary and 10 mandibular) were numbered from 1 to 20. The first 10 models (from 1 to 10) were maxillary models, and the last 10 (from 11 to 20) were mandibular models. One Way ANOVA was used in statistical analysis.
2.2. Data Collection
Measurements were obtained by three independent operators. The operators had no prior experience with the scanner and were given the same identical scan instruction. All operators were calibrated on scanning and measurement techniques and landmark identification.
2.2.1. Measurement Categories
To test the reliability and validity of the measurement’s accuracy technique, each model was measured by three distinct operators. All operators were calibrated to obtain fifteen measurements from each model in the three different planes (vertical, horizontal, and transfers), as shown in Table 1 and Fig. (1).
| Definition of the Reference | ||
|---|---|---|
| Vertical | Right\left Canine | The distance from the deepest point of the cervical area to the tip of the cusp of the permanent canine. |
| Right\left 1st premolar | The distance from the deepest point of the cervical area to the tip of the buccal cusp of the 1st premolar. | |
| Right\left 1st molar | The distance from the deepest point of the cervical area to the tip of the mesiobuccal cusp of the permanent 1st molar. | |
| Horizontal | Canine width | The greatest mesiodistal diameter from the anatomic mesial contact point to the anatomic distal contact point in the permanent canine. |
| 1st premolar width | The greatest mesiodistal diameter from the anatomic mesial contact point to the anatomic distal contact point in the 1st premolar. | |
| 1st molar width | The greatest mesiodistal diameter from the anatomic mesial contact point to the anatomic distal contact point in the permanent 1st molar. | |
| Transfers | Inter canine width | The distance between the tip of the permanent canine cusp from one quadrant to the other quadrant. |
| Inter 1st premolar width | The distance between the tip of the buccal cusp of the 1st premolar from one quadrant to the other quadrant. | |
| Inter 1st molar width | The distance between the tip of the mesiobuccal cusp of the permanent 1st molar from one quadrant to the other quadrant. | |
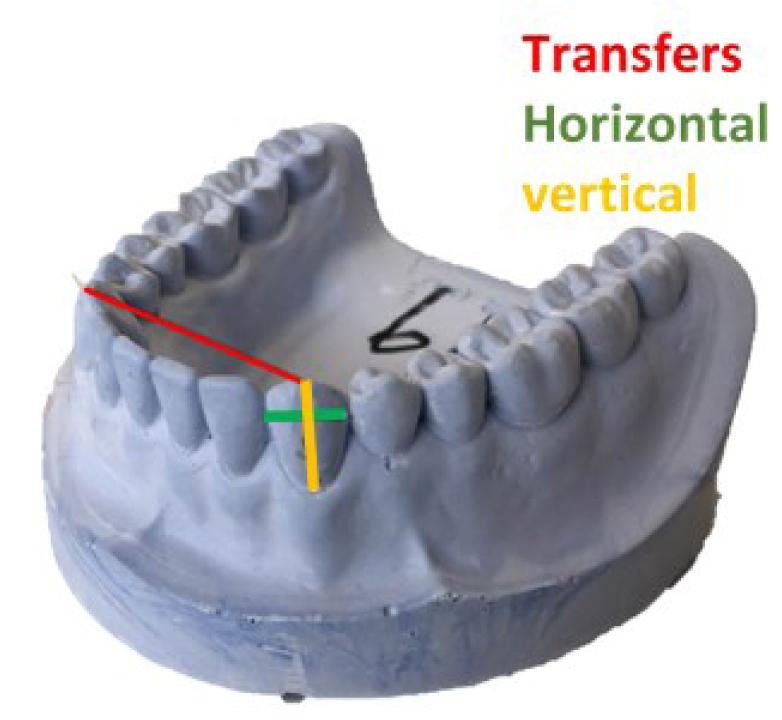
2.3. Traditional Measurement Process
In the traditional technique, each operator was timed by another operator (observer) to ensure the accuracy of timing and to eliminate personal bias. The timing was recorded both for performing the scan and obtaining the measurements. Then, the digital caliper was placed on the specific areas (the height and width of the first molar, first premolar, and canine in each arch, and the width between inter first molar, first premolar, and canine between the two arches in each arch) as shown in Fig. (1). The final measurement appeared on the digital board, then the data were entered into the Excel spreadsheet. The same technique was repeated twice to measure repeatability and reproducibility with an interval of 48 hours to exclude recall bias.
2.4. Digital Scanning and Measuring Process
In the digital techniques, each operator scanned all models individually and was timed by a second observer. Some models had scanning errors that were indicated in the software (e.g., empty gaps that were not scanned correctly in the Sirona scanner that caused the operator to fill the gaps by pressing on the empty gaps, which increased the total scan time). If the entire scan process had to be repeated, the entire time was reset to zero. This occurred very rarely (2.5%). Scan timing started after the model was placed in the scanner and ended when the full arch scan was completed. The scan time was entered into the Excel spreadsheet. Each operator repeated the scan with an interval of 48 hours to eliminate the bias. Following this digital measurement step, the observer began the measuring step’s timer. The operator again measures the height, width, and width between the two arches in each jaw's first molars, first premolars, and canines. In addition, all the data were entered into an Excel spreadsheet, including model number, maxilla or mandible, measurements, time of scanning and time of measurements, operator name, scanner type, and first or second measurement. Each error was recorded with a measurement of the time of the error. Table 2 for the summary. 20 casting models X 15 readings X 3 operators X 2 times (48 hours interval) X 3 methods (digital caliper + inEos X5 Sirona scanner + KaVo SMD ARCTICA CAD/CAM Scanner) = 5400 readings as shown in Fig. (2).
| S.No | inEos X5 Sirona Scanner | KaVo ARCTICA Scanner |
|---|---|---|
| 1 | Place the model in the scanner with a magnet | Place the model in the scanner by screw |
| 2 | Fill in the operator information in the software | Fill in the operator information in the software |
| 3 | Fill the jaw model information in the software, e.g., material and jaw type | Fill in the jaw model information in the software, e.g., material and jaw type |
| 4 | Start the timer for scanning | Start the timer for scanning |
| 5 | Start scanning | Start scanning |
| 6 | If there is any empty gap, they should be pressed and filled by the operator in the modelling step | Stop the scanning timer, and insert it into the excel sheet |
| 7 | Designing step | Start the timer for the measuring |
| 8 | Stop the scanning timer, and fill it in the excel sheet | Start measuring the specific areas |
| 9 | Start the timer for the measuring | Stop the measuring time, and fill it in the excel sheet |
| 10 | Start measuring the specific areas | Insert the measuring data in the excel sheet |
| 11 | Stop the measuring time, and fill it in the excel sheet | |
| 12 | Insert the measuring data in the excel sheet |
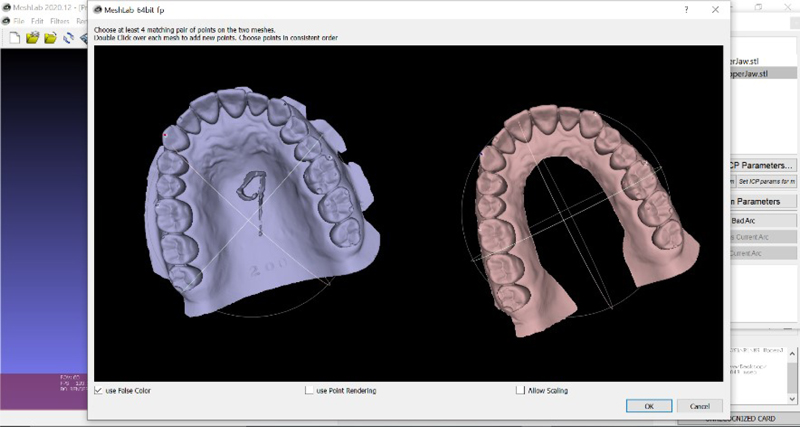
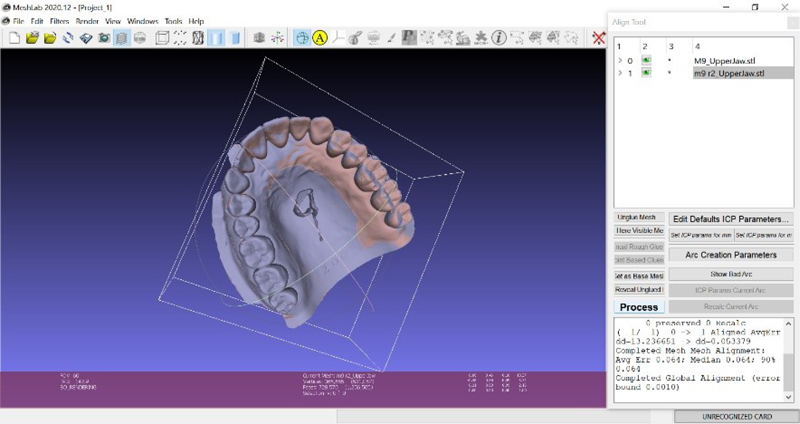
2.5. Superimposition
A MeshLab 2020.12 3D editing software was used to superimpose the two different scanned measurements obtained with Kavo and Sirona scanners. The two scanned images of the same models obtained from different devices were overlapped to determine the accuracy and precision of the scanners (Fig. 3). To measure the intra-operator discrepancy, two random models were selected from each system (Kavo and Sirona) taken by the same operator, then measurements were taken for the two random models by the same operator, and a comparison between the first and second readings was documented. The same was done for the comparison of the inter-operator discrepancy, with randomly selected models for each scanner system, superimposed between the operators, which were measured and compared (Fig. 4). A volumetric discrepancy was then calculated. An Excel spreadsheet was created to analyze the data from the superimposed software.
3. RESULTS
The mean and standard deviations of the three measurement methods (Manual, Digital Kavo, and Digital Sirona) were calculated (Table 3). The mean was calculated for the six readings (the first and second for the three operators). This was calculated for the fifteen different measures obtained, as previously described in the methods section. The mean differences varied between (0.79 highest for inter canine width and 0.06 lowest for right molar width and right premolar). The mean differences were compared using One Way ANOVA (P-value significant if less than 0.05). Statistical differences existed between mean differences in 11 of 15 groups.
A similar approach is followed in the lower jaw, and the results are shown in Table 4. The mean differences varied between (0.47 was the highest for left molar height, canine height, and 0.14 was the lowest for right molar width and left premolar).
The coefficient of variation for the fifteen measurements of the upper jaw was calculated and shown in Table 5. The coefficient of variation varied between 1% for intermolar width, to 8% for right molar height, with a similar height result of 7% for left molar height. Both scanners were confirmed to be accurate based on the various parameters recorded, with no clinically significant differences between the groups.
Table 3.
| Method | - | Direct | - | Sirona | Kavo | |||||||||
|---|---|---|---|---|---|---|---|---|---|---|---|---|---|---|
| Jaw | Mean | SD | Mean | SD | Mean | SD | P-value | |||||||
| Upper | Inter Molar Width | 53.6 | 0.72 | 53.57 | 0.49 | 53.53 | 0.63 | 0.819 | ||||||
| Inter Premolar Width | 43.94 | 0.7 | 43.72 | 0.33 | 43.19 | 0.65 | < 0.001 | |||||||
| Inter Canine Width | 36.09 | 0.84 | 35.94 | 0.49 | 35.3 | 0.66 | < 0.001 | |||||||
| Right Molar Width | 10.17 | 0.44 | 10.22 | 0.57 | 10.16 | 0.72 | 0.814 | |||||||
| Right Premolar Width | 6.98 | 0.32 | 6.96 | 0.35 | 7.04 | 0.45 | 0.5 | |||||||
| Right Canine Width | 7.67 | 0.42 | 7.42 | 0.33 | 7.74 | 0.39 | < 0.001 | |||||||
| center Molar Width | 10.06 | 0.37 | 10.23 | 0.49 | 10.01 | 0.49 | 0.029 | |||||||
| center Premolar Width | 6.94 | 0.29 | 6.95 | 0.31 | 7.19 | 0.65 | 0.003 | |||||||
| center Canine Width | 7.9 | 0.28 | 7.64 | 0.34 | 8.05 | 0.48 | < 0.001 | |||||||
| Right Molar Height | 7.91 | 0.6 | 7.39 | 0.47 | 7.43 | 0.63 | < 0.001 | |||||||
| Right Premolar Height | 8.56 | 0.41 | 8.3 | 0.43 | 8.36 | 0.47 | 0.004 | |||||||
| Right Canine Height | 10.49 | 0.33 | 10.27 | 0.46 | 10.24 | 0.51 | 0.005 | |||||||
| center Molar Height | 7.78 | 0.55 | 7.6 | 0.49 | 7.46 | 0.62 | 0.009 | |||||||
| center Premolar Height | 8.2 | 0.54 | 8.09 | 0.37 | 7.93 | 0.59 | 0.016 | |||||||
| center Canine Height | 10.14 | 0.55 | 10.1 | 0.36 | 9.93 | 0.52 | 0.043 | |||||||
| Method | - | Direct | - | Sirona | - | Kavo | - | |||||||
|---|---|---|---|---|---|---|---|---|---|---|---|---|---|---|
| Jaw | - | Mean | SD | Mean | SD | Mean | SD | P-value | ||||||
| Lower | Inter Molar Width | 46.79 | 0.87 | 46.81 | 0.58 | 46.7 | 0.94 | 0.748 | ||||||
| Inter Premolar Width | 36.29 | 1.51 | 35.87 | 0.33 | 35.69 | 1.69 | 0.042 | |||||||
| Inter Canine Width | 26.85 | 0.68 | 26.56 | 0.41 | 26.3 | 0.52 | < 0.001 | |||||||
| Right Molar Width | 11.31 | 0.36 | 11.22 | 0.38 | 11.36 | 0.52 | 0.175 | |||||||
| Right Premolar Width | 6.42 | 0.34 | 6.63 | 0.36 | 6.67 | 0.4 | 0.001 | |||||||
| Right Canine Width | 7.03 | 0.26 | 6.92 | 0.35 | 7.23 | 0.43 | < 0.001 | |||||||
| center Molar Width | 11.26 | 0.29 | 11.13 | 0.4 | 11.24 | 0.48 | 0.16 | |||||||
| center Premolar Width | 6.6 | 0.27 | 6.72 | 0.37 | 6.74 | 0.5 | 0.099 | |||||||
| center Canine Width | 7.08 | 0.44 | 7.05 | 0.4 | 7.24 | 0.37 | 0.022 | |||||||
| Right Molar Height | 7.75 | 0.6 | 7.51 | 0.54 | 7.74 | 0.58 | 0.033 | |||||||
| Right Premolar Height | 7.38 | 0.26 | 7.47 | 0.42 | 7.39 | 0.54 | < 0.001 | |||||||
| Right Canine Height | 10.05 | 0.31 | 9.75 | 0.35 | 9.5 | 0.64 | < 0.001 | |||||||
| center Molar Height | 8.13 | 0.36 | 7.69 | 0.63 | 7.66 | 0.68 | < 0.001 | |||||||
| center Premolar Height | 7.59 | 0.27 | 7.32 | 0.32 | 7.12 | 0.55 | < 0.001 | |||||||
| center Canine Height | 10.28 | 0.46 | 10.08 | 0.32 | 9.81 | 0.6 | < 0.001 | |||||||
| Lower Jaw | Mean | SD | CV |
|---|---|---|---|
| Inter molar width | 53.57 | 0.62 | 1% |
| inter premolar width | 35.95 | 1.34 | 2% |
| inter canine width | 26.57 | 0.59 | 2% |
| Right molar width | 11.3 | 0.43 | 6% |
| Right Premolar | 6.57 | 0.38 | 5% |
| Right canine width | 7.06 | 0.37 | 5% |
| Left molar width | 11.21 | 0.4 | 5% |
| Left Premolar | 6.69 | 0.39 | 7% |
| Left canine width | 7.12 | 0.41 | 5% |
| Right molar height | 7.67 | 0.58 | 8% |
| Right Premolar height | 7.56 | 0.46 | 5% |
| Right canine height | 9.77 | 0.51 | 4% |
| Left molar height | 7.83 | 0.61 | 7% |
| Left Premolar height | 7.34 | 0.44 | 6% |
| Left canine height | 10.06 | 0.51 | 5% |
The coefficient of variation for the fifteen measurements of the lower jaw was calculated and stated in Table 6. The coefficient of variation varied from the lowest value of 2% for inter-canine width and reached the highest value of 8% for the right and left molars.
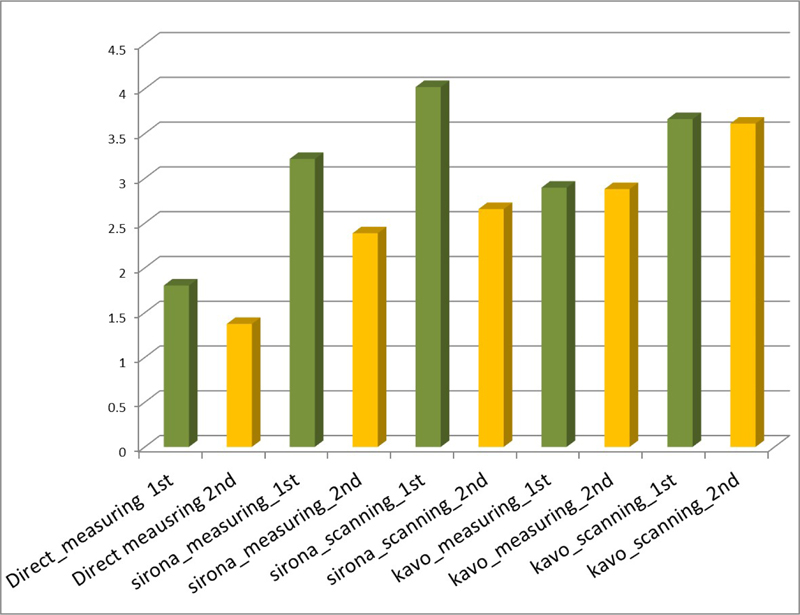
The difference in the time required for the first and second readings was always less the second time; this occurs in all cases whether measuring or scanning (Fig. 5).
| Lower Jaw | Mean | SD | CV |
|---|---|---|---|
| inter premolar width | 35.95 | 1.34 | 4% |
| inter canine width | 26.57 | 0.59 | 2% |
| Right molar width | 11.3 | 0.43 | 4% |
| Right Premolar | 6.57 | 0.38 | 6% |
| Right canine width | 7.06 | 0.37 | 5% |
| Left molar width | 11.21 | 0.4 | 4% |
| Left Premolar | 6.69 | 0.39 | 6% |
| Left canine width | 7.12 | 0.41 | 6% |
| Right molar height | 7.67 | 0.58 | 8% |
| Right Premolar height | 7.56 | 0.46 | 6% |
| Right canine height | 9.77 | 0.51 | 5% |
| Left molar height | 7.83 | 0.61 | 8% |
| Left Premolar height | 7.34 | 0.44 | 6% |
| Left canine height | 10.06 | 0.51 | 5% |
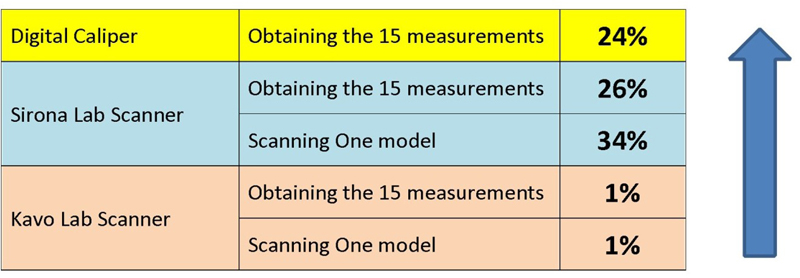
Therefore, in all cases of scanning and measuring, there was an improvement in time between the two occurrences, with varying rates of improvement (Fig. 6). For example, time improved by 24% when measured with the digital caliper, while time improved by 26% when measured with the Sirona scanner. On the other hand, the time improvement when scanning and measuring with the Kavo scanner was minimal at 1%.
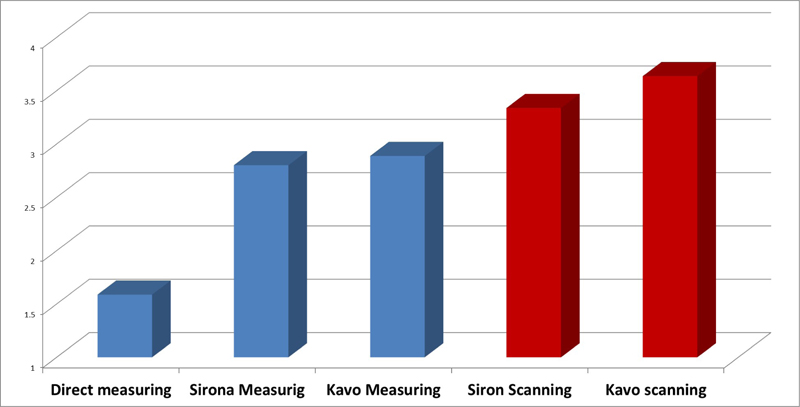
Timewise, Fig. (7) shows the average time for all operators for the total scan time and measurement time required by Kavo, Sirona, and manual technique. The scan time for the Sirona scanner was faster as the time required was less than a half minute than the time required for Kavo. In terms of the measuring time, the manual method was the shortest, taking less than 1.5 minutes on average, while Kavo took nearly 3 minutes.
After using the MeshLab software, the overlapping measurements represented insignificant variation, as the differences were less than 0.06 with a maximum of 0.060 and a minimum of 0.041. The standard deviation was 0.004 and the mean was 0.051. Superimposition between the repeated scans confirmed the previously reported results by the manual measurements. The intra-operator variations were found to be negligible with the superimposition values being as follows: operator 1- Kavo average was 0.050 (0.0002), operator 2-Kavo average was 0.050 (0.0004), and operator 3- Kavo average was 0.050 (0.0002). In addition, similar results were found for the inter-operators scanning superimpositions. Kavo’s average was 0.050 (0.0003), while Sirona’s average was 0.050 (0.001). The reliability of the two scanners was confirmed by manual measurement and superimposition of STL files.
4. DISCUSSION
This study’s findings are consistent with previously published studies in many parts. As previously stated, the coefficient of variation ranged from 1% to 8%, and though some statistically significant differences were estimated across groups, clinically, the differences were negligible and within the acceptable range (less than 1 mm between groups). Similarly, in another study, they found no statistically significant variations in Bolton ratios measured using plaster models and digital records of the same patient [7]. Moreover, further studies have reported that the reproducibility of the digital models via the concordance correlation coefficient was excellent in most cases and good in some [7]. Although there was a statistical difference in the reliability and validity of the digital models across the average mean of the absolute differences of repeated measures for some measures, none were clinically significant. In this current study, the coefficient of variation seems to be much higher for smaller distances than for larger distances, which can be explained by the fact that the smaller distances, such as molar width or height, are very sensitive to the technique and strongly depend on the human factor in identifying and measuring the distances. On the other hand, larger spacings, such as intermolar width, are easier to identify and measure, reducing variation and the chance of inaccuracy. It was agreed in a previous study that one should be aware that the smaller the distance to be measured (e.g., <1 mm), the larger the deviation becomes [8]. Conversely, it is also true that the greater the distance (e.g., <1 cm), the less bias could be expected. In other words, accuracy concerning very small distances, such as in this study (<1 mm) would often be underestimated. However, several studies comparing plaster models with digital models have shown that a measurement difference of less than 0.20 mm is clinically acceptable as it is almost identical to the reliability found for manual measurements [9-12]. Another study evaluated the accuracy of digital models and found that a mean deviation of 0.27 mm has insignificant [13]. The reason for variation could be that this technique or measures are solely dependent on humans identifying and measuring, therefore, it has two points or elements in which the human could make an error in either identifying the points or taking the measurements or reading. If the operators identify the point differently and do not hit it accurately, this explains the differences between the variations within and between operators and this could be explained by the variation in human nature. Some people are more meticulous and accurate than others, this is human nature. It seemed that the learning curve could influence this as the operator became more efficient with practice. Similar to our findings, it was found that in terms of inter- and intra-examiner reliability, assessments on plaster and virtual models were all remarkable for both tooth dimensions and dental arch relationships [14]. Intra-examiner and inter-examiner reliability and test-retest reliability of virtual model analysis were acceptable (ICC > 0.7) for inter-canine, intermolar, overjet, overbite, midline discrepancy, spatial analysis, and tooth width measurements (ICC > 0.7).
The learning curves for the two systems differed, with the Sirona software being more difficult to use at first, but mastered, the time required is substantially less. With the Kavo scanner, on the other hand, there was not much difference or change in the learning curve as the three operators agreed that it was easier to learn. It can be noticed that there is an improvement in the time between the first and second reading in each task. For the Kavo lab scanner, the improvement between scanning and measuring is only 1%, while the improvement for the Sirona is 3-4%. The improvement in the time between the first and second reading in each task is 24% for the digital caliper measurement, 26% for the Sirona lab scanner, and only 1% for the Kavo lab scanner.
Using the digital Boley-gauge is much faster than using the computer for the pure measurements, because the time for the measurements with the digital caliper is less than one second (0.5), while using the computer for the measurements took twice the time as for the manual method. It seems that the manual technique is still faster in terms of time than the digital non-automated measurements because identifying the points and obtaining the measurement digitally is time-consuming and labour-intensive. This could be eliminated in the computer-generated measurement, provided that the identification of the points is done accurately by the software. However, we cannot overlook or ignore the fact that the manual measurement technique requires an actual physical cast and space to store it, which brings with it the burden of storing, sorting, and the need for a larger space to organize and retrieve, whereas for digital all you need is a hard drive. Considering all the previous points and despite the superiority of manual measurements in terms of time, the digital scanned casts are a valid and better alternative. According to a study done in 2010, the occlusal measurement technique for digital models was the best combination of accuracy, repeatability, and speed of measurement [15-19].
CONCLUSION
The use of 3D dental laboratory scanners has proven to be efficient as it not only saves time and effort but is also useful. The two scanners were reliable tools for scanning and reproducing digital dental records. One system seemed to be more time efficient than the other by less than half a minute. In terms of manual measurement technique, it was more time efficient than the digital scanners, but recently this option has been considered impractical. The measurements taken by the operators could vary and be less reliable at small distances, but at large distances, the difference is not noticeable. The mean difference in measurements was less than 1 mm, which is considered clinically insignificant. By using the 3D MeshLab superimposition software, it was found that there was no statistical difference in the scanned measurements between the two scanners, indicating the precision of these systems.
LIST OF ABBREVIATIONS
| 3D | = Three-Dimensional |
| ANOVA | = Analysis of Variance |
| CAM | = Computer Aided Manufacturing |
ETHICAL STATEMENT
The study protocol was approved by the Ethics Committee of King Abdullah International Medical Research Center (KAIMRC) in Riyadh, Saudi Arabia prior to the commencement of this study. (Approval no: RC19/280/R).
CONSENT FOR PUBLICATION
Not applicable.
AVAILABILITY OF DATA AND MATERIALS
The authors confirm that the data supporting the findings of this study are available within the article.
FUNDING
None.
CONFLICT OF INTEREST
The authors declare no conflict of interest, financial or otherwise.
ACKNOWLEDGEMENTS
Declared none.

