All published articles of this journal are available on ScienceDirect.

3D Facial Analysis in Class II Subdivision Malocclusion
Authors Info & Affiliations
Abstract
Background:
Class II subdivision is an asymmetric condition presenting a Class I dental occlusion on one side and a Class II on the contralateral one. It presents a midline deviation that may be caused by a monolateral distalization of the mandible (type 1) or a mesialization of one side of the maxilla (type 2). The evaluation of asymmetry based on 2D radiographic records has been demonstrated to be less accurate than the one made using 3D radiographs.
Objective:
The aim of this work is to evaluate the facial asymmetry in a group of patients with Class II subdivision, compared to patients in Class I without evident asymmetry, by using 3D photographs of the face.
Methods:
32 young adults with Class II subdivision were compared to a group of 32 subjects with bilateral Class I molar relationship. 3D photograph of their face was acquired using a stereophotogrammetric camera (3dMDtrio System-3dMD Atlanta, GA, USA). 3D photographs were imported into the Geomagic Software to create mirror 3D photography. Independent T-tests were made to compare facial asymmetries measured on Class II subdivision group with the Class I group.
Results:
The results show that there is a statistically significant difference in landmarks location between the control group and the experimental group regarding the values measured at the level of the lips and the perioral area. The asymmetry was more marked in patients with mandibular midline deviation. This is in line with previous observations with radiographic investigations.
Conclusion:
For a correct assessment of the asymmetry, a study of 3D photographs cannot replace an evaluation by cone beam, but it can be an important aid to estimate possible asymmetries in the perioral area and in the lip area.
1. INTRODUCTION
The Class II subdivision is a malocclusion determined by an asymmetry in dental occlusion, presenting a Class II on one side and a Class I on the other side [1]. This characteristic is found in 50% of Class II patients, and it is due to a distal position in one of the lower molars or a mesial position in an upper one [2-4]. Consequently, the dental midline is often not coincident: according to Janson et al. [5], in type 1 the deviation is in the lower dental midline, and this is the most frequent condition. In type 2, the deviation is in the upper one.
The accuracy in the diagnostic process is crucial for clinical choices and for evaluating the results after orthodontic treatment [6]. Cassidy et al. [7] postulated that a skeletal mandibular asymmetry causes the Class II subdivision type 1, thus preventing the full midline correction in many cases.
To assess mandibular asymmetries in Class II subdivision malocclusions, Kurt et al. [8] used panoramic imaging, but many authors [9-11] advocate caution in making absolute measurements or relative comparisons because of image distortion and positioning errors.
Janson et al. [10] used one submentovertex, one posteroanterior, and two corrected obliques radiographs of the right and the left sides to measure the asymmetry values in patients with Class II subdivision. In Janson et al. [5], the same method of assessment was used in combination with photographic analysis to distinguish the characteristics between type 1 and type 2 patients. Azevedo et al. [9] used a combination of cephalometric traces on submentovertex and posteroanterior radiographs to assess the asymmetry in Class II subdivision patients with facial asymmetry.
Meloti et al. [12] demonstrated the presence of asymmetry in Class II subdivision patients based on lateral cephalometric measurements.
Computed tomography (CT) and cone-beam (CBCT) began a new era in the diagnosis of asymmetry by reducing projection errors common in conventional radiology. These tools are reliable for assessing asymmetry in syndromic and non-syndromic patients [13, 14]. They offer accurate and detailed information on diagnosis and treatment planning and enable quantitative measurements and half-face comparisons. CBCT was used by Sanders et al. [15] and by Minich et al. [16] in a group of patients with Class II subdivision to assess skeletal and dental asymmetries. The CBCT allowed observing a mandibular asymmetry, which was not demonstrated by previous analysis. Furthermore, de Mattos et al. [17] showed a difference between the glenoid fossa of the Class II side compared to the contralateral one of the Class I side. Li et al. [18] used CBCT analysis in combination with dental cast analysis and functional factors observation investigated by determination of the centric relation (CR)–centric occlusion (CO) discrepancies.
Hence, CBCT analysis allows us to investigate the problem of asymmetry in Class II subdivision patients, but it is not yet a routine examination due to the higher dose of radiation that is not always compensated by the benefits for the patient [19].
Azevedo et al. [9] noticed that in Class II subdivision subjects, there is an apparent asymmetry in the facial aspect. Radiographic exams are not useful to measure soft tissues’ asymmetry. The 2D photographs cannot provide information on the differences between the volumes of the two sides of the face.
The introduction of stereophotogrammetry, a non-invasive 3D surface image technique, allows us to measure the volumes, areas, and angles of the patient’s face without biological costs [20, 21].
The aim of this study is to research the face asymmetry degree in a group of patients with a Class II subdivision compared to a control group of patients with Class I. This purpose was managed by using reverse engineering software on 3D photographs acquired with stereophotogrammetry. The rationale is to investigate the possibility of using stereophotogrammetry to highlight areas of asymmetry in the face of patients with Class II subdivision.
2. MATERIALS AND METHODS
The study was approved by the ethics Committee of the Università Cattolica del Sacro Cuore (#2123). The sample was selected retrospectively from a pool of 653 initial models and photographs of dental arches and 3D stereophotogrammetry of patients who have undergone orthodontic therapies, examined in the period from January 2017 to September 2019.
The patients were divided into two groups:
- Class II subdivision group
- Class I group
2.1. Sample Selection Criteria
Inclusion criteria for the Class II subdivision group (experimental):
(1) Class II subdivision malocclusion (I molar class on one side and II molar class on the other side)
(2) Permanent dentition up to the 1st molars
(3) Both-sex patients aged between 18 and 40
(4) Crowding ≤3mm.
Inclusion criteria for the Class I group (control):
(1) Class I malocclusion (I molar Class on both sides) for the control group
(2) Coincident dental and facial midlines
(3) No clinical or skeletal asymmetries
(4) Inclusion criteria 2 through 4 from the experimental group.
Exclusion criteria (for both groups):
(1) Previous orthodontic treatments
(2) Crossbites
(3) Malformed or missing teeth, or teeth with extensive restorations or gross decay
(4) History of facial trauma or medical conditions that might have altered growth
2.2. Definition of the Sample
For our study, 64 patients between the ages of 18 and 40 were selected, with a mean age of 19.9 years (SD 2), of which 29 males and 35 females.
The subjects considered within the sample were divided into two groups, based on their clinical characteristics:
- Group 0 (controls): 32 patients with molar Class I (13 male subjects and 19 female subjects).
- Group 1 (experimental): 32 patients with Class II subdivision malocclusion (16 male subjects and 16 female subjects).
As a complementary evaluation, Group 1 is divided into two subgroups according to the deviation of the midline, to calculate type 1 and type 2 cases, according to Janson et al. (2007):
- Group 1L. Subjects with a deviation of the lower midline. - 22 subjects (68,75% - type 1)
- Group 1U. Subjects with a deviation of the upper midline- 10 subjects (31,25% - type 2)
2.3. Photogrammetric Data Acquisition
3D photographs of all patients were acquired using a stereophotogrammetric camera (3dMDtrio System, 3dMD LLC, Atlanta, GA, USA). Patients were oriented in a natural head position, with their eyes open and their facial muscles relaxed [9]. All 3D photographs have been taken by an experienced photographer (Fig. 1).
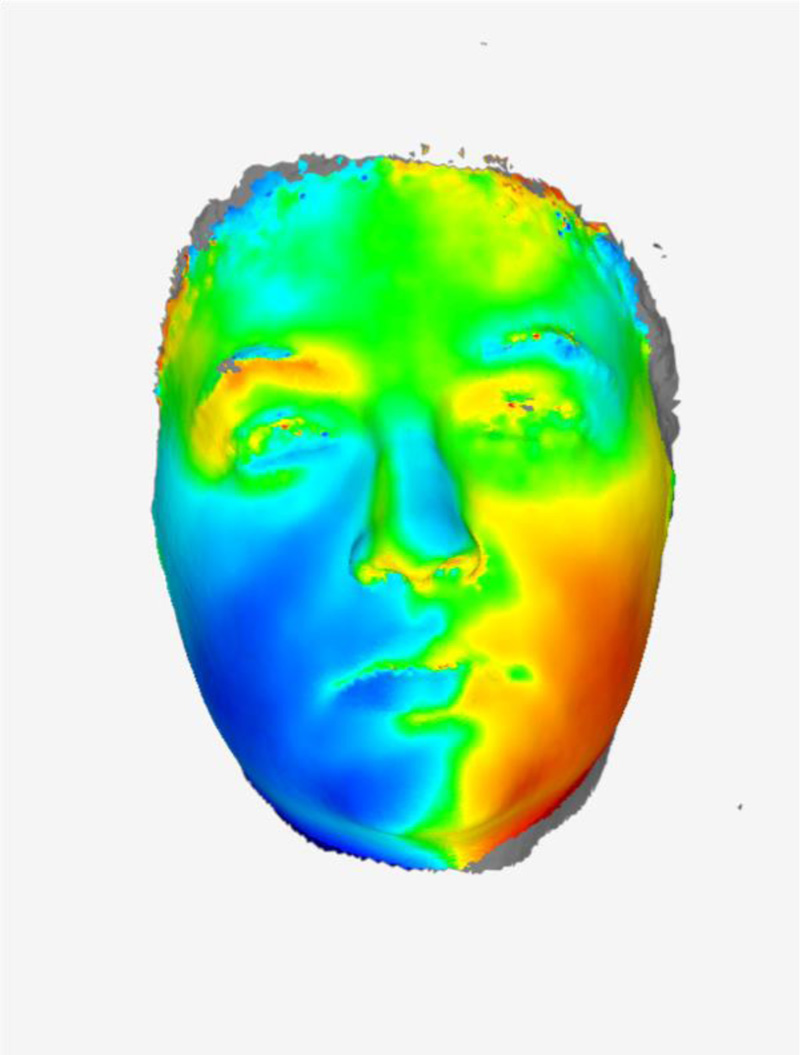
The method that was followed to quantify facial soft tissue asymmetry consists of four consecutive steps performed digitally [22]. Step 1: Removing the boundary areas. From the 3D photograph of the patient, the neck, ears, and hair were removed using the 3DMD Patient Plat Software, 3dMD LLC, to exclude the regions of confusion. The neck was included by the thyroid cartilage at the top and medial to the sternocleidomastoid muscle. This 3D photograph was imported into the Geomagic software (Geomagic Control X; 3D System, Rock Hill, SC).
Step 2: Creating mirror 3D photography.
In Geomagic, sixteen soft tissue landmarks were manually identified (Table 1): Exocanthion left (EXC L), Exocantion right (EXC R), Endocanthion right (END R), Endocanthion left (END L), Nasion (N), Pronasion (PRN), Right alar point (ALAR R), Left alar point (ALAR L), Subnasal (SBN), Upper lip (LSL), Lower lip (LLL), Stomion (STO), Right lip commissure (Ch R), Left lip commissure (Ch L), Right Gonion (GON R), Left Gonion (GON L).
| Landmarks | Abbreviation | Definition |
|---|---|---|
| Nasion | N | The most superior limit of the frontonasal suture in the facial midline |
| Exocanthion Right | Ex R | The soft tissue point located at the external commissure of eye fissure, right side |
| Exocanthion Left | Ex L | The soft tissue point located at the external commissure of eye fissure, left side |
| Endocanthion Right | En R | The soft tissue point located at the inner commissure of eye fissure, right side |
| Endocanthion Left | En L | The soft tissue point located at the inner commissure of eye fissure, left side |
| Pronasion | Prn | The soft tissue point on tip of nose |
| Alar Point Right | Al R | The lower-most portion of the nose, right side |
| Alar Point Left | Al S | The lower-most portion of the nose, left side |
| Subnasion | Sbn | The point of the angle between the septum of the nose and the surface of the upper lip |
| UpperLip | Ls | The most anterior point of the upper lip |
| Lower Lip | Li | The most anterior point of the lower lip |
| Stomion | Sto | The most anterior point of contact between the upper and lower lip. |
| Commissure Right | Ch R | Corner of the mouth, where the vermillion border of the superior labium meets that of the inferior labium, right side |
| Commissure Left | Ch L | Corner of the mouth, where the vermillion border of the superior labium meets that of the inferior labium, left side |
| Gonion Right | Go R | The most posterior inferior point of the angle of the mandible, right side |
| Gonion Left | Go L | The most posterior inferior point of the angle of the mandible, left side |
A transverse plane was constructed through EXC L, EXC R, and N. A coronal plane perpendicular to the transverse plane was constructed through both exocanthions. A sagittal plane was constructed perpendicular to the coronal plane and through N and PRN. The sagittal plane was used to create a mirror 3D photograph.
Step 3: Recording the original and mirror 3D photography.
The original and mirror 3D photography were combined using a complex surface registration algorithm (Iterative Closest Algorithm Point) (Fig. 1).
Step 4: Measuring differences between sides for the experimental and control group.
For each landmark, the delta of the difference between the left and right sides of the control group and the test group was calculated.
Step 5: Statistical Analysis
All data and measurements were analyzed using SPSS statistical software (IBM Company, Chicago, IL, USA).
To assess the normality of data distribution, the Kolmogorov-Smirnov test was used.
The data were analyzed with the Student's t-test for independent groups, with a significance of P<0.05. We proceeded by comparing the delta of each landmark of patients in Class I with those of the group in Class II subdivision of type I and type II.
2.4. Method Error
The intraclass correlation coefficient (ICC) was obtained by separately comparing the values of each point on the axial, coronal and sagittal planes.
The same operator and another experienced operator repeated the landmark selection and measurements of each parameter after two weeks to test the intraoperator and interoperator reliability of the landmark.
3. RESULTS
Intraoperator reproducibility of landmarks placement was calculated with ICC. All landmarks were highly reproducible, with a value between 0.961 and 1.000. Furthermore, interoperator reproducibility of landmarks placement showed a lower, but still high, ICC value, between 0.944 and 0.999 (Table 2).
The comparison between the results of the experimental group and the control group produced significant values for the measures showing the asymmetry in the perioral area and lips (Table 3). The values indicating a significant discrepancy when comparing the difference between the Class I and Class II sides in the experimental group with the control group values were Subnasion (SBN), Lower Lip (Li L), Stomion (STO), and Left Commissure (Ch L).
| Intraclass Correlation Coefficients (ICC) | ||||||
|---|---|---|---|---|---|---|
| Intra-Operator | Inter-Operator | |||||
| Landmark | x | y | Z | X | y | z |
| N | .999 | .997 | 1.000 | .994 | .994 | .998 |
| Ex R | .990 | .999 | .998 | .991 | .992 | .996 |
| Ex L | .995 | .999 | .999 | .987 | .997 | .995 |
| En R | .994 | .999 | .997 | .991 | .992 | .994 |
| En L | .995 | .999 | .998 | .993 | .993 | .998 |
| Prn | .996 | .997 | .999 | .998 | .996 | .999 |
| Al R | .991 | .999 | .997 | .991 | .989 | .993 |
| Al L | .990 | .997 | .996 | .993 | .987 | .992 |
| Sbn | .999 | .998 | .999 | .996 | .994 | .999 |
| Ls | .997 | .998 | .999 | .994 | .992 | .998 |
| Li | .996 | .998 | .998 | .993 | .994 | .999 |
| Sto | .993 | .999 | .999 | .994 | .991 | .992 |
| Ch R | .989 | .999 | .995 | .992 | .989 | .993 |
| Ch L | .988 | .989 | .993 | .974 | .983 | .980 |
| Go R | .983 | .961 | .966 | .977 | .954 | .951 |
| Go L | .988 | .972 | .966 | .966 | .944 | .954 |
| Variable | Class I Side | Class II Subdivision Type I | p-Value |
|---|---|---|---|
| N Δ | -,1750 ±, 75 | -,5064 ± 1,37 | ,292 |
| EXC R Δ | ,5866 1,01 | ,7282 , 89 | ,365 |
| EXC L Δ | -,6134, 97 | -,6077 1,00 | ,876 |
| END R Δ | -0,913, 84 | ,6000 1,20 | ,329 |
| END L Δ | -,0966 1,20 | -,4014 1,45 | ,874 |
| PRN Δ | -,1528 1,01 | -,7555 1,40 | ,213 |
| Alar R Δ | ,5241 2,70 | ,3877 2,46 | ,838 |
| Alar L Δ | ,3428 1,71 | ,5168 2,20 | ,147 |
| SBN Δ | -,8859 1,15 | -1,4782 1,78 | ,008* |
| LS L Δ | -,0784 , 52 | -,0664 , 61 | ,272 |
| LI L Δ | ,0309 , 30 | -,0900 , 76 | ,012* |
| STO Δ | -,0062 , 21 | -,3855 1,22 | ,008* |
| Ch R Δ | ,0141 1,38 | ,2823 2,70 | ,248 |
| Ch L Δ | ,1691 1,21 | ,2036 2,17 | ,044 |
| Gon R Δ | ,5344 2,55 | -,3727 3,80 | ,120 |
| Gon L Δ | -,4528 2,49 | ,3477 3,75 | ,095* |
The results of the difference between the Class I group and the Class II subdivision type I subjects showed a difference between the measure of all the above-mentioned points with a p-value <0.05: Subnasion (SBN) of 0.01, Lower Lip (LI L) of 0.01, Stomion (STO) of 0.01 and Left Commissure (Ch L) of 0.04 (Table 4).
The comparison with Class I group and Class II subdivision type II subjects showed a significant difference limited to Stomion (STO) and Lower Lip (LI L) with p-value<0.05 with the value of 0,00 (STO) and 0,03 (LI L) (Table 5).
4. DISCUSSION
This research investigates the possibility of using stereophotogrammetry to highlight areas of asymmetry in the face of patients with Class II subdivision. The use of 3D photographs of the face to study facial proportions has been validated by Ayoub et al. [23] and Khambay [24].
Studies based on 2D examinations could not reveal facial asymmetries of soft tissues and facial bones [4, 5, 25].
Janson et al. [5] did not find an evident skeletal component in their Class II subdivision sample, but just an occlusal impairment in molars’ position.
The results of recent research on CBCT of patients with Class II subdivision agree on the presence of asymmetry as a hallmark of this malocclusion.
Studies by Sanders et al. [15] on CBCTs of patients with Class II subdivision have highlighted the skeletal characteristics that distinguish it: 1) skeletal and dental asymmetries are both present, 2) on the Class II side, total mandibular length and ramus height is shorter, and the mandible is positioned posteriorly, 3) the maxillary first molars on the Class II side in a maxilla is mesial positioned without skeletal or positional asymmetries, 4) distal positioning of the mandibular first molar on the Class II side occurs, 5) there are no asymmetries in the condylar pole, 6) many dental asymmetries are present.
Huang’s research [26] has shown the presence of asymmetry also in the morphology of the glenoid fossae, like what has been observed in additional research on unilateral crossbite using 3D radiographs [27].
From the above, it can be deduced that a thorough diagnosis cannot be separated from the use of 3D radiographs. However, with this instrument, it is not possible to highlight and measure the differences between the sides in Class II and that in Class I at the level of the soft tissues. With stereophotogrammetry, it was possible to highlight the presence of significant asymmetry, especially in the perioral and lip area. The difference between the two sides is more evident in patients with Class II subdivision type 1, who show significant values in four of the considered measures. Patients with type 2 were fewer and less asymmetric, showing significant results only in measures concerning the landmarks of lower lip and stomion.
| Variable | Class I Side | Class II Subdivision Type II | p-value |
|---|---|---|---|
| N Δ | -,1750 , 75 | -,1540 , 27 | ,435 |
| EXC R Δ | ,5866 1,01 | ,6180 , 86 | ,490 |
| EXC L Δ | -,6134, 97 | -1,2270 , 58 | ,182 |
| END R Δ | -0,913, 84 | ,6350 , 72 | ,521 |
| END L Δ | -,0966 1,20 | -,5060 , 95 | ,590 |
| PRN Δ | -,1528 1,01 | -,6490 , 58 | ,716 |
| Alar R Δ | ,5241 2,70 | 1,0800 1,73 | ,257 |
| Alar L Δ | ,3428 1,71 | ,6670 1,62 | ,613 |
| SBN Δ | -,8859 1,15 | -,7890 1,47 | ,255 |
| LS L Δ | -,0784 , 52 | -,2040, 91 | ,163 |
| LI L Δ | ,0309 , 30 | -,0650, 98 | ,030* |
| STO Δ | -,0062 , 21 | -,2610, 83 | ,000* |
| Ch R Δ | ,0141 1,38 | ,1800 1,76 | ,237 |
| Ch L Δ | ,1691 1,21 | ,0750 1,80 | ,054 |
| Gon R Δ | ,5344 2,55 | -,2730 1,94 | ,465 |
| Gon L Δ | -,4528 2,49 | ,2880 2,02 | ,418 |
| Variables | Class I | Class II Subdivision | p-value |
|---|---|---|---|
| N Δ | -,1750 , 75 | -,3969 1,15 | ,638 |
| EXC R Δ | ,5866 1,01 | ,6938 , 87 | ,278 |
| EXC L Δ | -,6134, 97 | -,8012 , 093 | ,777 |
| END R Δ | -0,913, 84 | ,6109 1,07 | ,582 |
| END L Δ | -,0966 1,20 | -,4341 1,28 | ,958 |
| PRN Δ | -,1528 1,01 | -,7222 1,20 | ,372 |
| Alar R Δ | ,5241 2,70 | -,0709 2,34 | ,643 |
| Alar L Δ | ,3428 1,71 | ,5637 2,01 | ,373 |
| SBN Δ | -,8859 1,15 | -1,2628 1,69 | ,005* |
| LS L Δ | -,0784 , 52 | -,1094 , 70 | ,175 |
| LI L Δ | ,0309 , 30 | -,0822 , 82 | ,012* |
| STO Δ | -,0062 , 21 | -,3466 1,10 | ,002* |
| Ch R Δ | ,0141 1,38 | ,2503 2,41 | ,214 |
| Ch L Δ | ,1691 1,21 | ,1634 2,03 | ,027* |
| Gon R Δ | ,5344 2,55 | -,33416 3,3 | ,325 |
| Gon L Δ | -,4528 2,49 | ,3291 3,27 | ,307 |
The limit of stereophotogrammetry is that linear measurements on soft tissues are inaccurate because they can be influenced by too many variables depending on the age and state of the patient (obesity, muscle trophism, skin changes, etc.). For this reason, measurements on the size of the mandible must be taken by other means, such as CBCT.
Stereophotogrammetry is useful for completing information on the facial appearance of patients with a Class II subdivision. It is non-invasive, which means that it can adapt to all clinical situations, while the 3D rx exam has limitations in daily practice due to the higher radiation dose emitted.
CONCLUSION
This research has highlighted the presence of asymmetries also at the level of soft tissues in patients with Class II subdivision.
The asymmetry is evident at the level of the lips and the perioral area in all patients of the experimental group, compared to the control group. Patients who have a deviation of the mandible with respect to the midline of the face are more asymmetrical than those with dental malocclusion, mainly located in the maxillary arch.
The Stereophotogrammetry tool can help CBCT identify facial asymmetry in Class II subdivision patients while avoiding biological costs to the patient.
These results encourage future studies through 3D stereophotogrammetry of facial asymmetries versus other types of malocclusion.
ETHICS APPROVAL AND CONSENT TO PARTICIPATE
The study was approved by the ethics Committee of the Università Cattolica del Sacro Cuore, Roma (#2123), Record 22643/18 (6634/19) ID:2123.
HUMAN AND ANIMAL RIGHTS
No Animals were used in this research. All human research procedures followed were in accordance with the ethical standards of the committee responsible for human experimentation (institutional and national), and with the Helsinki Declaration of 1975, as revised in 2013.
CONSENT FOR PUBLICATION
Written informed consent was obtained from all participants.
AVAILABILITY OF DATA AND MATERIALS
The datasets used and/or analyzed during the current study are available from the corresponding author on reasonable request.
FUNDING
None.
CONFLICT OF INTEREST
The authors declare no conflict of interest, financial or otherwise.
ACKNOWLEDGEMENTS
Declared none.

