All published articles of this journal are available on ScienceDirect.

Accuracy and Reliability of Space Analysis Measurements in Digital Models with Different Degrees of Crowding
Authors Info & Affiliations
Abstract
Background:
With the introduction of digital systems in the orthodontic field, it is not still clear if such systems can accurately substitute analogical systems in the diagnosis and orthodontic treatment plane.
Objective:
The study compared the Arch Length Discrepancy (TALD) and Bolton ratio obtained from plaster dental casts (gold standard) and digital models and tested the null hypothesis that TALD and Bolton ratio measurements in digital models are affected by the degree of crowding.
Methods:
The sample included 40 dental models divided into five sub-groups, according to the American Board of Orthodontists (ABO) score of crowding. Plaster casts were scanned by a 3D laser scanner to obtain digital models. In digital and plaster models, the mesiodistal width of each tooth and arch lengths (maxillary and mandibular) were measured to calculate anterior and total Bolton ratios and TALD. Three operators performed measurements on plaster and digital models using a digital caliper and OrthoAnalyzerTM 3D software (3Shape A/S, Copenhagen, Denmark).
Results:
No statistically significant differences were obtained for intra and inter-examiner reliability (p > 0.05). When comparing plaster and digital findings, statistically significant differences were obtained for all measurements except for mandibular arch length and anterior Bolton ratio. In general, there was an overestimation of tooth size and arch length discrepancy in digital models. Moreover, the mean difference of measurements between both the methods increased in more crowded models.
Conclusions:
Crowding affects, the accuracy of Bolton ratio, and the arch length measurements. since the overestimation is relatively small, it should not be considered of clinical significance.
1. INTRODUCTION
Comprehensive diagnosis and treatment planning are essential for a successful orthodontic practice [1]. In this respect, a key process is the Study Model Analysis (SMA) which provides a three-dimensional evaluation of the patient’s dental malocclusion [2, 3]. Furthermore, study models are used to carry out space analysis, i.e. the assessment of Tooth Size and Arch Length Discrepancy (TALD) and the Bolton ratio, which may significantly influence the final therapeutic approach [4].
These diagnostic measurements are traditionally performed on plaster casts, which represent the “gold standard”. However, since the introduction of 3D scanners and good software, many clinicians have been focusing on digital models for different reasons, mainly the absence of physical storage space and more efficient communication with colleagues and lab operators [5, 6].
Several studies have suggested that the accuracy of space analysis measurements on digital models is clinically acceptable when compared with the analysis of plaster models [1, 4, 7, 8]. However, these studies included dental models with low to medium degree of crowding (not exceeding 4.69 mm), as suggested by a recent meta-analysis [1, 9]. In this respect, it has been demonstrated that the severity of crowding can negatively affect the reliability of Bolton tooth-size analysis on plaster models [10]. Moreover, in digital models, it is impossible to reproduce the interproximal surfaces of crowded teeth, instead, they partially interpolated by the algorithm and this may result in variations of dental measurements compared to plaster models. Thus, further evidence is needed to evaluate the reliability and accuracy of digital-plaster model measurements on dentition with different degrees of crowding.
The aim of the present study was: 1) to assess the reliability of measurements of TALD and Bolton ratio in both plaster and digital models including also subjects with crowding > 7 mm, and 2) to evaluate the accuracy of these measurements performed on digital models with different degrees of crowding, according to the ABO score [11-14].
2. MATERIALS AND METHODS
Pretreatment sets of plaster models (maxillary and mandibular) were randomly selected from those of 298 patients seeking orthodontic treatment at the Department of Orthodontics of the University of Catania from January 2014 to July 2017. For inclusion in the study, each dental cast had to match the following criteria:
a. Complete in permanent incisors, canines, premolars, and first molars in both the maxillary and mandibular arch;
all teeth having normal morphology;
absence of attrition and caries or restorations affecting the mesiodistal or buccal-lingual diameter of the crown;
b. No orthodontic treatment: A preliminary power analysis suggested that a minimum of 8 models per group were required to detect 0.5 mm of the difference of tooth width by the 2 methods, with setting α = 5% and a power of 80%. Thus, a sample size of 40 dental casts (both maxillary and mandibular arches) was randomly selected.
c. One-hundred and three models were selected on the basis of the inclusion criteria. A preliminary assessment of dental crowding was performed by an expert orthodontist (A.L.G.). Later on, five groups were created according to the American Board of Orthodontists (ABO) score11 of crowding, namely: group “A”= from ≥ 0 to ≤ 1 mm, group “B”= from > 1 to ≤ 3 mm, group “C”= from > 3 to ≤ 5 mm, group “D”= from > 5 to ≤ 7 mm and group “E”= from > 7 mm. From each group, 8 models were randomly selected by using a web application (www.randomizer.org) for a final sample of 40 plaster models.
The plaster casts were blindly coded and digitalized by a laser light 3D digital scanner (3Shape D500, resolution: two 1.3 megapixel video-cameras, resolution < 10 µm, 3Shape A/S, Copenhagen, Denmark) and then converted into a 3D stereolithographic file (.stl) through specific software (ScanIt™ Orthodontics, version XX, 3Shape A/S, Copenhagen, Denmark).
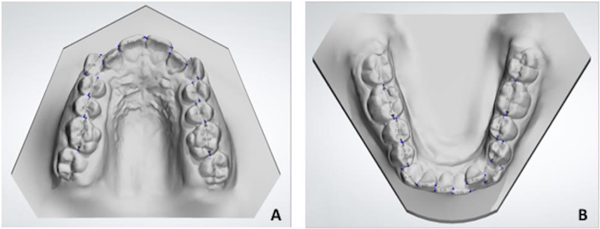
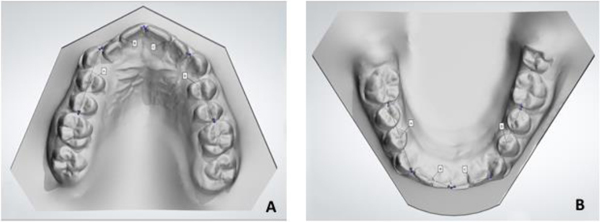
The Mesiodistal (MD) width of each tooth and the arch length were measured on both arches in order to calculate anterior and total Bolton ratios and TALD. Measurements on plaster models were performed using a digital caliper (Digimatic Caliper: 700-113 MyCal Lite, Mitutoyo America Corp, Plymouth, Mich, USA) while measurements on digital models were performed on a 26-in computer screen using a specific function of the software OrthoAnalyzer, version 1.6.1.6 (3Shape A/S, Copenhagen, Denmark). All measurements were recorded to the nearest 0.1 mm. MD widths were assessed by measuring the greatest mesiodistal diameter of each tooth parallel to the occlusal plane and calculating mesial to the first premolars for the anterior Bolton ratio, mesial to second molars for the overall Bolton ratio and mesial to first molars for TALD (Figs. 1a,b) [14, 15]. To assess TALD, the arch length was measured by the segment arch approach, that is by dividing the maxillary or mandibular arch into four segments (Figs. 2a,b).
Measurements were performed independently by three expert orthodontists, on both the plaster and digital models. Eight sets of casts were measured per day to avoid eye fatigue and to minimize the possibility of subjective error. After one month, 10 digital models and 10 plaster casts were randomly selected and re-measured by all the operators to assess intra-rater repeatability. Reliability was considered as the extent to which a measurement was repeatable under identical conditions for the new diagnostic test (digital) and the gold standard (plaster) [16]. Accuracy was considered as the degree to which the new diagnostic test (digital) conforms to the gold standard (plaster) [7, 17].
2.1. Statistical Analysis
All the data were recorded on a Microsoft Excel spreadsheet (Microsoft, Redmond, WA, USA) and analyzed using SPSS version 24 Statistics software (IBM Corporation, 1 New Orchard Road, Armonk, New York, USA). Normal distribution of data was preliminarily checked by using the Shapiro-Wilk test. Intra-examiner reliability was assessed for both manual and digital measurements using a paired t-test. Inter-examiner reliability was evaluated by the Intra-class Correlation Coefficient (ICC).
Accuracy was evaluated comparing manual and digital measurements by using the paired t-test.
To investigate if the accuracy of measurements could be affected by the degree of crowding, the differences between digital and plaster cast measurements were calculated for each of the 5 groups of crowding. The values obtained were further analyzed by one-way Analysis of Variance (ANOVA), in order to accept or reject the null hypothesis that accuracy is related to the degree of crowding. The level of significance was set at P < 0.5.
3. RESULTS
No differences were found between the two intra-examiner reading sessions for the three operators, considering all the tested measurements in both plaster and digital models (p < 0.05) (data not shown). Inter-examiner reliability was found to be almost perfect for all parameters measured (Table 1), with ICC values ranging from 0.812 to 0.996 for plaster casts and from 0.766 to 0.996 for digital models. The highest ICC values for inter-examiner measurements were for TALD, and the lowest for the overall Bolton ratio.
Table 2 shows the mean values and the relative difference between digital and plaster models for each measurement. The greatest differences were found for MD width in the maxilla (-1.14 mm) and TALD in both maxillary (- 0.69) and mandibular (- 0.82 mm) arches (p < 0.01). Differences were also found in the measurement of arch length, being significant only for the maxillary arch (-0.45 mm) (p < 0.05). In general, an overestimation of measurements for digital models was found .
Differences in Bolton ratio were found using plaster and digital models, being 0.59% for overall ratio (P < 0.01) and 0.35% for anterior ratio (not significant).
Table 3 shows the descriptive statistics for each of the 5 groups of crowding, according to the ABO score. In almost every instance, measurement values obtained from digital models were higher than those obtained from plaster models. In this respect, such discrepancy significantly differed for maxillary and mandibular TALD (p < 0.001) and for the overall Bolton ratio (p <0.05) among the 5 groups of crowding. These differences were more evident in group 5 (i.e., crowding > 7 mm) where the discrepancy was 2.04 mm for mandibular TALD and 1.43 mm for maxillary TALD, respectively (Table 4).
4. DISCUSSION
Several studies [1, 4, 7, 8, 17-25] have examined the accuracy and reliability of digital models concerning space analysis and Bolton ratios. Some of these studies reported very small but statistically significant differences between measurements made on digital models compared to plaster casts, ranging from 0.07 to 1.47 mm for arch length, from 0.83 to 0.91 for the anterior Bolton ratio and from 0.21 to 0.87 for overall Bolton ratio [26]. However, these studies were carried out on relatively well-aligned models, with a low to medium degree of crowding [9]. The presence of crowding, in fact, may alter the relationship of the teeth, in such a way that the ideal interproximal contact points could sometimes be estimated. This estimation may introduce variations in the measurement of the teeth, affecting the reliability of the analyses of tooth-size proportion conducted on crowded dental casts [9]. Furthermore, the degree of crowding may confound the accuracy of the digital models, since undercuts may be missed during the scanning process [26].
A previous study excluded models with severe crowding to prevent bias, because of the difficulty in accurately determining tooth widths in crowded dentition [27]. As a matter of fact, many years ago, Shellhart [10] stated that clinically, significant measurement errors can occur on casts with at least 3 mm of crowding. This assumption, however, was based on findings obtained by a Boley gauge and needle-pointed dividers and should be re-evaluated in the light of modern digital techniques.
To the best of our knowledge, this is the first study that 1) assessed the reliability of space analysis measurements in both plaster and digital models including subjects with crowding > 7 mm, 2) and examined the accuracy of these measurements performed on digital models with different degrees of crowding, according to the ABO score [11]. For the purpose of our study, the plaster casts were used for digitization instead of impressions of the models to exclude the possibility for deformation or dimensional changes [4, 20].
Our results suggest high intra-observer reliability for the measurements performed on both digital and plaster models, and this is consistent with previous findings [2, 21, 22, 26]. Moreover, we found excellent inter-examiner reliability for measurements performed on the 2 types of models, indicating that they can be accurately reproduced by external examiners; this is also in line with previous studies [23, 24].
In our study, accuracy between digital and plaster models yielded some differences. We found a statistically significant discrepancy of 0.59 for overall Bolton, which revealed an overestimation of digital measurement. However, by converting this value into millimeter [23], this overestimation equated to 0.68 mm of tooth-size discrepancy, which must be considered clinically irrelevant [10]. Our findings are similar to those reported by Hajeer, who found differences between plaster and digital models of 0.83 for anterior Bolton ratio and 0.87 for the overall Bolton ratio [28]. Also, Naidu reported a statistically significant difference, being 0.91 for the anterior Bolton ratio and 0.21 for the overall Bolton ratio [23].
We found a mean difference of 0.69 mm for maxillary TALD and 0.82 mm for mandibular TALD between plaster and digital models and also a mean difference of 1.14 mm and 0.53 mm in maxillary and mandibular tooth size width, respectively. However, none of these values exceeded the threshold of 1.5 mm for a clinical significance, as suggested by the literature [29]. In this respect, Mullen [19] demonstrated that the accuracy of SPACE analysis was found to be similar in both digital models and dental plaster casts.
When comparing data of the 5 groups with different degrees of crowding, statistically significant differences were obtained. Indeed, the differences in TALD and overall Bolton ratio between plaster and digital models increased with the severity of crowding, with mandibular TALD reaching a mean difference of 2.04 mm in group 5, i.e. with >7 mm of crowding. It could be argued that 2 mm of variation in TALD may be determinant in the decision-making process of borderline cases, i.e. extraction vs. no-extraction [4]. However, it should be underlined that we obtained this difference only in severely crowded dentition, where such a variation is unlikely to alter the treatment plane.
In general, we found an overestimation of digital measurements compared to plaster ones. With digital models, operators can freely measure the maximum mesiodistal diameter without the access issues of caliper’s tips, and this may account for the slightly higher digital values [7]. Furthermore, in digital models, the interproximal area of crowded teeth can be partially reconstructed by computer algorithms due to some amounts of missing data and this can cause slight variations in contact point locations between the plaster and digital models [7, 30].
| - | Examiner 1 |
Examiner 2 | Examiner 3 | Examiner 1 | Examiner 2 |
Examiner 3 | Plaster | Digital | |
|---|---|---|---|---|---|---|---|---|---|
| Maxillary TALDa | 4.06 (3.06) | 4.11 (3.09) | 3.93 (3.22) | 4.75 (3.45) |
4.80 (3.44) | 4.64 (3.25) | 0.992 | 0.996 | |
| Mandibular TALDa | 4.18 (2.94) | 4.22 (2.83) | 4.20 (2.84) | 5.00 (3.44) |
4.98 (3.28) | 4.94 (3.47) | 0.996 | 0.996 | |
| Overall Bolton ratiob | 93.24 (2.30) | 93.02 (3.22) | 92.35 (2.66) | 92.65 (2.31) | 92.97 (3.10) | 92.72 (2.77) | 0.812 | 0.766 | |
| Anterior Bolton ratiob | 79.77 (3.09) | 79.91 (3.83) | 80.01 (3.44) | 79.42 (2.37) | 79.97 (3.61) | 80.28 (3.40) | 0.862 | 0.780 | |
b Units are represented in percentage; TALD reported in absolute value; ICC= intraclass correlation coefficient.
| - | Arch |
Plaster (N=40) |
Digital (N=40) |
Mean Differences Plaster - Digital |
p value (Plaster vs Digital) |
|---|---|---|---|---|---|
| Arch Length Mean (SD)a | Maxillary | 69.09 (4.18) | 69.54 (4.60) | -0.45 | * |
| Mandibular | 61.86 (4.02) | 61.57 (4.69) | 0.29 | NS | |
|
Tooth Width Mean (SD)a |
Maxillary | 73.15 (3.41) | 74.29 (3.25) | -1.14 | ** |
| Mandibular | 66.04 (2.51) | 66.57 (2.89) | -0.53 | * | |
|
TALD Mean (SD)a |
Maxillary | 4.06 (3.06) | 4.75 (3.45) | -0.69 | ** |
| Mandibular | 4.18 (2.94) | 5.00 (3.44) | -0.82 | ** | |
|
Overall Bolton Ratio Mean (SD)b |
- | 93.24 (2.30) | 92.65 (2.31) | 0.59 | ** |
|
Anterior Bolton Ratio Mean (SD)b |
- | 79.77 (3.09) | 79.42 (2.37) | 0.35 | NS |
b Units are represented in percentage; TALD reported in absolute value; p value based on a paired t-test: *p < 0.05; **p < 0.01; NS = Non-Significant. Difference plaster - digital = (+) plaster is larger; (-) digital is larger.
| Mean Values (SD) | ||||||||||
|---|---|---|---|---|---|---|---|---|---|---|
| - | Plaster | Digital | ||||||||
| - | A | B | C | D | E | A | B | C | D | E |
|
Maxillary TALD a |
0.54 (0.31) | 1.87 (0.58) | 3.76 (0.57) | 5.33 (0.22) | 8.82 (1.97) | 0.53 (0.18) | 2.29 (0.48) | 4.31 (0.24) | 6.40 (0.49) | 10.25 (0.84) |
| Mandibular TALD a | 0.33 (0.15) | 2.17 (0.50) | 4.10 (0.39) | 5.69 (0.41) | 8.64 (0.92) | 0.55 (0.15) | 2.64 (0.24) | 4.62 (0.34) | 6.52 (0.34) | 10.68 (0.42) |
|
Overall Bolton Ratio b |
94.53 (2.73) | 92.05 (1.94) | 93.54 (1.35) | 92.64 (1.17) | 93.41 (3.31) | 94.42 (2.80) | 92.22 (2.31) | 92.31 (1.38) | 91.58 (0.99) | 92.69 (2.92) |
|
Anterior Bolton Ratio b |
80.43 (4.89) | 77.60 (2.73) | 81.14 (1.27) | 79.82 (1.22) | 79.83 (3.24) | 79.49 (3.40) | 78.65 (2.74) | 80.26 (0.81) | 78.99 (1.40) | 79.68 (2.80) |
| - |
Mean Differences Plaster - Digital |
- | ||||
|---|---|---|---|---|---|---|
| - | A | B | C | D | E | p value |
| Maxillary TALD a | 0.01 | -0.42 | -0.55 | -1.06 | -1.43 | *** |
| Mandibular TALD a | -0.22 | -0.47 | -0.52 | -0.83 | -2.04 | **** |
| Overall Bolton Ratio b | 0.11 | -0.17 | 1.23 | 1.06 | 0.83 | * |
| Anterior Bolton Ratio b | 0.94 | -1.05 | 0.88 | 0.83 | 0.15 | NS |
b Units are represented in percentage; TALD is reported in absolute value; “A”= group from ≥0 to ≤1 mm; “B”= group from >1 to ≤3 mm; “C”= group from >3 to ≤5 mm; “D”= group from >5 to ≤7 mm; “E”= group over >7 mm.
Besides, these findings raise the question whether the manual measurement is indeed more accurate than digital measurements, with a cross-section that offers an easier view [31, 32]. In fact, although plaster models are currently considered the gold standard, this does not or should not imply that they are measured without errors [33-35]. Therefore, neither method can be regarded as providing unequivocally correct measurements [21].
Measurement differences between the plaster and computer models, though generally small, were statistically significantly correlated to the degree of crowding. Nevertheless, the question remains open if they are clinically significant. The true test of clinical significance would be to determine whether treatment plans produced with digital models with crowding differ significantly from treatment plans produced with plaster models. In turn, the results of the treatment from the two different sets of models would determine the true value of digital models.
CONCLUSION
- Almost perfect intra-examiner and inter-examiner reliability was obtained for all measurements performed on both plaster and digital models.
- Overall, Bolton ratio, Arch Length Discrepancy (TALD) and Mesiodistal (MD) width significantly differed between plaster and digital models analyses. In digital models, there was an overestimation of tooth size and arch length discrepancy.
- The differences between the measurements performed on plaster and digital models were larger in those groups with more severe dental crowding.
- However, with relatively small differences in measurements from digital and plaster models, the clinical significance has to be further evaluated.
ETHICS APPROVAL AND CONSENT TO PARTICIPATE
Not applicable.
HUMAN AND ANIMAL RIGHTS
No animals/humans were used in the study that is the basis of this research.
CONSENT FOR PUBLICATION
Not applicable.
AVAILABILITY OF DATA AND MATERIAL
The data sets analyzed during the current study are availabe from the corresponding author upon request.
FUNDING
None.
CONFLICT OF INTEREST
The authors declare no conflict of interest, financial or otherwise.
ACKNOWLEDGEMENTS
Declared none.

