All published articles of this journal are available on ScienceDirect.

Surface Roughness and Necessity of Manual Refinishing Requirements of CAD/CAM-Manufactured Titanium and Cobalt-Chrome Bars – A Pilot Study
Authors Info & Affiliations
Abstract
Background:
Due to their increased precision, CAD/CAM generated bars (Computer-Aided Design/ Computer-Aided Manufacturing) are increasingly utilized in implant prosthodontics. For optimal clinical results, surface morphology should promote the integration of soft tissue while minimizing plaque and bacterial retention.
Objective:
Despite their clinical use, only limited information on the biological and clinical surface quality of CAD/CAM milled bars is available. The aim of the study was therefore to characterize the surface topography of bars of different manufacturers based on the profilometric analysis and the need for manual post-processing in the laboratory.
Methods:
A custom mandibular edentulous cast with four anterior implants was used as a reference cast and reproduced eight times. On each reproduction cast, corresponding scan flags were positioned and digitized. Acrylic 3D printed bar frameworks were produced and sent to the respective production center along with the digital files of the CAD bars for milling. In the course of profilometric analysis, all bars were examined in three critical Regions of Interest (ROI): Transmucosal, labial, basal. Sa and Ra values of each construction were determined. To evaluate the necessary refinishing time eight dental technicians macroscopically evaluated the bars by performing a subjective visual inspection. Kruskal-Wallis H-tests and Tukey and Kramer's post hoc tests were applied to detect differences between the samples.
Results:
After profilometric examination, three specimens (Dentsply Sirona: ZDC; Straumann: ZST; CAMLOG: ZCC) demonstrated surface roughness values in the biological acceptable range (Sa 0.2-0.4 μm) in the transmucosal region and provided optimal conditions for a reliable soft tissue adaptation. The Ra measurements revealed values beyond the acceptable threshold in the transmucosal region for three bars (Straumann: ZST; Dentsply Sirona: ZDC; Amann Girrbach: LAC). Four bars (LAC: Amann Girrbach; ZBC: BEGO; Datron: LDC & LDT; Zirkonzahn: ZZC) needed undesirable extensive manual rework. The evaluation of quality and time for manual post-processing by dental technicians confirmed the measurement-based ranking of the bars.
Conclusion:
It is desirable to define a clear roughness threshold for the clinical acceptance of transmucosal CAD/CAM generated surfaces. Clinical studies with profilometric data could help to further improve the surface quality of CAD/CAM milled bars and reduce the need for manual reworking time and effort.
1. INTRODUCTION
In addition to conventional, mucosa-supported prostheses, removable implant-supported solutions form part of the standard restorations of the edentulous jaw. The success of such restorations for both the mandible and the maxilla is described and confirmed in the literature [1, 2]. Especially in the mandible, the implant-supported prosthesis is a frequently used, reliable, and predictable type of treatment [2, 3]. Depending on the type of restoration, success rates of 92-100% (on two implants) and 97.7-100% (on four implants) are documented [4, 5]. As regards the connecting elements, the secondary structure is not only fixed with single elements such as locators, ball attachments, magnets, or telescopes but oftentimes also with rigid bars [2, 6]. Primary prosthetic splinting of the supporting implants reduces micromovements and at the same time minimizes the risk of implant loss [7]. Long-term studies indicate that bar-retained overdentures require less prosthetic maintenance than other types of fixation [8, 9]. Bars can be manufactured in various geometries. These include round bars, Preci-Horix bars, Dolder bar joints, Dolder bar attachments as well as freely designable bar shapes [1, 9]. For a long time, soldered, welded, or cast bars were regarded as the standard type of attachment in the implant-supported restoration of the maxilla and mandible [10, 11]. Since these conventional restorations may shrink, expand, or have unwanted inclusions as a result of the casting process, they must be taken apart, luted intraorally and then soldered or lasered frequently in order to ensure a stress-free fit [12-14]. In order to meet increasing accuracy expectations, the development of Computerized Numerical Control (CNC)-milled bars started at the turn of the millennium and is now frequently used in the context of Computer-Aided Design and Computer-Aided Manufacturing (CAD/CAM) [12, 15-17]. Products based on these technologies promise high stability levels, a stress-free fit, compatibility with many implant systems, flexibility in the selection of both therapy and design as well as high precision levels compared to conventionally produced bars [12, 18, 19]. Due to the precise adjustment of the removable secondary structure, which is also CAD/CAM-milled, CAD/CAM bars achieve rigidity levels similar to fixed restorations and ensure adequate access for hygienic purposes [20]. The production of CAD/CAM bars from a single homogeneous block prevents the risk of inclusions in addition to material expansion and shrinkage as described for cast objects and can thus reduce their complication rate [21, 22]. While conventional, mostly soldered or welded constructions often suffer from fractures at joints, deformations, screw breakage, or screw loosening, these complications are less common for CAD/CAM manufactured bars [14, 22]. Clinically, CAD/CAM-manufactured titanium bars show significantly lower distal extension and matrices fracture rates compared to gold bars manufactured with analog technologies [23]. Common reasons for failure such as corrosion, followed by corrosion fatigue of conventionally produced bars do not occur in CAD/CAM solutions [11]. CNC-milled titanium or cobalt-chrome frameworks can thus be considered an alternative to conventional castings in the edentulous jaw as they show a good clinical performance over a period of ten years [24, 25]. In vitro studies with CNC-milled implant superstructures also showed that the attainable precision of such solutions (with average gap widths between 18 and 27 μm) outperforms the accuracy of fit that can be achieved with cast precious metal frameworks [13, 26]. However, a clear definition of acceptable deviations in precision is not yet available [27]. According to the claims and promises of the suppliers, CAD/CAM-manufactured bars should be clinically usable and insertable without any manual rework. In contrast to CAD/CAM-manufactured crown- and bridge frameworks, abutments, and metal denture basis, which usually require some production-related rework or further processing in the laboratory (e.g. grinding, polishing, or veneering), CAD/CAM bars are considered “finished” or “ready-to-use” products [28]. Implant-supported CAD/CAM bars or parts are in direct contact with the oral mucosa and the peri-implant tissues. Therefore, their biocompatibility, surface free energy, material structure, shape, and surface quality impact soft tissue responses [29-31]. For optimum results, their surface morphology should promote soft tissue integration in the trans-mucosal region while minimizing plaque and bacterial retention at the same time to avoid inflammatory processes [30, 32, 33]. The relation between surface roughness and bacterial adhesion on transmucosal and submucosal structures was shown by different authors [34-36]. Studies indicate that an average roughness of Ra=0.2 μm can be regarded as threshold [36]. Surfaces that exceed this roughness threshold have an increased risk of plaque and bacteria retention [36, 37]. However, roughness in the transmucosal region should not be critically below this threshold to facilitate soft tissue integration and avoid tissue recession [38-41]. While there are numerous studies on the classification, morphology, and optimum surface roughness of the endosseous and transmucosal section of implants, no reliable information on the effect of surface quality, topography and roughness of industrially manufactured CAD/CAM bars on peri-implant soft tissue is available [42-44]. The aim of this study was therefore to characterize the surface topography of CAD/CAM bars made of cobalt-chrome or titanium supplied by different manufacturers in three defined regions of interest (ROI: transmucosal bar region, labial bar region, basal implant bar) using profilometric analysis. Furthermore, the different CAD/CAM bars were macroscopically assessed after their production by experienced dental technicians, who were to estimate the additional time required to create a clinically acceptable surface quality through manual re-polishing. The null hypothesis was that the CAD/CAM-based milling processes of implant-supported bars from different manu-facturers result in a biologically acceptable surface roughness of Ra=0.2 μm without statistically significant differences in Ra- and Sa -values, and therefore require no further manual reworking in the laboratory.
2. MATERIALS AND METHODS
For the current in vitro study, six CAD/CAM cobalt-chromium (Co-Cr) and two CAD/CAM titanium bars (Ti) from different manufacturers were examined (Table 1). All of the bars were based on a study model (Fig. 1) and were produced either in the dental laboratory or in a central production center.
| No | Place of Production | Manufacturer | Product | Material Used | Designation |
|---|---|---|---|---|---|
| 1 | Laboratory | Amann Girrbach AG | ceramill® m-bar | Co-Cr | LAC |
| 2 | Central production | BEGO® | milled bar | Co-Cr | ZBC |
| 3 | Central production | CAMLOG | DEDICAM® | Co-Cr | ZCC |
| 4 | Laboratory | DATRON® | NEM bar | Co-Cr | LDC |
| 5 | Central production | Dentsply Sirona | ATLANTIS™ ISUS | Co-Cr | ZDC |
| 6 | Central production | Zirkonzahn® | CAD/CAM bar | Co-Cr | ZZC |
| 7 | Laboratory | DATRON® | Titanium bar | Ti | LDT |
| 8 | Central production | Straumann | Createch® bar | Ti | ZST |
2.1. Master Cast and Bar Production
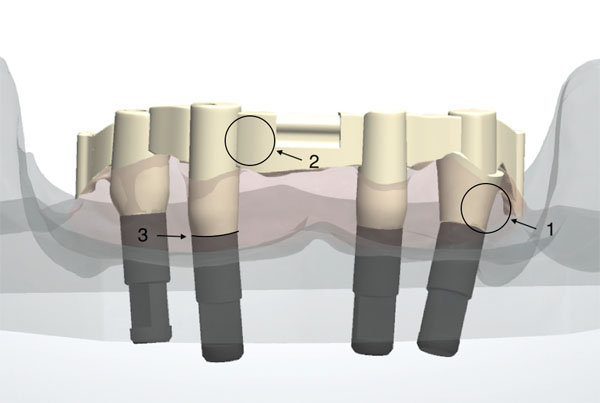
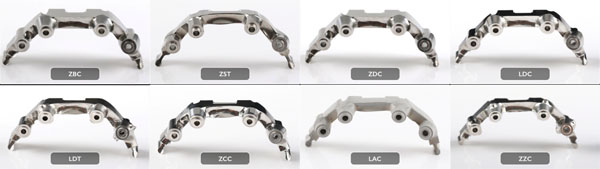
In a controlled laboratory study, a polyester resin master cast imitating an edentulous mandible was used (Z1 study model set, grey, Wichnalek e-shop, Augsburg, Germany). A tooth set-up with prefabricated acrylic teeth served to manufacture a template to guide the placement of the implants in the master cast. Four implant analogs with a diameter of 4.3 mm, a tube-in-tube connection and a flat platform (Camlog, Wimsheim, Germany) were placed and fixed with acrylic resin (GC Pattern Resin, Leuven, Belgium) in the FDI positions 34, 32, 42, and 44. For support of a one-piece bar restoration with bilateral distal extensions of 7 mm, two Preci-Vertix attachments and two distal extra coronal round precision attachments (Ceka, Hannover, Germany) were chosen. The axes of the two implants in the lateral incisors’ position were aimed in parallel and vertical alignment, whereas the two posterior implants were angulated by approximately 20° in the sagittal plane, to simulate the most common clinical surgical procedure. Impression copings for a closed tray technique (Camlog, Wimsheim, Germany) were positioned and the master cast was reproduced 8 times utilizing vinyl polysiloxane (R-SI-LINE Dublier 22, R-Dental, Hamburg, Germany) to produce sample casts. On the master cast, corresponding scan flags (Camlog, Wimsheim, Germany) were positioned and digitized. 3D printed acrylic bar frameworks (Dental SG Resin, Form 2 Desktop SLA 3D-Printer, Formlabs GmbH, Berlin, Germany), generated by means of virtual Computer-Aided Design (CAD) (3Shape D800 Scanner and CAD-Software Dental Designer, 3Shape, Copenhagen, Denmark), were sent to the respective production center for the milling procedure (CAM) together with the digital files of the CAD bars (dcm 3Shape, Copenhagen, Denmark). In order to take the individually preferred processing method of each manufacturer into account, analog and digital data of the master cast and bar framework were sent to the participating production centers. All bars were milled either locally or centrally with a Computer Numeric Controlled (CNC) 5-axis milling machine. Fig. (2) shows an overview of all manufactured bars from a basal view.
2.2. Macroscopic Assessment/Evaluation by Dental Technicians
After CAD/CAM production, eight dental technicians, with more than ten years of professional experience each, macroscopically evaluated the bars by performing a subjective visual inspection. For this purpose, high-resolution images from various perspectives were made available to them on an online platform. In order to assess the additional time a dental technician needs to spend on each of the bars prior to their clinical insertion, the dental technicians were invited to document the effort required to obtain a clinically acceptable product in a tailor-made questionnaire. Four-time intervals were available to indicate the time needed for additional manual rework and surface polishing: 0, 0-3, 3-5, and >5 hours. In addition, the overall impression of the bars’ surface quality was to be evaluated based on the grading system used in German schools (1=very good, 2=good, 3=satisfactory, 4=sufficient, 5=inadequate, 6=unsatisfactory). To reduce bias and to ensure optimum reproducibility, all examiners had two calibration sessions prior to the beginning of the evaluation. Calibration was tested by double analysis of standardized digital photographs from 7 exemplary CAD/CAM bars, other than the test samples, with a one-week interval. The interrater agreement (Cohen’s kappa) was K = 0.65, with a mean difference of 0.04 ± 0.83 (values <0.2 are considered: “poor”; values 0.21 to 0.40: “fair”; values 0.41 to 0.60: “moderate”; and values >0.60: “substantial”).
2.3. Microscopic Examination
In the course of objective microscopic analysis, the bars were examined in three critical areas or Regions Of Interest (ROI): In the transmucosal bar region, labial bar region, and basal implant bar region (Fig. 1).
2.4. Profilometric Measurement
The profilometric data were captured with a focus variation system (Infinite Focus Standard G4, Alicona Imaging GmbH, Graz, Austria). Profilometry focussed on the 3D-measurement of surface roughness in the ROIs. In order to evaluate surface roughness, the raw measurement data signals were technically edited in a first step. The surface of the bar was broken down into individual points that provided information about the surface form and its waviness. In a first step, the form was removed using a so-called F-operator, while the short-wave deviations were eliminated in a second step harnessing a low-pass filter (S-filter). With the resulting S-F surface, the form deviations and waviness, which, unlike roughness, give low-frequency signals, are removed via a special high-pass filter (L filter). The various roughness parameters could then be calculated from the resulting S-L surface. The mean roughness (Ra) and the total height were determined as amplitude parameters based on a 2D-measurement. The spatial parameters obtained from the 3D-measurement were the mean surface roughness (Sa), the maximum height of the selected surface (Sz), and the developed interfacial area ratio (Sdr). Before the actual measurement was performed, the form deviation of the selected region was reduced to one surface using a third- and fourth-order polynomial calculation (cubic and quadratic function). The Lambda C threshold wavelength was then set to 150 µm. Longer wavelengths were regarded as waviness and were filtered out with a special high-pass filter. A 20x magnification was used for all subsequent measurements. This resulted in a measurement range with a depth of 0.50 mm and a width of 0.70 mm. Three connected areas were measured per region. The segment for determining the R-value (Ra) was drawn vertically through the defined area. The S value (Sa, Sz, Sdr) were identified on the basis of the total surface comprising all individual regions.
2.5. Statistical Analysis
In order to determine statistical differences between the investigated bar constructions, the Sa and Ra values of a construction in the three regions were combined into one variable. For all independent variables (different manufac- turers), both descriptive and comparative analyzes were performed. Statistical analyses were carried out using the program packages STATISTICA (STATSOFT, Tulsa, USA, version 9.1) and BiAS (Epsilon-Verlag, Frankfurt, Germany, version 11.02). Kruskal-Wallis H-tests were used to compare independent groups for continuous variables. Tukey and Kramer's post hoc tests were applied to compare samples in pairs. Significance was set at p<0.05.
3. RESULTS
3.1. Evaluation by the Dental Technicians
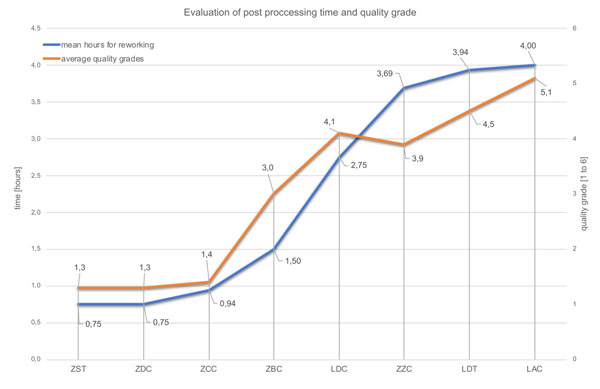
Fig. (3) and Table 2 show the outcome of the dental technicians’ analysis. Three of the bars were rated good to very good (ZDC, ZST, ZCC). This favorable evaluation is also reflected in the low estimated rework values (Table 2, Fig. 3). ZDC, ZST, and ZCC bars alone are classified by the dental technicians as needing no rework at all or requiring an estimated average up to 3 hours of rework.
| Bar |
Labial Region
Sa [µm] |
Transmucosal Region Sa [µm] | Implant-bar Interface Region Sa [µm] | Mean Value of All Regions Sa [µm] | SD Sa [µm] | Mean Reworking Time [h] | Average Quality Grades [1 to 6] |
|---|---|---|---|---|---|---|---|
| ZST | 0.17 | 0.23 | 0.36 | 0.25 | ± 0.08 | 0,75 | 1,3 |
| ZCC | 0.28 | 0.39 | 0.33 | 0.34 | ± 0.05 | 0,94 | 1,4 |
| ZDC | 0.38 | 0.33 | 0.37 | 0.36 | ± 0.02 | 0,75 | 1,3 |
| ZBC | 0.29 | 0.47 | 0.31 | 0.36 | ± 0.08 | 1,50 | 3,0 |
| LDT | 0.43 | 0.41 | 0.37 | 0.40 | ± 0.02 | 3,94 | 4,5 |
| LDC | 0.43 | 0.52 | 0.28 | 0.41 | ± 0.10 | 2,75 | 4,1 |
| ZZC | 0.61 | 0.52 | 0.26 | 0.46 | ± 0.15 | 3,69 | 3,9 |
| LAC | 1.73 | 1.82 | 1.50 | 1.68 | ± 0.14 | 4,00 | 5,1 |
3.2. Profilometric Assessment
3.2.1. Transmucosal Region
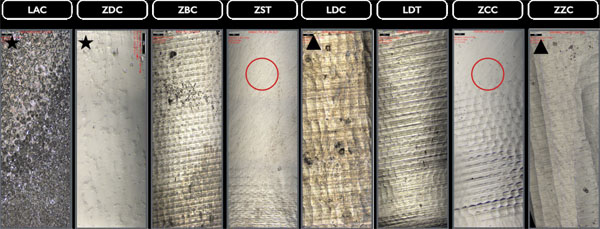
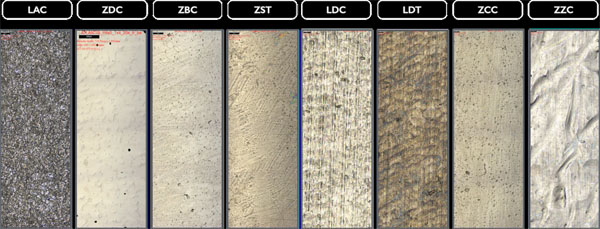
The profilometric images (20x magnification) display different processing traces and noticeable variations in the surface topography caused by milling tools in the transmucosal region with diffuse (* isotropic) structures (LAC, ZDC), irregular structures (Δ ZZC, LDC), or anisotropic structures (Fig. 4). Additionally, traces of further rework, probably caused by central manufacturer polishing, can be detected in this section for the ZCC and ZST bars.
3.2.2. Labial Region
Polishing marks in the labial regions (20x magnification) of the examined bars are even more evident. Milling marks are less significant here as only the LDC, LDT bars, and the ZZC bar show such traces (Fig. 5).
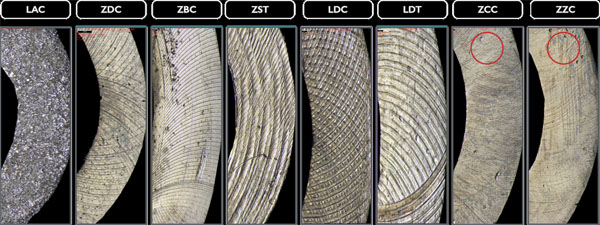
3.2.3. Basal Region
The basal implant bar regions of ZCC and ZZC show smoother sections in some places (20x magnification), the cause of which is unknown; however, they could result from polishing. All other bars seem not to have been manually reworked after the CAD/CAM manufacturing process (Fig. 6).
3.2.4. Profilometric Measurements
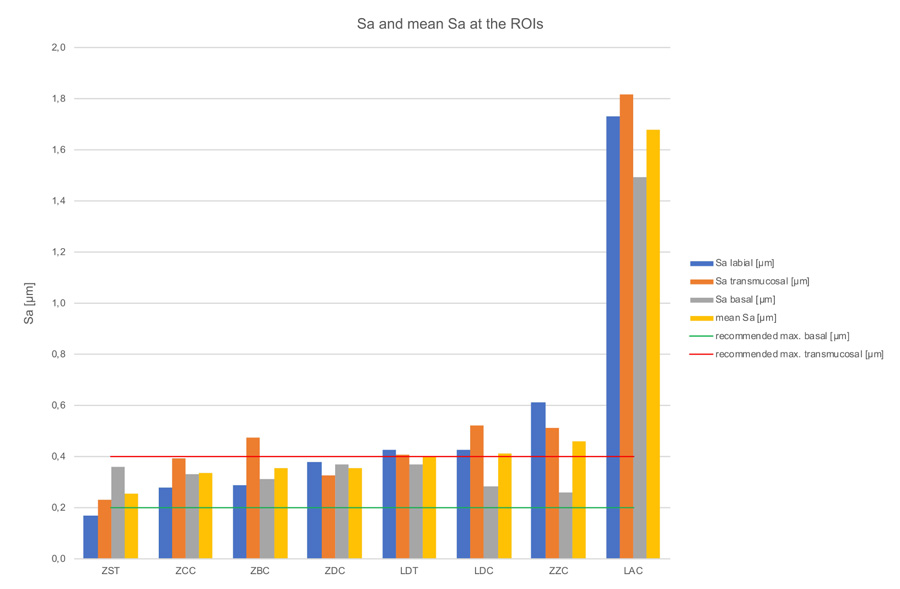
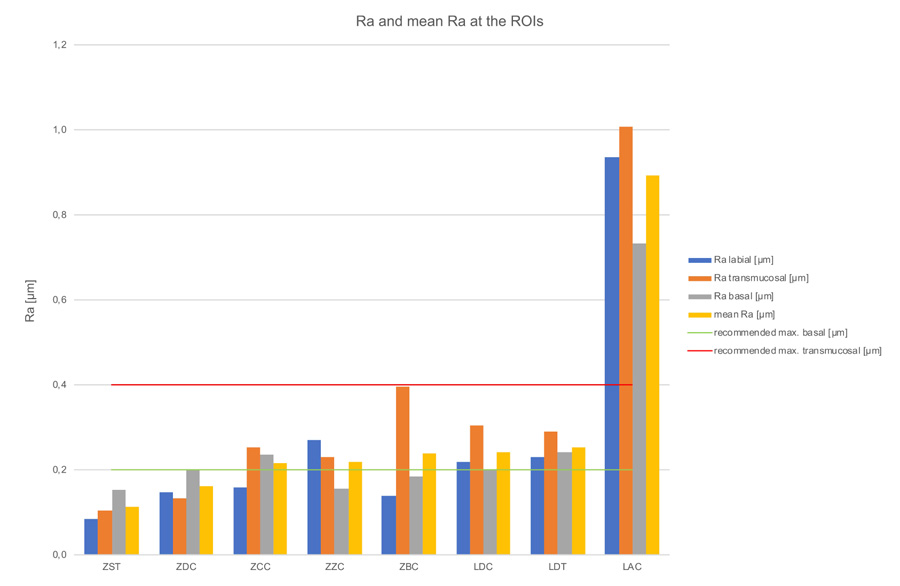
Kruskal-Wallis H-tests revealed a significant difference comparing the bar constructions over all regions of p=0.03 for Ra-values, but no significant difference for Sa-values (p=0.09) (Tables 3, 4 & 5). The subsequent post-hoc Tukey and Kramer tests for Ra-values showed a statistically significant difference (p=0.014) between the ZST and LAC groups (Table 6). Figs. 7 & 8 and Table 2, show the bars’ Sa- and Ra-values in the investigated regions, as well as the mean values with standard deviation. Furthermore, the biological acceptable limit values known from the literature are provided. Overall, the mean roughness heights of all regions (Sa/Ra) were between 0.25 µm (ZST)/0.11 µm (ZST) and 1.68 µm (LAC)/0.89 µm (LAC). Remarkably though, the roughness of the LAC bar was up to 7 times (Sa) and 8 times (Ra) higher than the ZST. If regions are compared with one another, the ZDC (SD = ± 0.02) and LDT (SD = ± 0.02) bars show comparable Sa-values for their surface roughness in all three regions, while the other specimens display a stronger Sa-value variation between the individual regions (SD = ± 0.05 - ± 0.15). Looking at the Ra-values SD was comparable for the ZDC, LDT, and ZST bar (SD = ± 0.03). This suggests different reworking methods in the various bar regions after milling.
| Bar |
Labial Region
Ra [µm] |
Transmucosal Region Ra [µm] | Implant-bar Interface Region Ra [µm] | Mean Value of all Regions Ra [µm] | SD Ra [µm] |
|---|---|---|---|---|---|
| ZST | 0.09 | 0.10 | 0.15 | 0.11 | ± 0.03 |
| ZDC | 0.15 | 0.13 | 0.20 | 0.16 | ± 0.03 |
| ZCC | 0.16 | 0.25 | 0.24 | 0.22 | ± 0.04 |
| ZZC | 0.27 | 0.23 | 0.16 | 0.22 | ± 0.05 |
| ZBC | 0.14 | 0.40 | 0.18 | 0.24 | ± 0.11 |
| LDC | 0.22 | 0.31 | 0.20 | 0.24 | ± 0.05 |
| LDT | 0.23 | 0.29 | 0.24 | 0.25 | ± 0.03 |
| LAC | 0.94 | 1.01 | 0.73 | 0.89 | ± 0.12 |
| – | Kruskal-Wallis ANOVA_; Ra (µm) (Daten.sta) | |||
|---|---|---|---|---|
| Ra (µm) | Kruskal-Wallis-Test: H (7, N= 24) =15,32000 p =,0321 | |||
| – | Code | Valid N | Ranksum | Mw. rank |
| ZST | 0 | 3 | 9,00000 | 3,00000 |
| ZDC | 1 | 3 | 19,00000 | 6,33333 |
| ZCC | 2 | 3 | 40,00000 | 13,33333 |
| ZZC | 3 | 3 | 39,00000 | 13,00000 |
| ZBC | 4 | 3 | 34,00000 | 11,33333 |
| LDC | 5 | 3 | 42,00000 | 14,00000 |
| LDT | 6 | 3 | 48,00000 | 16,00000 |
| LAC | 7 | 3 | 69,00000 | 23,00000 |
| – | Kruskal-Wallis ANOVA_; Sa (µm) (Daten.sta) | |||
|---|---|---|---|---|
| Sa (µm) | Kruskal-Wallis-Test: H (7, N= 24) =12,30868 p =,0909 | |||
| – | Code | Valid N | Ranksum | Mw. rank |
| ZST | 0 | 3 | 13,00000 | 4,33333 |
| ZDC | 1 | 3 | 32,50000 | 10,83333 |
| ZCC | 2 | 3 | 27,00000 | 9,00000 |
| ZZC | 3 | 3 | 43,00000 | 14,33333 |
| ZBC | 4 | 3 | 31,00000 | 10,33333 |
| LDC | 5 | 3 | 42,00000 | 14,00000 |
| LDT | 6 | 3 | 42,50000 | 14,16667 |
| LAC | 7 | 3 | 69,00000 | 23,00000 |
| – | Multiple comparison p-value (2-sided); Ra (µm) (Daten.sta) | |||||||
|---|---|---|---|---|---|---|---|---|
| Ra (µm) | Kruskal-Wallis-Test: H (7, N= 24) =15,32000 p =,0321 | |||||||
| – | ZST | ZDC | ZCC | ZZC | ZBC | LDC | LDT | LAC |
| ZST | – | n.s. | n.s. | n.s. | n.s. | n.s. | n.s. | ** |
| ZDC | 1,000000 | – | n.s. | n.s. | n.s. | n.s. | n.s. | n.s. |
| ZCC | 1,000000 | 1,000000 | – | n.s. | n.s. | n.s. | n.s. | n.s. |
| ZZC | 1,000000 | 1,000000 | 1,000000 | – | n.s. | n.s. | n.s. | n.s. |
| ZBC | 1,000000 | 1,000000 | 1,000000 | 1,000000 | – | n.s. | n.s. | n.s. |
| LDC | 1,000000 | 1,000000 | 1,000000 | 1,000000 | 1,000000 | – | n.s. | n.s. |
| LDT | 0,681615 | 1,000000 | 1,000000 | 1,000000 | 1,000000 | 1,000000 | – | n.s. |
| LAC | 0,014896 | 0,108988 | 1,000000 | 1,000000 | 1,000000 | 1,000000 | 1,000000 | – |
4. DISCUSSION
4.1. Macroscopic Assessment
All examined bars were ordered from the manufacturers as CAD/CAM superstructures (complete CAD/CAM products). Although the STL data or scan models from CAD planning made available to the suppliers for computer-aided manufacturing (CAM) were based on the very same case, the subjective macroscopic assessment carried out by the dental technicians already showed clear differences. The centrally manufactured products, i.e. ZDC (grade Ø=1.3), ZST (grade Ø=1.3), and ZCC (grade Ø=1.4), rendered the best results in terms of both the subjective quality assessment and the estimated rework effort. The worst results may be found in the LDC, LDT (grade Ø=4.1; 4.5) and LAC (grade Ø=5.1) bars, which were produced in laboratories. The high manual rework effort required in some instances for laboratory-manufactured CAD/CAM bars as well as the capital expenditure to purchase the necessary milling machines raise doubts about the efficient employment of this laboratory technology for bar restorations. The results of the present study show that bars which were milled by implant manufacturers at central locations have a clinically adequate surface morphology and require only a little or no rework at all.
4.2. Profilometry
Seven of the mean roughness values (Sa) from all measurements of this study correspond to the definition of a smooth implant surface according to Wennerberg and Albrektsson (Sa=0.0-0.4 µm), a generally valid definition of topographic properties on the endosseous surface [45]. They classified implant surfaces with Sa values of 0.0-0.4 µm as smooth, 0.5-1.0 μm as minimally rough while considering Sa values between 1–2 μm as moderately rough and Sa values above 2 μm as rough. In contrast, however, the LAC bar was in the moderately rough surface range with an average Sa value of 1.68 μm. However, as other biological requirements are placed on bars due to their function, this classification, which was developed and is frequently cited for implants, is only of limited use here. In 2003, the same team of authors published an article dealing with the characterization of implant abutments which are closer to bars from a functional point of view [42]. They showed increased plaque attachment on abutments with roughness values of 0.26 µm-1.87 µm (Sa) compared to those with Sa values of 1.0 µm and 1.9 µm [42]. Concerning the bars examined here, this means that at least the bar supplied by LAC (Sa>1 µm) could be exposed to this increased clinical risk. In contrast to the results of Wennerberg et al., Quirynen et al. identified biofilm differences (up to 25 times the amount) with abutments of different roughness levels (Ra=0.35 µm and Ra=0.81 µm), which can be traced back to a longer observation period [42, 46]. So far, plaque accumulation in the subgingival area could not be completely attributed to roughness. Nevertheless, it can be assumed that the texture (roughness) of a surface gives an indication of its intraoral, clinical behavior, especially if it is monitored in vivo over a longer period of time. Considering the standard deviations from all three measurements, the LAC (1.68±0.14 µm), ZZC (0.46±0.15 µm), and LDC (0.41±0.10 µm) bars show the largest variation within the ROIs. Sawase et al. measured Sa values of 0.15-0.24 µm and Scx values of 7.76-10.22 µm in different commercially available abutments and attributed this outcome to different production processes such as milling, polishing, cleaning, and oxidizing [47]. The roughness values at the bars’ transmucosal region measured in the present study also show an up to eight-fold variation (Sa=0.23-1.82 µm), which could be attributed to the different production standards. As a rule, the surface topography is assessed based on the parameters of form, waviness, and roughness, with the form, also referred to as profile, representing the harshest and roughest type of unevenness. Waviness and roughness are often considered together as texture [30]. The accuracy of such a roughness measurement depends on the extent to which errors affecting the form and waviness parameters can be filtered out [48] However, there is still no generally accepted standard for where the roughness parameter for dental materials ends and the one for waviness begins. For abutments, Gehrke et al. suggest an Sa value between 0.21 µm and 0.4 µm for optimum soft tissue integration (transmucosal region) [49]. The bars provided by ZST (Sa=0.23 µm), ZDC (Sa=0.33 µm), and ZCC (Sa=0.39 µm) are within this range and, according to this study, offer optimum surface properties for transmucosal integration. All other specimens fail to meet the limit value and therefore could be exposed to the risk of increased plaque attachment. Rimondini et al. (1997) could show that average height deviations of 0.088 µm or less-polished titanium surfaces inhibit the accumulation and growth of plaque [50]. Quirynen et al. were also able to show that the surface roughness of an abutment is directly related to plaque attachment and that this early colonization is difficult to remove and favors further accumulation [46]. Oftentimes an Ra value of ≤0.2 µm is regarded as the biologically acceptable limit value for minimum plaque attachment [34, 36]. Assuming this Ra-value is appropriate, of all bars investigated in the present study the ZST bar (Ra=0.09 µm), ZDC (Ra=0.15µm), and the ZCC (Ra=0.16µm) were below this threshold value in the labial region. All other examined bars had higher values. In order to minimize increased plaque attachment and the resulting increased prosthetic aftercare during recall, these bars should be reworked and polished manually. The null hypothesis that the CAD/CAM-based milling processes of different manufacturers result in biologically acceptable surface roughness, without significant differences in Ra- and Sa-values, can be therefore partially rejected. It should be noted that the Sa-values characterize the surface in three dimensions and therefore cannot be directly compared with Ra-values. Height parameters based on average Sa-values do not contain any information about the frequency of the height changes and, as a consequence, different topographies may result in the same Sa-values. Hybrid or distance parameters, however, can be quite relevant in vivo [51].
4.2.1. Micro-Gap
Manufacturing and surface finishing processes have a decisive influence on the roughness of implant connection components [52]. Fernández et al. 2014 could show that surface irregularities are closely related to the prevalence of a micro-gap between the respective implant components [53]. They examined milled, sintered, and cast Co-Cr abutments regarding the repercussions of roughness on the micro-gap and were able to establish a significant correlation between both parameters. The Sz-values of milled abutments (29 µm) and the corresponding gap (Mg=0.73 µm) were significantly different from sintered (Sz=115 µm / Mg=11.3 µm) and cast abutments (Sz=98 µm/Mg=9.09 µm). Micro-gaps are largely made responsible for implant prosthetic complications as well as for bacterial infiltration [54]. The Sz-values measured in the bar-implant transition area in the current study were between 6.05 µm for the ZDC bar and 23.41 µm for the LAC bar and were thus within the range of commercially milled abutments.
CONCLUSION
Within the limits of this in vitro study, the following conclusions can be drawn:
- The differences identified in this study in terms of both the macro and micro geometry of CAD/CAM-milled bars supplied by different manufacturers provide initial indications of their potential in vivo behavior as well as of the applied production and milling processes.
- In the transmucosal region the ZDC (0.33 µm), ZST (0.23 µm), and ZCC bars (0.39 µm) exhibited Sa roughness values within the acceptable bandwidth (Sa 0.2-0.4 µm). With regard to the Ra-roughness values, the bars manufactured by ZZC (0.23 µm), ZCC (0.25 µm), LDT (0.29 µm), LDC (0.31 µm), and ZBC (0.4 µm) are within the acceptable range and thus offer optimum conditions for the adaptation of peri-implant soft tissue.
- In the intraoral area, only the ZST bar displayed an optimum Sa-value (0.17 µm), preventing plaque accumulation, while the ZST (0.09 µm), ZBC (0.14 µm), ZDC (0.15 µm), and ZCC bars (0.16 µm) achieve optimum Ra-values. All other examined bars would have to be reworked and/or polished manually to meet this crucial threshold value.
- The dental technicians’ assessment of the quality and the rework required for the examined CAD/CAM bars confirms the sequence of their topographic ranking (ZDC, ZST, ZCC) resulting from the profilometric measurements.
- To the best of the authors’ knowledge, this is the first study that deals with the characterization of CAD/ CAM-manufactured bars with the aid of profilometric data. In order to fully characterize the surface pro-perties of CAD/CAM-manufactured bars and to assess their in vivo behavior, further profilometric studies involving bars of this kind are desirable.
- Clinical studies using profilometric data could help further improve the surface quality of CAD/CAM-manufactured products, as well as reduce necessary manual rework times and the concomitant effort. Polishing marks in the ROIs of some of the investigated bars suggest that the manufacturers are also aware of this fact.
- Clear thresholds for the clinical acceptance and nomenclature of transmucosal CAD/CAM-generated surfaces are desirable.
- The null hypothesis can be regarded as rejected, as the CAD/CAM bars examined in this pilot study showed different surface characteristics and roughness levels, resulting from their individual milling processes.
- The comparison of roughness values, as well as a re-commendation of standards based on that comparison, are hampered by an inconsistent usage of Sa and Ra-values in the literature.
ETHICS APPROVAL AND CONSENT TO PARTICIPATE
Not applicable
HUMAN AND ANIMAL RIGHTS
No animals/humans were used for studies that are the basis of this research.
CONSENT FOR PUBLICATION
Not applicable.
AVAILABILITY OF DATA AND MATERIALS:
The datasets used and/or analysed during the current study can be provided by the corresponding author on reasonable request.
FUNDING
None.
CONFLICT OF INTEREST
The authors declare no conflict of interest, financial or otherwise.
ACKNOWLEDGEMENTS
The authors wish to thank Joachim Rudert for his support in the translation of this paper.

