All published articles of this journal are available on ScienceDirect.
The Chemical and Morphological Study of Calcium Silicate-Based Material (Biodentine®) and Glass Ionomer Cement (GIC®)
Abstract
Background:
Attention was paid to the chemical properties of bioactive materials, and the reaction that could occur on their surface.
Objective:
The evaluation of the chemical properties includes the solubility, water sorption, pH changes and calcium release of two dental materials (BD and GIC). In addition, the morphological structure of each material was studied after its immersion in two different solutions, i.e. deionized water and phosphate solution.
Methods:
The chemical study was carried out for two sets of samples; 28 samples of each material. Samples were immersed in 10 mL of deionized water and stored at 37 °C for different times. The morphological structure and elemental analysis of BD and GIC samples were studied after immersion in the two solutions for 1, 7, 14 and 28 days.
Results:
Solubility of BD increased with time reaching a maximum value after 60 days (13.63 ± 2.08%). The solubility of GIC was negatively correlated with time, with a maximum value of 4.11 ± 0.47% for 3 h. The released Ca+2 ions varied between 1.0 ± 0.3 mg (3 h) and 5.3 ± 0.8 mg (60 days) for BD. However, calcium was not detected in the GIC samples. The formation of calcium hydroxy-fluorapatites and strontium-fluoro-alumino-silicate, on the surface of BD and GIC, respectively, was clarified for the first time in this study.
Conclusion:
A comparative study was carried out revealing the difference in the chemical properties and the morphological structure between the two studied materials. The results confirmed the biointeractivity and the bioactivity of BD and GIC.
1. INTRODUCTION
Calcium Silicate based Materials (CSMs) have several indications of use in endodontics and their potential clinical applications have gained popularity in recent years. The CSMs seem to have essential properties tailored for their
clinical use such as the good sealing correlated to expansion, the ability to set in the presence of fluids, bioactivity and the release of ions acting as epigenetic signals [1-4].
Glass Ionomer Cements (GIC) are widely used in clinical dentistry as cementing fixed prosthesis [5]. In clinical use, the main advantage of GIC is its anticaries action attributed to the release of fluoride ions. In addition, the hydrophilic nature of GIC and its ability to bind with the tooth structure are important [5-9].
Recently, various CSMs have been launched to the market. Biodentine (BD), commercially available in 2009 (Septodont, Saint-Maur-des-Fossés, France), has a special focus due to its ability to be designated as a fast setting dentine replacement material, with high compressive strength [4, 10, 11].
Biodentine mainly contains tri-calcium and di-calcium silicate, zirconium oxide, and calcium carbonate, with a liquid containing calcium chloride and a water-soluble polymer [2, 12].
Biodentine has a wide range of applications including endodontic repair (root perforations, apexification, resorptive lesions, and retrograde filling material in endodontic surgery) and pulp capping material [2, 13].
In most clinical applications, CSMs encounter blood and/or infectious conditions, humidity and acidic media, while these materials are undergoing hydration and maturation. Therefore, data about the effect of these environmental conditions on the chemical compounds and hydration process of these cements are of clinical significance. Solubility is one of the most important factors in evaluating the quality of CSMs to be used as bases, liners, luting agents, and restorations [14-16].
In addition, it is crucial for CSMs to have some specific bioproperties like biocompatibility, biointeractivity (ion releasing) and bioactivity (apatite-forming ability), in order to promote the pulp cell activity and the formation of a new reparative dentin [12, 17-20].
Biodentine and GIC, as cement-based materials, are both used in the indirect pulp capping, and have the ability to initiate the formation of dentinal bridge. Therefore, the aim of the present research was to study the physiochemical, biointeractivity, and bioactivity properties of BD and GIC. In addition, the morphological structure of BD and GIC was studied after immersion for different times in two different solutions, i. e. deionized water and phosphate solution.
The following null hypothesis was tested: There is no difference in the chemical properties and morphological structure of Biodentine and glass ionomer cement.
2. MATERIALS AND METHODS
2.1. Materials
BiodentineTM (Septodont, Saint-Maur-des-Fossés, France) and Glass Ionomer Cement (GC-Fuji®-Japan) were used in the research. All samples prepared in the present work were prepared according to the manufacturer’s instructions. All other chemicals used in this work were of analytical grade (Sigma-Aldrich Chemie Gmbh, Munich, Germany), and used without further purification.
2.2. Chemical Analysis
The chemical study including the solubility rate, pH changes, water sorption and calcium release was carried out for two sets of samples, 28 samples of each material. After mixing, samples were prepared using cylindrical plastic molds; 3.0 mm diameter and 4.0 mm height. The plastic mold was removed after 15 minutes, and each sample was immersed in 10 mL of deionized water in polypropylene sealed tubes and stored at 37 °C for different time i.e. 3h, 1, 7, 14, 28, 45 and 60 days. All experiments were carried out in quadruplicate.
The soaking water was collected at the planned time and analyzed for pH and Ca content. The concentration of Ca was determined using an Atomic Absorption Spectrophotometer (AAS-Perkin-Elmer 2380). The pH values were measured using a pH-meter (Inolab-pH 730).
The quality of Ca2+ ions analysis was checked with internal certified samples, and procedural blanks were run with samples in a similar way for quality assurance of the laboratory analysis. The accuracy of analysis was ± 5%. Standard solutions of Ca2+ from Fisher Scientific® were analyzed in the same manner for analysis accuracy check, and errors were less than 5%.
At each time interval, the Solubility (S) and Water Sorption (WS) percentages were calculated according to the following equation:
 |
(1) |
 |
(2) |
Where W0 is the initial weight of the sample; W1 is the weight of the water-saturated sample; W2 is the final weight of sample after drying at 37 °C for 24 h.
Each weight measurement was repeated 3 times using an analytical balance (Sartorius-CP225D) and determined to the nearest 0.0001 g.
2.3. Morphological Study
Cubic specimens (2×2×3 mm) of BD and GIC were prepared and immersed in two different solutions; deionized water and phosphate solution (1.0 mM NaH2PO4) for 1, 7, 14 and 28 days at 37°C and 100% humidity. The morphological study was investigated using a Scanning Electron Microscope (SEM) (Tescan Vega II XMU, USA) operated at 20kV. The elemental analysis of the surface of each studied sample was carried out using the Scanning Electron Microscope with Energy Dispersive X-ray spectroscopy (SEM-EDX).
2.4. Statistical Study
Difference between BD and GIC groups was analyzed by Student’s t-test, followed by One Way ANOVA, and the Pearson correlation coefficients were calculated for the correlation studies with SPSS 13.0 Windows program. A p-value of 0.05 was considered for statistical significance.
3. RESULTS
The chemical properties of BD and GIC, including solubility, Ca released, pH changes and water sorption were studied at different time intervals. The descriptive data are presented in Table 1.
| WS | Solubility | - | Time | ||||||
|---|---|---|---|---|---|---|---|---|---|
| Max. | Min. | SD | Mean | Max. | Min. | SD | Mean | ||
| 8.35 | 6.97 | 0.60 | 7.82 | 5.80 | 4.98 | 0.34 | 5.35 | BD | 3 h |
| 7.13 | 5.26 | 0.87 | 5.84 | 4.73 | 3.60 | 0.47 | 4.11 | GIC | |
| 6.27 | 4.74 | 0.63 | 5.57 | 3.87 | 3.31 | 0.24 | 3.63 | BD | 1 day |
| 4.53 | 3.53 | 0.51 | 4.05 | 2.75 | 2.29 | 0.20 | 2.49 | GIC | |
| 4.82 | 2.61 | 0.93 | 3.54 | 4.00 | 3.04 | 0.41 | 3.43 | BD | 7 days |
| 3.35 | 2.76 | 0.26 | 2.98 | 1.65 | 0.88 | 0.32 | 1.26 | GIC | |
| 4.23 | 3.23 | 0.42 | 3.78 | 4.29 | 2.20 | 0.90 | 3.04 | BD | 14 days |
| 4.52 | 3.30 | 0.54 | 3.82 | 1.08 | 0.76 | 0.14 | 0.98 | GIC | |
| 6.96 | 5.89 | 0.44 | 6.46 | 6.16 | 3.75 | 0.99 | 4.87 | BD | 28 days |
| 4.73 | 3.36 | 0.62 | 4.06 | 0.40 | 0.20 | 0.09 | 0.28 | GIC | |
| 9.69 | 6.02 | 1.51 | 8.01 | 9.33 | 7.11 | 1.05 | 8.59 | BD | 45 days |
| 4.42 | 3.06 | 0.65 | 3.68 | 0.46 | 0.31 | 0.06 | 0.40 | GIC | |
| 15.58 | 8.41 | 3.27 | 10.96 | 16.03 | 12.42 | 1.70 | 13.63 | BD | 60 days |
| 5.33 | 3.51 | 0.81 | 4.28 | 0.37 | 0.24 | 0.06 | 0.29 | GIC | |
| Ca released | pH | - | Time | ||||||
| Max. | Min. | SD | Mean | Max. | Min. | SD | Mean | ||
| 1.32 | 0.73 | 0.29 | 1.02 | 10.6 | 10.4 | 0.10 | 10.48 | BD | 3 h |
| >LoD | 6.2 | 5.9 | 0.13 | 6.05 | GIC | ||||
| 1.09 | 0.73 | 0.18 | 0.89 | 10.9 | 9.8 | 0.50 | 10.23 | BD | 1 day |
| >LoD | 5.3 | 5.1 | 0.08 | 5.20 | GIC | ||||
| 2.41 | 1.78 | 0.33 | 2.04 | 11.1 | 10.5 | 0.27 | 10.70 | BD | 7 days |
| >LoD | 6.3 | 3.1 | 1.42 | 4.45 | GIC | ||||
| 2.38 | 2.06 | 0.17 | 2.20 | 11.5 | 10.7 | 0.33 | 11.08 | BD | 14 days |
| >LoD | 7.0 | 6.9 | 0.29 | 6.63 | GIC | ||||
| 3.58 | 2.87 | 0.37 | 3.16 | 11.8 | 10.6 | 0.51 | 11.08 | BD | 28 days |
| >LoD | 6.7 | 6.0 | 0.30 | 6.28 | GIC | ||||
| 4.39 | 3.94 | 0.24 | 4.21 | 11.7 | 11.6 | 0.05 | 11.68 | BD | 45 days |
| >LoD | 6.1 | 6.0 | 0.05 | 6.08 | GIC | ||||
| 5.77 | 4.44 | 0.76 | 5.32 | 11.9 | 11.0 | 0.41 | 11.30 | BD | 60 days |
| >LoD | 7.0 | 6.0 | 0.44 | 6.35 | GIC | ||||
The comparison of the chemical properties for BD and GIC, showed that there were significant differences between BD and GIC properties (p < 0.05), except WS for 1 and 2 weeks (Table 2). The null hypothesis was rejected, and the chemical properties of the tow-studied materials are statistically different.
| P value | Standard Deviation | Mean difference | Degrees of freedom | t value | Time interval | - |
|---|---|---|---|---|---|---|
| 0.005 | 0.29 | 1.24 | 6 | 4.257 | 3 h | Solubility % |
| 0.000 | 0.15 | 1.14 | 6 | 7.383 | 1 day | |
| 0.000 | 0.26 | 2.18 | 6 | 8.391 | 7 days | |
| 0.004 | 0.46 | 2.06 | 6 | 4.516 | 14 days | |
| 0.000 | 0.50 | 4.59 | 6 | 9.225 | 28 days | |
| 0.000 | 0.52 | 8.19 | 6 | 15.640 | 45 days | |
| 0.000 | 0.85 | 13.34 | 6 | 15.671 | 60 days | |
| 0.0097 | 0.53 | 1.98 | 6 | 3.733 | 3 h | Water sorption % |
| 0.0096 | 0.41 | 1.52 | 6 | 3.745 | 1 day | |
| 0.292 | 0.48 | 0.56 | 6 | 1.155 | 7 days | |
| 0.918 | 0.34 | -0.04 | 6 | -0.108 | 14 days | |
| 0.001 | 0.38 | 2.40 | 6 | 6.289 | 28 days | |
| 0.002 | 0.82 | 4.34 | 6 | 5.266 | 45 days | |
| 0.007 | 1.68 | 6.68 | 6 | 3.966 | 60 days | |
| 0.000 | 0.08 | 4.43 | 6 | 55.062 | 3 h | pH |
| 0.000 | 0.25 | 5.03 | 6 | 19.870 | 1 day | |
| 0.000 | 0.73 | 6.25 | 6 | 8.619 | 7 days | |
| 0.000 | 0.22 | 4.45 | 6 | 20.329 | 14 days | |
| 0.000 | 0.30 | 4.80 | 6 | 16.188 | 28 days | |
| 0.000 | 0.04 | 5.60 | 6 | 158.392 | 45 days | |
| 0.000 | 0.30 | 4.95 | 6 | 16.424 | 60 days |
It is worth noting that the solubility and WS values of BD samples were higher than those of GIC samples.
The ANOVA analysis showed significant differences in the chemical properties over time, for both materials, (Table 3).
| P value | f value | Used material | - | |
|---|---|---|---|---|
| 0.000 | 66.715 | Biodentine | Solubility % | |
| 0.000 | 142.683 | GIC | ||
| 0.000 | 12.741 | Biodentine | Water sorption % | |
| 0.000 | 7.498 | GIC | ||
| 0.000 | 7.974 | Biodentine | pH | |
| 0.000 | 6.745 | GIC | ||
| 0.000 | 54.753 | Biodentine | Ca release (mg) | |
A positive correlation was noted between the solubility of BD and the time intervals, r = 0.861 (0.000), with a maximum value after 60 days (13.63 ± 2.08%), (Table 1). Compared with solubility values of 1, 7, 14 and 28 days of experiments, a relatively high value was noted for BD after 3 hours (5.35 ± 0.42%).
The solubility of GIC was negatively correlated with time, r = -0.740 (0.000), (Table 4), where a clear decrease of the solubility values was noted, with a maximum value 4.11 ± 0.47% for 3h. However, for the experiments of 28, 45 and 60 days, the solubility value was less than 1.0%, (Table 1).
| pH | Time | WS | Solubility | - |
|---|---|---|---|---|
| - | - | - | 1.000 | Solubility |
| - | - | 1.000 | 0.594(0.001) | WS |
| - | 1.000 | -0.143(0.469) | -0.740(0.000) | Time |
| 1.000 | 0.388(0.041) | 0.306(0.113) | -0.225(0.250) | pH |
For BD, the released Ca+2 ions varied between 1.0 ± 0.3 mg (3 h) and 5.3 ± 0.8 mg (60 days), (Table 1), with a positive correlation with solubility, r = 0.827 (0.000), and time intervals, r = 0.861 (0.000), (Table 5).
| Ca released | pH | Time | WS | Solubility | - |
|---|---|---|---|---|---|
| - | - | - | - | 1.000 | Solubility |
| - | - | - | 1.000 | (0.000)0.861 | WS |
| - | - | 1.000 | 0.637(0.000) | (0.000)0.861 | Time |
| - | 1.000 | 0.712(0.000) | 0.289(0.136) | 0.502(0.007) | pH |
| 1.000 | 0.703(0.000) | 0.970(0.000) | 0.588(0.005) | 0.827(0.000) | Ca released |
The quantity of Ca+2 ions released from GIC was very limited and less than the LoD (Limit of detection = 0.01 mg L-1).
A significant increase was noted in the pH values of BD samples, and ranged from 10.2-11.7, (Table 1).
A relative high WS % was noted for 3h experiment, with a clear decrease of WS% until 14 days. Samples were less affected after 28 days, with a slight increase of WS %, (Table 1).
The maximum percentage of WS % for the GIC samples was noted for 3h experiment (5.84 ± 0.87%). The WS% was slightly decreased for 1 and 7 days and reached a plateau after 14 days ranging between 3.68 ± 0.65% and 4.28 ± 0.81% for 14 and 60 days experiments, respectively, (Table 1).
3.1. SEM Study
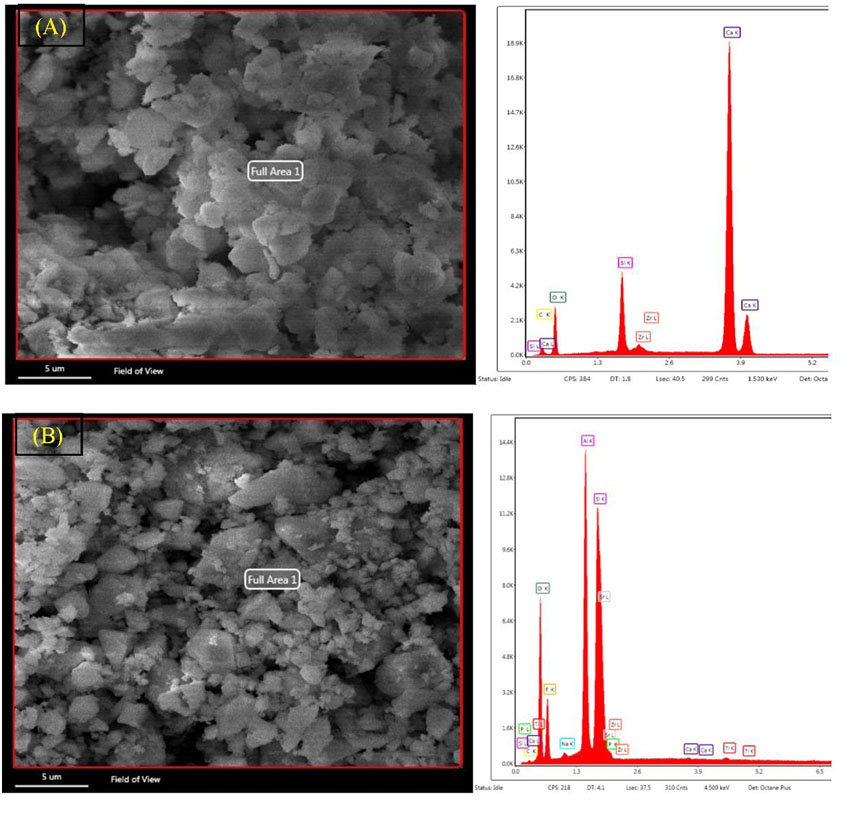
The SEM-EDX study was performed for the un-hydrated powder of BD and GIC without any pretreatment. As shown in Fig. (1), BD is mainly composed of oxygen, silicon and calcium, with a minor content of zirconium. GIC is mainly composed of oxygen, silicon, fluoride, aluminum and strontium, with a minor content of strontium and minimal proportions of sodium, phosphorous, calcium, zirconium and titanium.
The morphological structure of BD and GIC was studied for each material after being immersed in deionized water and phosphate solution, for different immersion time as the following:
3.1.1. One Day
The morphological structure of BD and GIC was clearly different after one day for both cases (deionized water and phosphate solution) (Fig. 2). In deionized water, clear morphological changes have appeared in the BD samples, where the reacted regions of the surface were found as spherical rims. The EDX analysis confirmed that these rims are mainly composed of Ca(OH)2, with a minor content of carbon and nitrogen (4.8 ± 0.5 and 2.9 ± 0.4 wt %, respectively) probably resulting from the polyamino-carboxylates that could be presented in BD as a dispersant and water reducer. As shown in Fig. (1), sulfur was not detected in the powder of BD, however, a minor amount of S was found on the surface of mixed samples indicating the possible presence of calcium sulfate in the BD. In phosphate solution, BD showed a different morphology with needle-like crystals of Ca(OH)2. In addition, the EDX results revealed the presence of fluoride in BD samples in both solutions with weight percentages 2.0 ± 0.5% and 0.7 ± 0.3% (mean ± SD), in deionized water and phosphate solutions, respectively.
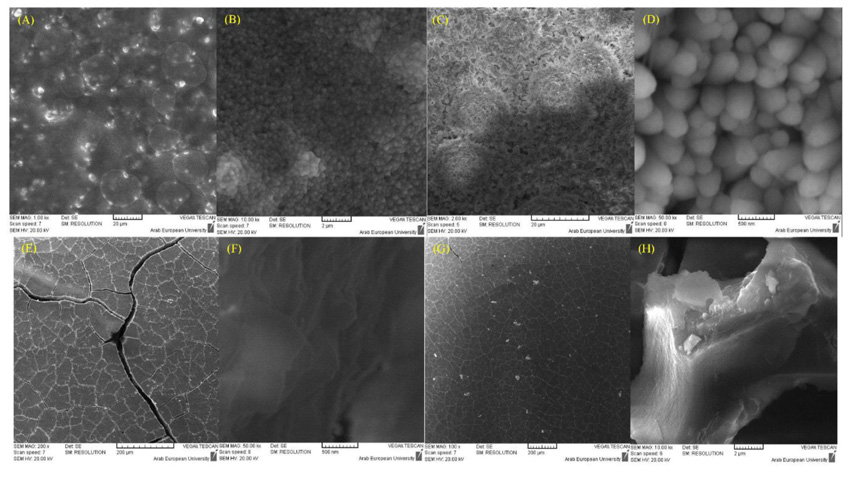
The EDX results revealed a high percentage of carbon, which results from the polymeric structure formed on the GIC surface. In addition, the Si was found in GIC samples of deionized water (8.9 ± 6.5%) and those of phosphate solution (18.4 ± 2.0%). The higher percentage of Si in GIC samples in phosphate solution could reveal the higher reactivity (faster hydration of silicates) in this media compared to the deionized water.
3.1.2. Seven Days
After 7 days, the hydration reaction was more effective on the morphological structure of the studied samples. Different structures were found in BD and GIC samples, which mainly related to the difference of the composition of each material.
For BD, a mixed surface was found in both tests; deionized water and phosphate solution. The EDX results confirmed that the surface is mainly composed of Ca(OH)2, Calcium Silicate Hydrated (C-S-H), and ettringite (hydrous calcium aluminum sulfate), (Fig. 3). It is worth noting that fluoride is also measured in the surface of BD from deionized water samples with a weight percentage of 2.1 ± 0.8%. However, fluoride was not detected in BD samples from the phosphate solution.
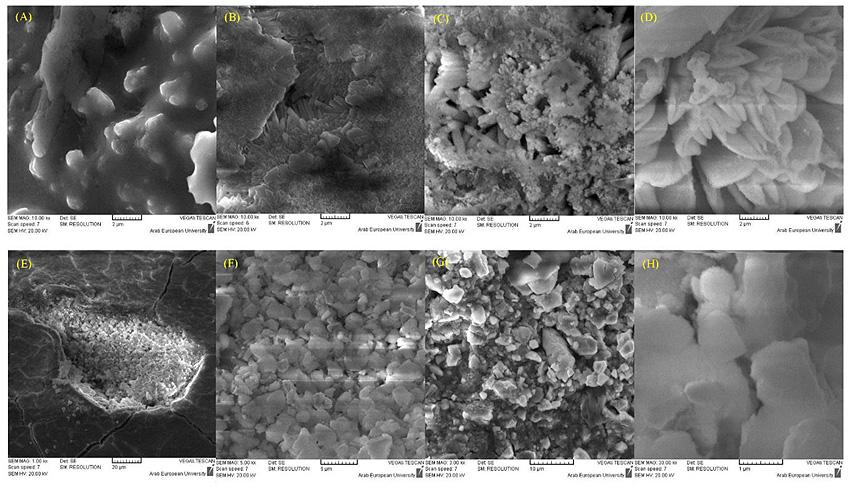
The morphology of GIC samples in both solutions was a little different, with a flattened surface.
The surface of BD samples was clearly modified due to the exposure to the air for 24 h. Snowflake crystals appeared on a compact layer of C-S-H (Fig. 4), which mainly composed of CaCO3 resulting from the carbonation of Ca(OH)2. These results could confirm the necessity to use a bond material over the BD when the latter is used as a temporary restorative.
The GIC was less reactive in deionized water than in phosphate solution. It was observed that the crystals of the GIC samples in phosphate solution contained finer particles compared to samples in deionized water (Fig. 5).

3.1.3. Fourteen Days
The morphological structure of the surface of BD samples after 14 days was not significantly different from that of 7 days experiment, (Fig. 6). The EDX results confirmed that the upper surface of BD samples in both the solutions was fully covered by Ca(OH)2.
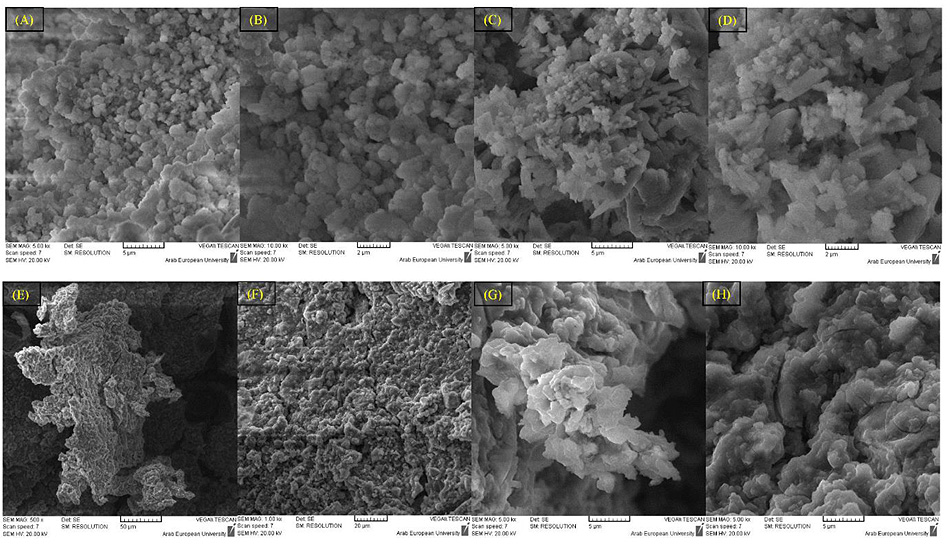
For GIC samples, the polymeric structure seems to be more compact, especially samples from the phosphate solution. However, the EDX results showed a close composition of all samples in both solutions, and confirmed the formation of fluoro-alumino-silicate.
3.1.4. Twenty-eight Days
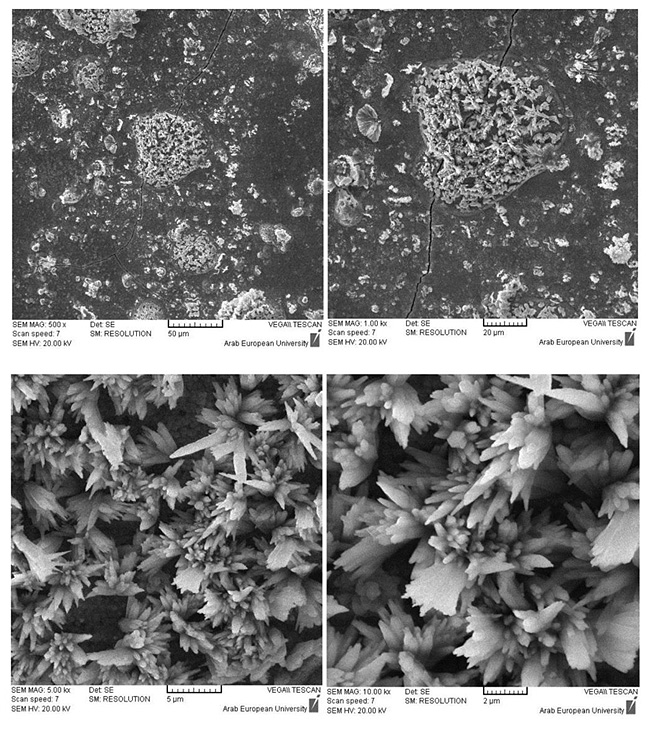
After 28 days, the surface of BD samples in water was mainly a solidified cement covered by Ca(OH)2 (Fig. 7). On the other hand, the apatite was clearly seen in the reacted rims on the surface of BD samples in phosphate solution (Fig. 8). This is an expected result from BD based on the manufacturer recommendation. However, the EDX confirmed that the crystals found on the surface are mainly hydroxyapatite with an impurity of fluoride (2.74 ± 0.35 wt %), (Fig. 9).
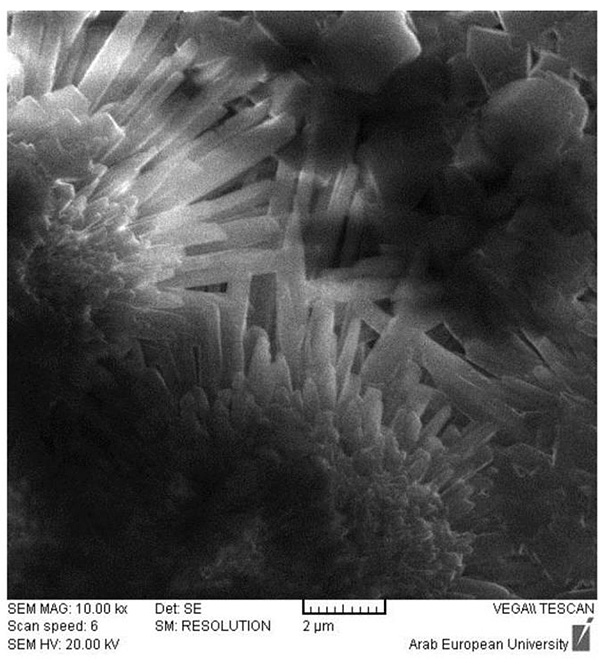
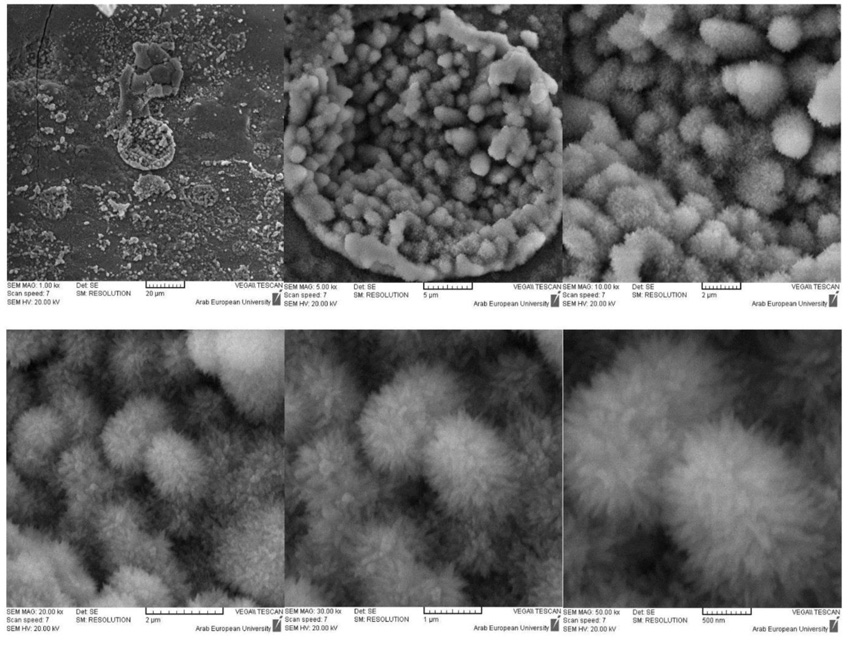
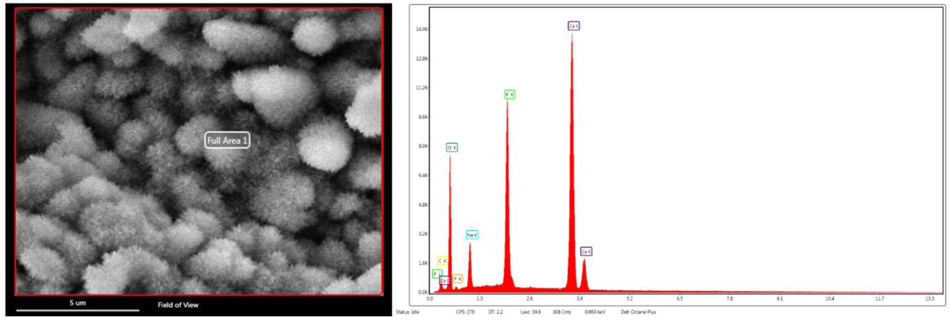
The chemical calculation of the EDX results revealed the following:
- The formed apatite on the BD surface in phosphate solution is mainly a calcium hydroxy-fluorapatites (OH-FAps),
- The most probable formula of the formed apatite is Ca10(PO4)6(OH)2-xFx, where x=1.5.
As previously mentioned, the GIC was less reactive in deionized water than in phosphate solution, (Figs. 10 & 11). The comparison of the SEM/EDX results for the GIC samples in deionized water and phosphate solution showed the following:
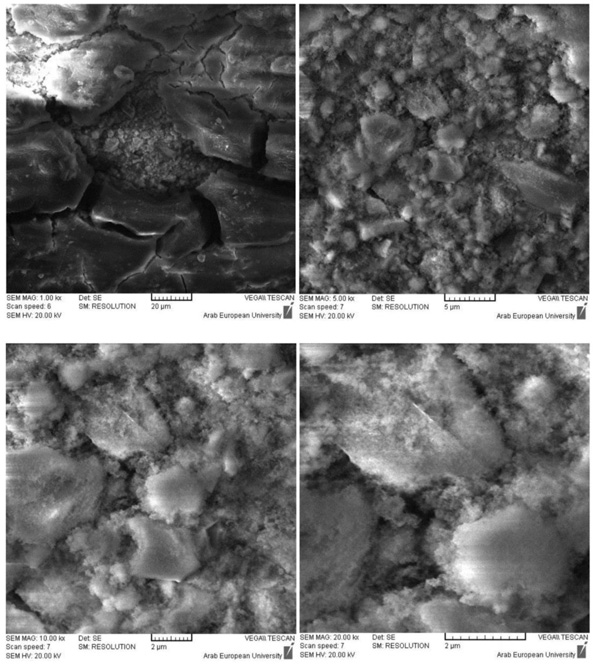
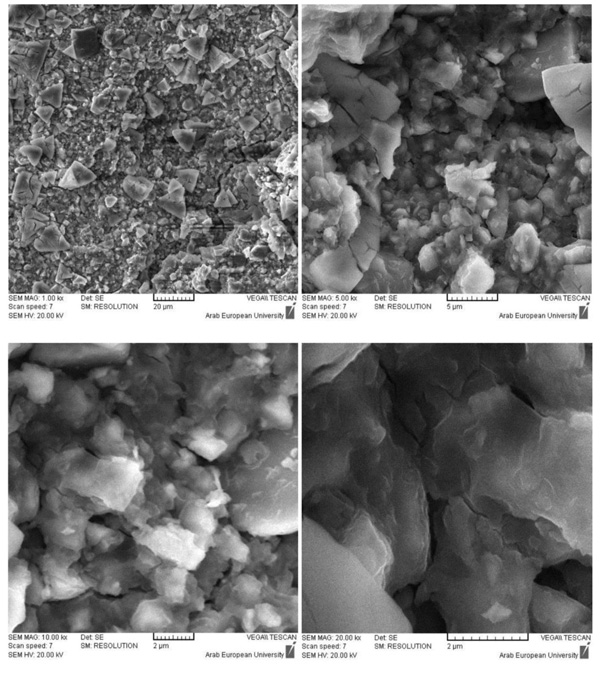
- The fluoro-alumino-silicate was found in some rims on the surface of GIC samples immersed in water,
- The fluoro-alumino-silicate were found on the whole surface of GIC samples immersed in a phosphate solution,
- In both solutions, the main inorganic crystals are most probably the strontium-fluoro-alumino-silicate.
4. DISCUSSION
The chemical properties of BD and GIC were studied and statistically analyzed. Results showed that there was a significant difference between the properties of both materials. This difference is mainly attributed to the difference in their composition [21]. The solubility and WS values of BD at the different time intervals were higher than those of GIC. In addition, increased quantities of Ca were released over time for BD samples, but no Ca was detected in GIC samples. For BD samples, a fast and continuous increase of the pH values was noted, keeping the sample in alkaline media. This high alkalinity is mainly related to the hydration of calcium silicate, which releases calcium, hydroxyl, and silicate ions.
The release of carboxylic ions from the GIC samples can explain the decrease of the pH value, especially in the early stage of hydration. However, the release of several ions, i.e. fluorine, aluminum, silicate, sodium, phosphate, and calcium, in the acidic medium is associated with buffering effect. In other words, the pH value increases with elapsed time, which explains the increase in the pH value after 14, 28, 45 and 60 days. Similar results were reported in the literature about the increase of pH values over time, with a maximum value of 5.9 [22].
The trend of BD's solubility results was mostly consistent with those reported in the literature, with a different reported maximum solubility values, i. e. 6.8% (1 day) [21], 11.9% (1 day) (18), 3.7% (3 days) [23], 4.1% (28 days) [24], 4.6% (28 days) [23], 4.0% (30 days) [25], 7.0% (60 days) [25].
The high solubility values of GIC in the early stage of hydration can be justified based on the high water-sensitivity of GIC during this period [26]. Similar results were reported in the literature, where the solubility of GIC ranged from 2.76% (1 day) to 3.96% (60 days) [25]. The difference between the mean values of GIC simples in the present study and those from the literature are simply related to the difference in the experimental conditions.
Water is the main component in the hydration of cement-based materials. Therefore, the relatively high values of WS % for BD and GIC samples are reasonable. However, the WS values after 28 days for BD samples were higher than those of GIC samples. This behavior is mainly due to the increase over time of the non-evaporable water within the tri-calcium silicates contained in BD. In addition, water is less required in GIC samples after the complete polymerization of the organic phase, which explains the little variation of WS % over time, especially after 14 days.
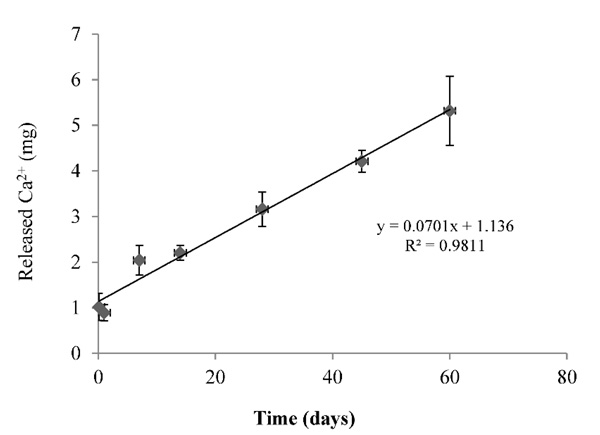
A linear correlation was observed between the total calcium released and the experiment time, with a linear correlation coefficient (R2 = 0.9811) (Fig. 12). The linear correlation equation of type (Y = aX+b) indicates a zero value (b = 1.136), which indicates a large amount of calcium released during the first few minutes of the immersion. This can be mainly attributed to the high solubility of calcium carbonate (CaCO3) due to its reaction with calcium chloride (CaCl2), with a limited solubility of di-calcium (C2S) and tri-calcium (C3S) silicates [1, 19, 21, 27, 28].
This behavior can be explained by the electrostatic interaction between the different charge grains, which leads to the aggregation of grains leading to the retention of water between them. The special water reducers used in the BD matrix contribute in the neutralization of some of these charges, which leads to the water desorption and making the surface looks more fluid after setting
Results clarified that the hydro-soluble polymer is an important contributor to the solubility percentage during the early stages of experiments. This was confirmed by the increase of the released calcium, with a continuous decrease of solubility for 1, 7 and 14 days of experiments. A similar theory was suggested by Paillere [29], who cited that the high solubility in the first stage is attributed to the presence of hydro-soluble polymer in the liquid component of BD, which may disperse the cement by applying a charge on the surface of particles leading to higher dissolution [29, 30].
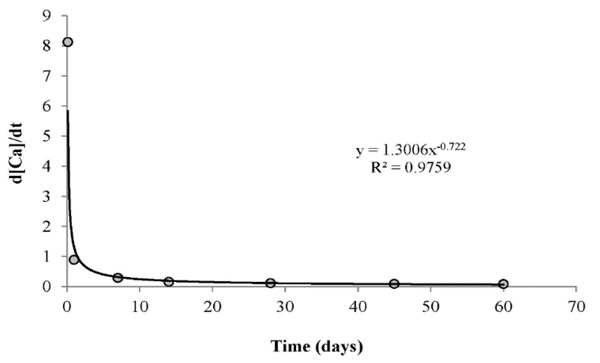
For better understanding, the hydration mechanism of BD, the relationship between the released Ca2+ ions content and the experiment time was studied, and presented in Fig. (13). The variant d[Ca]/dt represents the dissolution rate of BD. Results showed a high dissolution rate of 8.1 mg day-1 during the first few hours of immersion. However, a rapid decrease to less than 1.0 mg day-1 was noted in all experiments for more than one day. This can confirm that the main source of Ca2+ ions in the first period is the solubility of CaCO3 rather than calcium silicates. On the other hand, this approach can present an indicator of the high Ca2+release during the first hours, but it is still limited to determine the real dissolution rate of BD due to the saturation of medium, and the continuous precipitation of Ca(OH)2/hydroxyapatite in the medium.
4.1. Morphological Study
The morphological structure and chemical composition of BD and GIC were studied using SEM/EDX. The chemical composition of un-hydrated BD and GIC were consistent with those reported in the literature. For BD, other elements were reported in the previous studies i.e. iron, magnesium and aluminum [19].
The morphological structures of BD and GIC were clearly different according to the immersion solution (deionized water and phosphate solution). In addition, BD and GIC were more reactive in phosphate solution than in deionized water.
EDX results revealed the presence of fluoride in BD samples in both solutions, and more clearly in deionized water. The literature survey showed that most of the research articles did not reveal the presence of fluoride in BD [3, 10, 17, 19, 24, 31]. However, Gandolfi, et al., [18] reported the measurement of fluoride in the un-hydrated powder of BD (0.11 wt %).
Fluoride was not detected in BD samples from the phosphate solution, which can be mainly due to the higher reactivity of BD in this media, and the complexity of the resulted materials from the hydration reaction.
The high biointeractivity of BD (ion release) and apparent porosity with wide reacted rims on the surface could confirm the high solubility results and the dissolution of its surface with the formation of C-S-H and Ca(OH)2, with a continuous release of Ca2+ and OH- ions.
The morphological structure of the reacted rims on the GIC surface is closely similar to those reported in the literature of the calcium-fluoro-alumino-silicate glass [32]. The EDX analysis confirmed the formation of fluoro-alumino-silicate glass on the surface of all samples within a clear polymeric structure.
The comparison of the SEM/EDX results for the GIC samples revealed that the main inorganic crystals on the surface of GIC samples in both solutions are most probably the strontium-fluoro-alumino-silicate.
Results confirmed the formation of apatite on the BD surface after 28 days of immersion in a phosphate solution, which is mainly a calcium hydroxy-fluorapatites (OH-FAps), with the most probable formula Ca10(PO4)6(OH)2-xFx, where x=1.5.
Most morphological studies in the literature focused on one point study; 7 days [33] or 14 days [11] or 28 days [31]. This can limit the interpretation of the obtained results in these studies. The obtained results confirmed the necessity to make multi-points researches concerning the morphological and chemical composition changes of any new materials.
CONCLUSION
The chemical properties (solubility, water sorption, pH changes and calcium release), and the morphological structure of BD and GIC were studied after their immersion in two different solutions, i.e. deionized water and phosphate solution. A significant difference in the chemical properties of BD and GIC was noted with a different reactivity in solution.
After 28 days, solubility and water sorption values of Biodentine samples are higher than those of GIC samples. However, Biodentine as a based-cement silicate can be more favorable in use due to its ability to maintain an alkaline medium.
Calcium hydroxy-fluorapatites and strontium-fluoro-alumino-silicate were identified on the surface of BD and GIC, respectively, after 28 days of immersion in phosphate solution.
The biointeractivity (ion-releasing) and the bioactivity (apatite-forming) of BD and GIC were confirmed.
ETHICS APPROVAL AND CONSENT TO PARTICIPATE
Not applicable.
HUMAN AND ANIMAL RIGHTS
No animals/humans were used for studies that are the basis of this research.
CONSENT FOR PUBLICATION
Not applicable
CONFLICT OF INTEREST
The authors declare no conflict of interest, financial or otherwise.
ACKNOWLEDGEMENTS
Declared none.


