All published articles of this journal are available on ScienceDirect.

Dental and Chronological Ages as Determinants of Peak Growth Period and Its Relationship with Dental Calcification Stages
Abstract
Purpose:
To investigate the relationship between dental, chronological, and cervical vertebral maturation growth in the peak growth period, as well as to study the association between the dental calcification phases and the skeletal maturity stages during the same growth period.
Methods:
Subjects were selected from orthodontic pre-treatment cohorts consisting of 420 subjects where 255 were identified and enrolled into the study, comprising 145 girls and 110 boys. The lateral cephalometric and panoramic radiographs were examined from the archives of the Department of Orthodontics, Aristotle University of Thessaloniki, Greece. Dental age was assessed according to the method of Demirjian, and skeletal maturation according to the Cervical Vertebral Maturation Method. Statistical elaboration included Spearman Brown formula, descriptive statistics, Pearson’s correlation coefficient and regression analysis, paired samples t-test, and Spearman’s rho correlation coefficient.
Results:
Chronological and dental age showed a high correlation for both gender(r =0.741 for boys, r = 0.770 for girls, p<0.001). The strongest correlation was for the CVM Stage IV for both males (r=0.554) and females (r=0.68). The lowest correlation was for the CVM Stage III in males (r=0.433, p<0.001) and for the CVM Stage II in females (r=0.393, p>0.001). The t-test revealed statistically significant differences between these variables (p<0.001) during the peak period. A statistically significant correlation (p<0.001) between tooth calcification and CVM stages was determined. The second molars showed the highest correlation with CVM stages (CVMS) (r= 0.65 for boys, r = 0.72 for girls).
Conclusion:
Dental age was more advanced than chronological for both boys and girls for all CVMS. During the peak period these differences were more pronounced. Moreover, all correlations between skeletal and dental stages were statistically significant. The second molars showed the highest correlation whereas the canines showed the lowest correlation for both gender.
1. INTRODUCTION
The clinical importance of evaluating skeletal maturation has long been recognized by orthodontists. However, timing of growth events is quite variable among individuals [1-3]. Many biological indicators have been assessed for evaluating developmental age including increase in body height or weight [4-6], skeletal maturation of hand-wrist [7-9], cervical vertebrae [10-13], and dental development [14-17]. Skeletal maturation assessed on hand-wrist radiographs is classically considered the best indicator of maturity and it has been found to be closely related to the growth spurt. However, because of the additional radiographic exposure needed, this diagnostic tool has evoked more concern in recent years.
Modifications in size and shape of the cervical vertebrae in growing subjects have gained interest as a biologic indicator of individual skeletal maturity [11, 18]. Cervical vertebral maturation describes the entire pubertal growth period by covering all significant phases in craniofacial growth during adolescence and young adulthood, and it is valid for both gender [10-13]. More importantly, it requires no additional x-ray exposure beyond the routine lateral cephalometric projection.

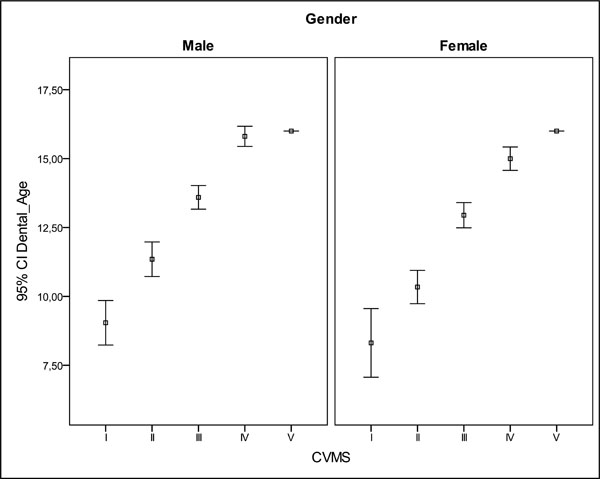
Means and 95% confidence intervals of the chronological age related to CVMS.
Dental maturity can be determined by the stage of tooth eruption or the stage of tooth formation. Tooth eruption is unreliable because many factors such as space available, ankylosis, and early or delayed exfoliation of primary teeth alter the eruption of the permanent successors [19, 20]. Various radiological methods have been proposed to estimate tooth formation based on the degree of calcification of the permanent teeth [21, 22]. Even if most of them show good validity, they use the unknown final length of the root as an indicator of dental age [23]. One of the most widely applied methods for ascertaining dental age is the Demirjian eight-stage system [24].This method is based on a dental age scoring system on objective criteria and relative values rather than onabsolute lengths. Considering mean differences between estimated dental ages and chronological ages [25-28] meta-analyses reveal the need to develop different estimation calculations based on local population characteristics in order to obtain accurate estimations of dental age [29].
Studies on the correlation of dental maturity described on the basis of mineralization of the entire dentition, usually produced low or no correlation coefficients between dental and skeletal age, regardless of the method of skeletal age assessment [30, 31]. In contrast, studying selected teeth rather than the whole dentition provides higher correlation coefficients between dental and skeletal maturity because the probability of accidental errors will be decreased [32-35]. The calcification stages of canines, premolars, and second molars were recommended because their maturation occurs in the pubertal growth period [32, 33, 36]. Incisors and first molars developed before the onset of the pubertal growth spurt [34] while the third molars develop after this period [37].The aims of this study were (1) to investigate the relationship between dental age, chronological age, and cervical vertebral maturation (CVM) during the peak growth period of Greek individuals and (2) to assess any relationship between the stages of calcification of canines, premolars and second molars and CVM during the same period.
2. MATERIALS AND METHODS
2.1. Participants
Four hundred twenty consecutive complete patient files from the archive of the Department of Orthodontics, Aristotle University of Thessaloniki, Greece, were initially reviewed and obtained from the database including the signed informed consent of the corresponding patients regarding research use of their data. All radiographs were taken using the same device (Orthoceph Siemens, Munich, Germany).A final sample of 255 subjects consisting of 145 females (age range: 8.12-18.00 years; mean age: 12.12 years) and 110 males (age range: 8.24-16.60 years; mean age: 12.18 years) were selected. Assuming that chronological and dental age have a bivariate normal distribution, with N=255 participants and alpha=0.05, the power of a two sided test that the Pearson correlation between chronological and dental age is at least 0.3, is 99% (software G*Power 3.1.9.2). Lateral cephalometric and panoramic radiographs were examined from the archives of the Department of Orthodontics. In total, 510 radiographs (255 lateral cephalometric X-rays and 255 panoramic radiographs) of the patients were evaluated. Subjects were selected according to the following inclusion criteria:
- Greek ethnicity;
- Chronological age between 8 and 18 years;
- Panoramic and lateral cephalometric radiographs available with high clarity, good contrast, and time interval less than one month between the two radiographs;
- No systemic diseases or craniofacial anomalies, history of trauma or injury to the face, or previous orthodontic treatment;
- Normal dental conditions (e.g., no impaction, transposition, congenitally missing or extraction of any permanent teeth).
2.2. Assessment of Skeletal Maturity
The morphology of the second, third, and fourth cervical vertebrae was evaluated twice by the first author placing the lateral cephalometric radiograph on a conventional negatoscope (X-RAY Co., Amityville, NY, USA). The three cervical vertebrae were traced using acetate paper. Skeletal maturation of each lateral cephalometric radiograph was determined according to the CVM method [11] (Table 1).
2.3. Assessment of Dental Age
To evaluate dental age [24] each panoramic radiograph was assessed by the first author placing the film on a conventional negatoscope. The radiographs were traced using acetate paper and the developmental stage of the individual teeth were ascertained (Table 2). Themandibular left central incisor, lateral incisor, canine, first and second premolars, and first and second molars were evaluated for dental age assessment using the Demirjian method. Each stage was assigned a numeric value taken from tables prepared separately for boys and girls. The values obtained were summed up and this indicated the dental age of each individual. However, in order to investigate the relationships between the stages of tooth calcification and pubertal CVM stages, mandibular incisors and first molars were not rated because apical closure had already taken place. The teeth examined were thus the mandibular canines, the first and second premolars, and the second molars.
The CVMS method for the assessment of skeletal maturity (Baccetti et al., 2002).
| CVMS I | The lower borders of the vertebrae are flat, with the possible exception of a concavity at the lower border of C2. Occurs at least 1 year before the pubertal growth spurt. |
| CVMS II | Concavities of both C2 and C3 are present. The peak in mandibular growth will occur during the year after this stage. Marks the ascending portion of the pubertal growth spurt. |
| CVMS III | The bodies of both C3 and C4 are rectangular horizontal. The peak in mandibular growth has occurred within 1 or 2 years before this stage. Marks the descending portion of the pubertal growth spurt. |
| CVMS IV | At least one of the bodies of C3 or C4 is square. The peak in mandibular growth has ended at least 1 year before this stage. Marks the end of the pubertal growth spurt period. |
| CVMS V | At least one of the bodies of C3 or C4 is rectangular vertical. If not rectangular vertical, the body of the other cervical vertebra is squared. The peak in mandibular growth has ended at least 2 year before this stage. |
2.4. Data Analysis
The overall analysis was conducted with the SPSS statistical software, version 19.0 (SPSS Inc, Chicago, IL, USA) at the 5% level of significance. The normality assumption was tested with the Shapiro-Wilk statistic, and figures with mean and 95% confidence intervals were also presented. Levene’s test of equality of variances was used to test the homogeneity assumption. Intra-observer method error was investigated by re-evaluating 30 lateral cephalometric X-rays and panoramic radiographs at the end of the initial investigation. To evaluate the reproducibility of the interpretation, the first and second skeletal and dental maturity assessments were tested using a Spearman Brown formula. Descriptive statistics were calculated for each type of age (chronological and dental) of the patients regarding both gender and CVM stage. Pearson’s correlation coefficient and regression analysis were used to estimate the association between chronological and dental ages regarding gender and pubertal growth. Paired samples t-test was used to compare the means between chronological and dental age measures regarding gender and pubertal growth period. Association between CVM stages and dental development stages taking into account both gender and type of tooth was estimated by Spearman’s rho correlation coefficient. To study any direct relationship between the seven stages of tooth calcification and skeletal maturation, the percentage distribution of the stages of calcification for each tooth in CVM stages was calculated, taking gender into account.
The eight stages of tooth calcification (Demirjian et al., 1973).
| A: Cusp tips are calcified but without fusion. |
| B: Calcified cusps are united so the occlusal surface is recognizable. |
| C: 1) Enamel formation has been completed at the occlusal surface. 2) Dentine formation has commenced. 3) The pulp chamber is curved. |
| D: 1) Crown formation has been completed to the level of the amelocemental junction. 2) The pulp chamber in the uniradicular teethhas a curved form. In the molars the pulp chamber has a trapezoid form. 3) Root formation has commenced. |
| E: 1) The walls of the pulp chamber are straight and the pulp horns have become more differentiated. In molars, the radicular bifurcation has commenced to calcify. 2) The root length is less than the crown height. |
| F: 1) The walls of the pulp chamber now form an isosceles triangle. In molars, the bifurcation has developed sufficiently to give the roots a distinct form with a funnel shaped endings. 2) The root length is equal to or greater than the crown height. |
| G: The walls of the root canal are parallel and its apical end is still partially open. |
| H: 1) The root apex is completely closed. 2) The periodontal membrane surrounding the root and apex is uniform in width throughout. |
RESULTS
The reproducibility of all the measurements was found to have high coefficient values. The coefficient of reliability was found to be .98 for the dental calcification stage assessments and .99 for the skeletal maturity assessments.
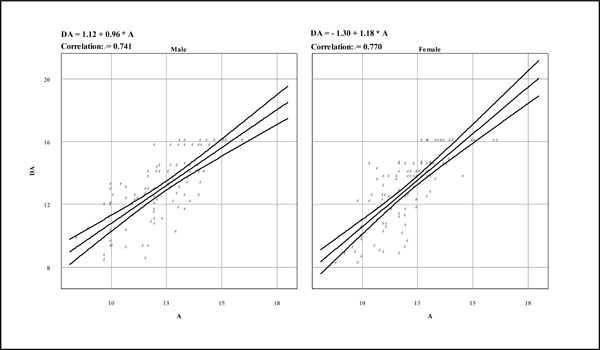
Correlation of chronological with dental age separate for males and females during the overall growth period.
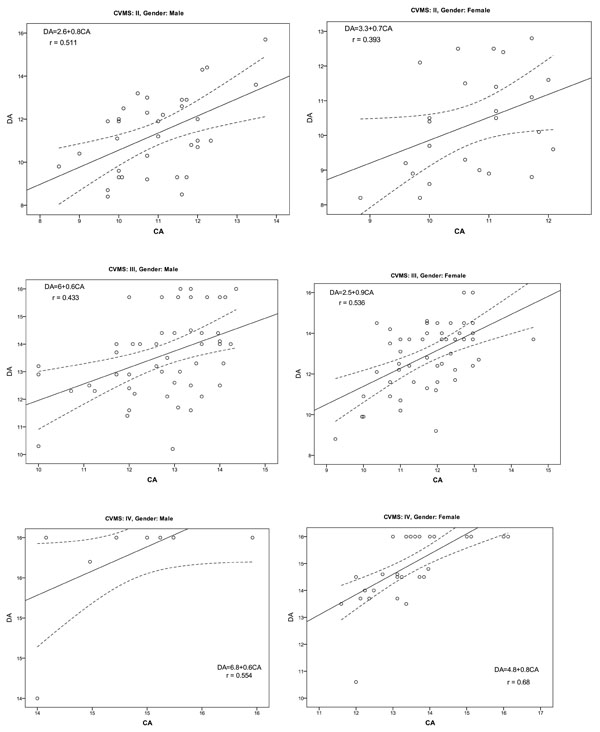
The number, corresponding chronological and dental ages for each CVM stage, for both females and males, are shown in Table 3. As skeletal maturation increased, chronological and dental ages increased accordingly (Figs. 1 and 2). Regarding gender, a consistently earlier occurrence for each skeletal maturation stage was observed for females. In the overall growth period, chronological and dental ages showed an overall high correlation for both boys (r =0.741, p<0.001) and girls (r = 0.770, p<0.001) (Fig. 3, Table 4).The strongest correlation was observed in patients with CVM Stage IV, both in males (r=0.554) and females (r=0.68).The lowest correlation was for CVM Stage III in males (r=0.433, p<0.001) and CVM Stage II in females (r=0.052, p>0.001) (Fig. 4). Paired samples t-test showed a statistically significant advanced dental age compared with chronological age for both boys (0.55 ± 1.46, p<0.001) and girls (0.78 ± 1.41, p<0.001) for all CVM stages. Apparently, around the peak growth period (CVMS II - CVMS IV), these differences were more pronounced (Table 5). Dental age accelerated by 0.68 ± 1.43 years in males (p<0.001) and 0.93 ± 1.46 years in females (p<0.001). Spearman rank order correlation coefficients between the CVM stages and the calcification stages of the four individual teeth are shown in Table 6. The second molars showed the highest and the canines the lowest correlation, respectively (p<0.001).
At CVM Stage II (Table 7), the most frequently observed dental development stages for both sexes were stages F and G for canines and premolars, respectively.
Descriptive statistics for chronological and dental age corresponding to all CVM stages regarding gender.
| CVMS | Males | ||||||||
|---|---|---|---|---|---|---|---|---|---|
| Chronological Age | Dental Age | ||||||||
| N | Min – Max | Median | Mean ± SD | Std. Error of Mean | Min - Max | Median | Mean ± SD | Std. Error of Mean | |
| I | 7 | 8.24 - 11.84 | 10.00 | 10.06 ± 1.40 | 0.53 | 8.00 - 10.40 | 9.20 | 9.04 ± 0.87 | 0.33 |
| II | 35 | 8.48 - 13.72 | 11.00 | 10.99 ± 1.17 | 0.20 | 8.40 - 15.70 | 11.20 | 11.35 ± 1.82 | 0.31 |
| III | 51 | 10.00 - 14.36 | 13.00 | 12.74 ± 1.11 | 0.16 | 10.20 - 16.00 | 13.50 | 13.59 ± 1.52 | 0.21 |
| IV | 13 | 11.96 - 15.96 | 15.00 | 14.65 ± 0.95 | 0.26 | 14.00 - 16.00 | 16.00 | 15.81 ± 0.58 | 0.17 |
| V | 4 | 15.00 - 16.60 | 16.00 | 15.90 ± 0.66 | 0.33 | 16.00 - 16.00 | 16.00 | 16.00 ± 0.00 | 0.00 |
| Total | 110 | 8.24 - 16.60 | 12.18 | 12.36 ± 1.82 | 0.17 | 8.00 - 16.00 | 12.90 | 12.91 ± 2.34 | 0.22 |
At CVM Stage III most of the subjects exhibited almost complete mandibular canine development. The first premolars were close to reaching their final stage for both sexes, while in most of our subjects, the second molars remained in stage G.
At CVM Stage IV more than 90% of the subjects exhibited completed canine and first premolar development. Regarding the second molars, only half (51.4%) of females and 76.9% of males reached stage H, respectively.
DISCUSSION
This study investigated the interrelationship between chronological and dental ages of a group of Greek children. The method used [24] has been used extensively for assessing dental maturation and DA [32, 33, 35]. The DA scoring system is based on the shape and proportion of root length, using its relative value to crown height rather than its absolute length. Thus, the panoramic distortions of the developing teeth will not affect the reliability of estimation [32]. An overall significant difference was found between chronological age (CA) and dental age (DA) in Greek individuals. On average, the Greek boys and girls were ahead of the French-Canadian children previously analyzed [24]. The secular trend in growth and development in the past decades and the ethnic disparity between Greek and French-Canadian children could be an explanation for the estimated differences [29, 38]. Even though it is easy to use and is a highly reproducible method, the eight calcification stages that describe the developing tooth are based on discernible tooth formation changes rather than dividing tooth formation into equal time intervals. This means that the times taken for a tooth to develop from one stage to the next are not identical, affecting the accuracy of age estimation. Although this sample consisted of Caucasian population, there is definitely a need for further investigation using a larger sample of Greek children in order to reach stronger conclusions.
Skeletal maturity was assessed by the CVMS method, consisting of five maturity stages defined by means of visual evaluation of the morphology of three cervical vertebrae (C2, C3, and C4) [11]. According to the present findings, skeletal maturity increased together with the increase of chronological and dental ages. The appearance of each skeletal stage is consistently earlier in females than in males. Regarding CVM stage, dental age in males tended to be more advanced than that in females. These findings are in agreement with previous investigations [14, 32, 33]. In spite of the overall high correlation coefficients between chronological and dental ages in the overall CVMS growth period, the lowest correlation was observed for CVMS III in males and CVMS II in females. Moreover, the t-test reveals statistical significant differences between these parameters around the peak growth period (CVMS II - CVMS IV). Considering that CVMS II marks the ascending portion and the CVMS III the descending portion of the growth spurt neither chronological age nor dental age seem to be reliable in the identification of the pubertal growth phase, which are the most important developmental stages to be identified in orthodontic treatment planning. Therefore, precise information about the timing of the onset of the growth spurt with the relevant clinical implications is not provided by these indices.
Apart from correlations between dental age and CVM stages, correlations between development of individual teeth and skeletal maturity stages were calculated. Calcification stages of canines, premolars, and second molars, because their maturation occurs during the pubertal growth period, were evaluated. From the present findings in Greek children, the correlation coefficients between CVMS and calcification stages of four individual teeth were high, ranging from 0.49 to 0.65 for males (p<0.001) and 0.53 to 0.72 for females (p<0.001) confirming previous investigations irrespective of the method of skeletal age assessment [17, 32-36].The strongest relationship between dental and skeletal development involved the second molars. The second molar offers an advantage over other teeth because its development tends to continue over a longer period and until a later age [27, 28, 36].
Correlation of chronological with dental age separate for males and females around the growth peak period.
Differences between chronological and dental age (t-test).
| CVMS | Male | Female | ||||
|---|---|---|---|---|---|---|
| N | Dental-Chronological Age | p | N | Dental-Chronological Age | p | |
| I | 7 | -1.01 ± 1.38 | 8 | -0.60 ± 1.15 | ||
| II | 35 | 0.36 ± 1.59 | 0.193 | 25 | -0.38 ± 1.38 | 0.176 |
| III | 51 | 0.85 ± 1.45 | <0.001 | 54 | 1.19 ± 1.42 | <0.001 |
| IV | 13 | 0.94 ± 0.52 | 0.004 | 35 | 1.47 ± 0.95 | <0.001 |
| V | 4 | 0.10 ± 0.66 | 23 | 0.54 ± 0.94 | ||
| Total | 110 | 0.55 ± 1.46 | <0.001 | 145 | 0.78 ± 1.41 | <0.001 |
| II- IV | 0.68 ± 1.43 | <0.001 | 0.93±1.46 | <0.001 |
For a better understanding of the relationship between CVM indices and dental age during the pubertal growth period, percentage distributions of the studied teeth were also calculated. At CVM stage II, which represents the ascending portion of the pubertal growth spurt, most of the canines and first premolars in both attained root formation from stage F to stage G [32-34] whereas at CVM stage III, most of the canines of both sexes and 74.5% of the boys’ first premolars attained complete root formation [32-36].In this data, the second molar stage G commenced markedly at CVMS III for both sexes.
Spearman’s rho correlation coefficients between CVM and dental development stages.
| Tooth | Correlation coefficients | |||
|---|---|---|---|---|
| Males | Females | |||
| r | p-value | r | p-value | |
| M2 | 0.65 | p<0.001 | 0.72 | p<0.001 |
| P2 | 0.59 | p<0.001 | 0.63 | p<0.001 |
| P1 | 0.59 | p<0.001 | 0.64 | p<0.001 |
| C | 0.49 | p<0.001 | 0.53 | p<0.001 |
CONCLUSION
According to the results of this investigation, it can be concluded that:
- Skeletal maturity increased together with the increases in chronological and dental ages for both gender. A consistently earlier occurrence for each skeletal maturation stage was observed in females.
- Dental age was more advanced than chronological age for both boys and girls for all CVM stages. During the peak growth period, these differences were more pronounced. CVM Stages II and III mark the ascending and descending portion of growth spurt respectively, thus dental age and chronological age should not be considered as reliable tools in identification of pubertal growth spurt.
- All correlations between skeletal and dental stages were statistically significant. The second molars showed the highest correlation whereas the canines showed the lowest correlation for both sexes.
- There is a need for further investigation using a larger sample of Greek children in order to reach stronger conclusions.
Percentage distribution of dental development stages around the peak growth stages.
| Dental stages | M2 | P2 | P1 | C | ||||
|---|---|---|---|---|---|---|---|---|
| Males (%) | Females (%) | Males (%) | Females%) | Males (%) | Females (%) | Males (%) | Females (%) | |
| CVMS II | ||||||||
| C | - | - | - | - | - | - | - | - |
| D | 11.40 | 16.00 | - | - | 2.90 | - | - | - |
| E | 25.70 | 40.00 | 14.30 | 28.00 | 2.90 | 12.00 | - | - |
| F | 45.70 | 36.00 | 51.40 | 56.00 | 42.90 | 32.00 | 40.00 | 32.00 |
| G | - | - | 28.60 | 16.00 | 31.40 | 48.00 | 22.90 | 36.00 |
| H | 17.10 | 8.00 | 5.70 | 20.00 | 8.00 | 37.10 | 32.00 | |
| Total | 100.00 | 100.00 | 100.00 | 100.00 | 100.00 | 100.00 | 100.00 | 100.00 |
| CVMS III | ||||||||
| C | - | - | - | - | - | - | - | - |
| D | - | 3.70 | - | - | - | - | - | - |
| E | 5.90 | 9.30 | - | 1.90 | - | - | - | - |
| F | 25.50 | 22.20 | 19.60 | 22.20 | 7.80 | 11.10 | 3.90 | 1.90 |
| G | 60.80 | 59.30 | 39.20 | 38.90 | 17.60 | 24.10 | 15.70 | 13.00 |
| H | 7.80 | 5.60 | 41.20 | 37.00 | 74.50 | 64.80 | 80.40 | 85.20 |
| Total | 100.00 | 100.00 | 100.00 | 100.00 | 100.00 | 100.00 | 100.00 | 100.00 |
| CVMS IV | ||||||||
| C | - | - | - | - | - | - | - | - |
| D | - | - | - | - | - | - | - | - |
| E | 7.70 | - | - | - | - | - | - | - |
| F | - | 2.90 | 7.70 | 8.60 | 0.00 | 2.90 | - | - |
| G | 15.40 | 45.70 | 7.70 | 17.10 | 7.70 | 0.00 | 7.70 | 2.90 |
| H | 76.90 | 51.40 | 84.60 | 74.30 | 92.30 | 97.10 | 92.30 | 97.10 |
| Total | 100.00 | 100.00 | 100.00 | 100.00 | 100.00 | 100.00 | 100.00 | 100.00 |
CONFLICT OF INTEREST
The authors declare that they have no competing interests.
ACKNOWLEDGEMENTS
The authors wish to thank the professors AE Athanasiou, M. Papadopoulos, I. Marathiotou-Ioannidou as well as the PhD Mathematician Vassili Karagianni, for his critical appraisal of the statistics.

