All published articles of this journal are available on ScienceDirect.
Evaluation of Radiomorphometric Indices in Panoramic Radiograph – A Screening Tool
Abstract
Background : Mandibular cortical indices, like the mandibular cortical index (MCI), panoramic mandibular index (PMI), mental index (MI), antegonial index (AI) and gonial index (GI) have been developed to assess and quantify the quality of mandibular bone mass. Aim and Objectives : The aim of this pilot study was to measure the radiomorphometric indices in a digital panoramic radiograph and find the inter-relationship of the indices with age and sex of the patients. Materials and Method : A total of 23 randomly selected patients were included in the study. Panoramic radiograph of each patient was taken and radiomorphometric indices were determined. Results : There was 69.57% agreement between MI and PMI which was significant. Similarly 78.26% agreement was seen between AI and MI which was significant. In contrast 30.43%, 52.17% and 56.52% agreement was observed while comparing GI with PMI, MI and AI respectively. Conclusion : MCI, PMI, AI and MI can be effectively measured on a panoramic radiograph, hence could be used as a screening tool for determining osteoporosis. All indices have a negative correlation with age and a significant difference between the younger and older age groups. All indices were significantly lower in females when compared to males of the same age group.
INTRODUCTION
Bone mass and density are important factors contributing to bone strength. The elastic modulus of bone, a property of bone that is conceptually linked to its fragility, is proportional to the cube of its density. Therefore, small changes in bone density are associated with larger changes in bone strength [1].
Osteoporosis defined as ‘‘a disease characterized by low bone mass and micro-architectural deterioration of bone tissue, leading to enhanced bone fragility and a consequent increase in fracture risk’’ [2].
Osteopenia can be identified by thinning of the cortex at the lower border of the mandible. A number of mandibular cortical indices have been developed to allow quantification of mandibular bone mass and identification of osteopenia [3].
Dual Energy X-Ray Absorbtiometry (DEXA) is considered to be the “gold standard” method for the estimation of bone mineral density because of its high precision and high accuracy [4]. DEXA is usually performed in the spine and the proximal femur but the assessment becomes difficult in the mandible because of superimposition of the contralateral sides [5].
Factors that influence bone mineral density are bone metabolism, skeletal mineral status, extraction of teeth, surgical procedures, occlusal forces transmitted by dentures, physicaland muscular activity, presence of remaining teeth, different type of denture support, thickness of mandibular bone, body mass index, drug intake and sample size [6].
Studies of involutional bone loss have shown that, in comparison to white women, black women have a higher peak bone mass at skeletal maturity, and higher bone mineral density (BMD) values at every measured site throughout the adult life cycle and a slightly slower rate of bone loss from femur and spine.Various studies have suggested that there is a definite relationship between mandibular osteopenia and osteoporosis of remaining skeleton [7-13].
Dental radiographs, especially panoramic images, have been used to predict low bone mineral density in patients. A number of mandibular cortical indices, including the mandibular cortical index (MCI), panoramic mandibular index (PMI), mental index (MI), antegonial index (AI) and gonial index (GI) have been developed to assess and quantify the quality of mandibular bone mass and to observe signs of resorption on panoramic radiographs for identification of osteopenia.
The aim of this pilot study was to evaluate the radiomorphometric indices in a digital panoramic radiograph and find the inter-relationship of the indices.
The objectives of the pilot study were:
To evaluate the variation of MCI and PMI in relation to age and gender.
To evaluate the inter-relationship between the objective indices used to assess mandibular bone mass.
MATERIALS AND METHOD
Source of data –In the present study, dental panoramic radiographs of patients, advised for periodontitis, impacted teeth, root stumps, dental implants etc, were analyzed for radiomorphometric indices.
A computer generated randomized list of sixty patients was assessed. Five of the patients did not belong to the age group considered in the present study. Remaining fifty five patients were advised panoramic radiographs of which 32 patients were excluded. In those 32 patients; mental foramen was not visualized bilaterally in 21 patients, five patients had been previously treated for mandibular fractures and six patients were diagnosed of having an underlying systemic condition affecting the bone mineral density. Thus remaining 23 patients were selected in the present study with no known cause of bone loss. A panoramic radiograph of each patient was taken and radiomorphometric indices were determined. A Digital Panoramic System (Kodak 8000, Eastman Kodak company) and a computer (Windows - XP operating system, Service Pack – 3, 64 bit, flat screen LCD display) were used. All the panoramic radiographs will be observed at the level of the monitor with subdued lighting condition.
INCLUSION CRITERIA
- Patient aged 25 years and above at the time of the radiographic examination in order to ensure full mandibular development.
- No known underlying systemic pathology which may affect skeletal metabolism.
- The inferior mandibular cortex and one or both mental foramina should be appreciable on the radiograph.
EXCLUSION CRITERIA
- Intrinsic errors on the radiographs.
- Patient positioning errors.
- History of maxillofacial trauma and reconstruction of the same.
- History of underlying disease affecting the bone metabolism.
Selected patients were divided into groups based on age and gender:
Based on Age: Young patients (below 40 years of age)
Old patients (above 40 years of age)
Based on gender: Male Patients
Female Patients
An approval was taken from the Institutional Ethical Committee before beginning the study and all the participants were given brief information about the purpose of the study and written consent was taken before undertaking the study.
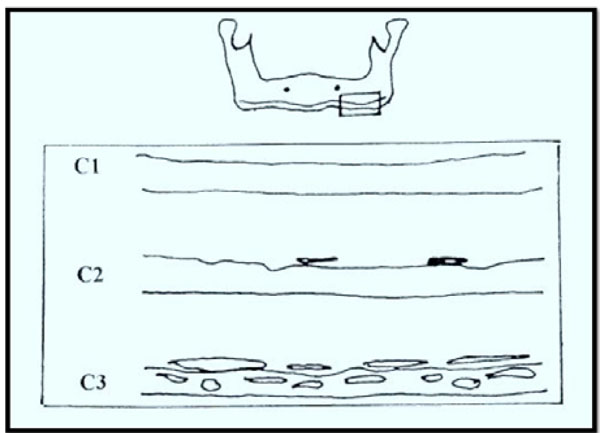
The MCI (Fig. 1) was calculated based on the appearance of the cortical border of the mandible distal to the mental foramina (Table 1) [14].

Mandibular Cortical Index (MCI).

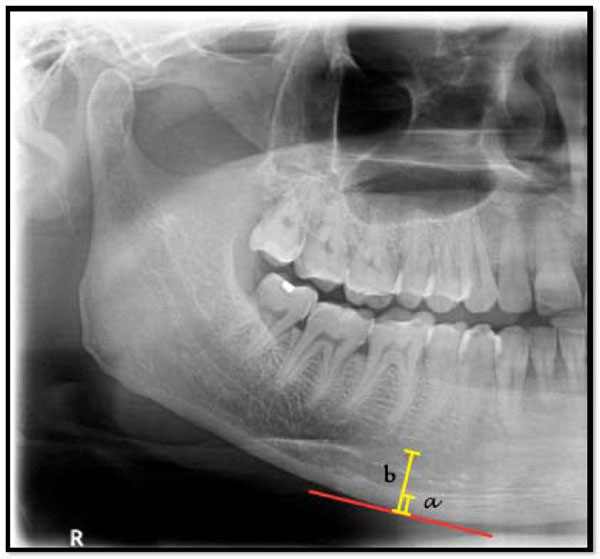
Panoramic Mandibular Index (PMI). Ratio of a/b.

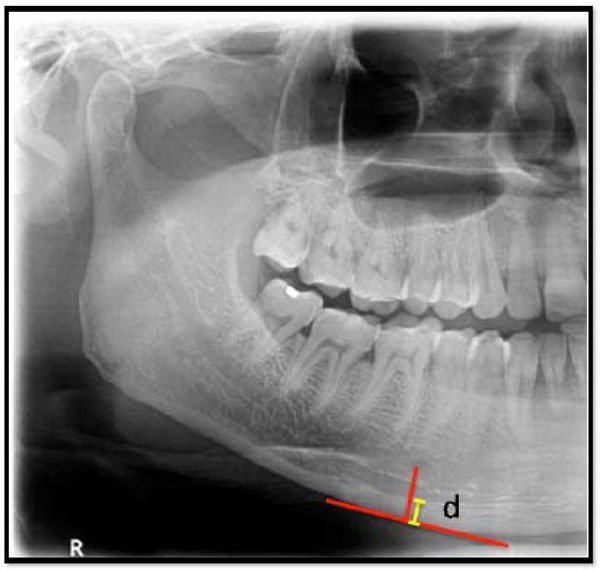
Mental Index (MI). Length of “d” in mm.

Antegonial Index (AI). Length of “c” in mm.

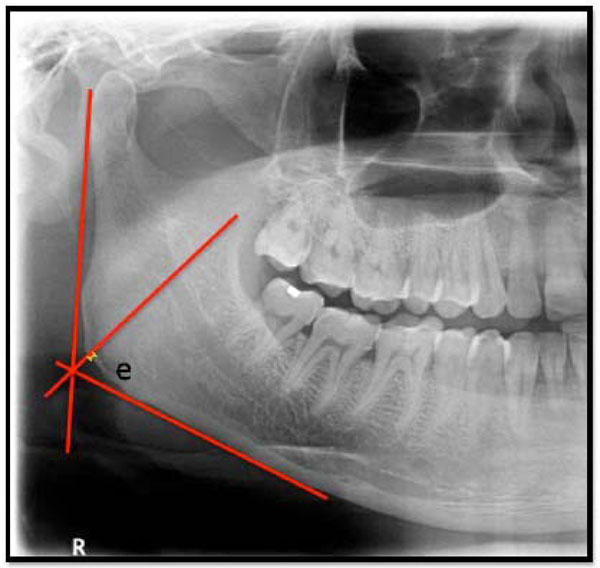
Gonial Index (GI). Length of “e” in mm.
Mandibular Cortical Index.
| Type | Description |
|---|---|
| C1 | The endosteal margin of the cortex is even and sharp on both the sides |
| C2 | The endosteal margins show semilunar defects (lacunar resorption) or seems to form endosteal cortical residues (one to three layers) on one or both sides |
| C3 | The cortical layer forms heavy endosteal residues and is clearly porous |
Distribution of samples by sex, age groups.
| Factors | No of samples | % of samples |
|---|---|---|
| Sex | ||
| Male | 12 | 52.17 |
| Female | 11 | 47.83 |
| Age groups | ||
| <40yrs | 10 | 43.48 |
| >40yrs | 13 | 56.52 |
| Mean age | 45.48 | |
| SD age | 14.32 | |
Comparison of age groups with MCI scores.
| MCI | <40yrs | % | >40yrs | % | Total |
|---|---|---|---|---|---|
| c1 | 7 | 70.00 | 3 | 30.00 | 10 |
| c2 | 3 | 30.00 | 7 | 70.00 | 10 |
| c3 | 0 | 0.00 | 3 | 100.00 | 3 |
| Total | 10 | 43.48 | 13 | 56.52 | 23 |
Comparison of male and females with MCI scores.
| MCI | Male | % | Female | % | Total |
|---|---|---|---|---|---|
| c1 | 6 | 60.00 | 4 | 40.00 | 10 |
| c2 | 6 | 60.00 | 4 | 40.00 | 10 |
| c3 | 0 | 0.00 | 3 | 100.00 | 3 |
| Total | 12 | 52.17 | 11 | 47.83 | 23 |
Evaluation of PMI values in the samples by Mann-Whitney U test.
| Variable | Age groups | Mean | SD | Sum of ranks | U-value |
|---|---|---|---|---|---|
| Panoramic Mandibular Index | <40yrs | 0.69 | 0.16 | 131.50 | |
| >40yrs | 0.64 | 0.20 | 144.50 | 53.50 | |
| Male | 0.73 | 0.07 | 170.50 | ||
| Female | 0.58 | 0.23 | 105.50 | 39.50 |
Mean values of the linear indices (GI, AI and MI) in the study.
| Index | Mean | s.d. | Minimum value | Maximum value |
|---|---|---|---|---|
| GI | 0.98 | 0.309 | 0.3 | 1.9 |
| AI | 2.98 | 0.428 | 1.7 | 3.4 |
| MI | 3.37 | 0.714 | 1.8 | 5 |
Agreement between Mental index with Panoramic Mandibular Index.
| Panoramic Mandibular Index | Mental index | ||||||
|---|---|---|---|---|---|---|---|
| Above normal | Below normal | Total | |||||
| Above normal | 13 | 7 | 20 | ||||
| Below normal | 0 | 3 | 3 | ||||
| Total | 13 | 10 | 23 | ||||
| Agreement | Expected Agreement | Kappa statistics | Std. Err. | Z-value | P-value | ||
| 69.57% | 54.82% | 0.3264 | 0.1541 | 2.1200 | 0.0171* | ||
* p<0.05
Agreement between Antegonialindex with Mental index.
| Mental Index | Antegonial Index | ||||||
|---|---|---|---|---|---|---|---|
| Above normal | Below normal | Total | |||||
| Above normal | 9 | 4 | 13 | ||||
| Below normal | 1 | 9 | 10 | ||||
| Total | 10 | 13 | 23 | ||||
| Agreement | Expected Agreement | Kappa statistics | Std. Err. | Z-value | P-value | ||
| 78.26% | 49.15% | 0.5725 | 0.2015 | 2.8400 | 0.0023* | ||
* p<0.05
Agreement between Gonial Index with Panoramic Mandibular Index.
| Panoramic Mandibular Index | Gonial Index | ||||
|---|---|---|---|---|---|
| Above normal | Below normal | Total | |||
| Above normal | 5 | 15 | 20 | ||
| Below normal | 1 | 2 | 3 | ||
| Total | 6 | 17 | 23 | ||
| Agreement | Expected Agreement | Kappa statistics | Std. Err. | Z-value | P-value |
| 30.43% | 32.33% | -0.0279 | 0.0911 | -0.3100 | 0.6204# |
# p>0.05
Agreement between Gonial Index with Mental Index.
| Mental Index | Gonial Index | ||||
|---|---|---|---|---|---|
| Above normal | Below normal | Total | |||
| Above normal | 4 | 9 | 13 | ||
| Below normal | 2 | 8 | 10 | ||
| Total | 6 | 17 | 23 | ||
| Agreement | Expected Agreement | Kappa statistics | Std. Err. | Z-value | P-value |
| 52.17% | 46.88% | 0.0996 | 0.1709 | 0.5800 | 0.2799# |
# p>0.05
Agreement between Gonial Index with Antegonial Index.
| Antegonial Index | Gonial Index | ||||||
|---|---|---|---|---|---|---|---|
| Above normal | Below normal | Total | |||||
| Above normal | 3 | 7 | 10 | ||||
| Below normal | 3 | 10 | 13 | ||||
| Total | 6 | 17 | 23 | ||||
| Agreement | Expected Agreement | Kappa statistics | Std. Err. | Z-value | P-value | ||
| 56.52% | 53.12% | 0.0726 | 0.1936 | 0.3700 | 0.3539# | ||
# p>0.05
Agreement between Antegonial Index with Panoramic Mandibular Index.
| Panoramic Mandibular Index | Antegonial Index | |||||
|---|---|---|---|---|---|---|
| Above normal | Below normal | Total | ||||
| Above normal | 10 | 10 | 20 | |||
| Below normal | 0 | 3 | 3 | |||
| Total | 10 | 13 | 23 | |||
| Agreement | Expected Agreement | Kappa statistics | Std. Err. | Z-value | P-value | |
| 56.52% | 45.18% | 0.2069 | 0.1270 | 1.6300 | 0.0516* | |
* p>0.05
Sensitivity and specificity of different indices vs Panoramic Mandibular Index.
| Summary | Mental Index | Antegonial Index | Gonial Index |
|---|---|---|---|
| Sensitivity | 100.00 | 100.00 | 83.33 |
| Specificity | 30.00 | 23.08 | 11.76 |
| Positive predictive value | 65.00 | 50.00 | 25.00 |
| Negative predictive value | 100.00 | 100.00 | 66.67 |
The PMI (Fig. 2) was calculated as the ratio of the mandibular cortical thickness measured on the line perpendicular to the bottom of the mandible, at the middle of mental foramen, to the distance between the superior margin of inferior mandibular cortex and bottom of the mandible (normal value > 0.3) [15].
The Mental index (MI) (Fig. 3) is the measurement of the mandibular cortical thickness on the line perpendicular to the bottom of the mandible at the middle of the mental foramen (normal value > 3.1mm) [15].
The Antegonial Index (AI) (Fig. 4) is the measurement of the mandibular cortical thickness measured on the line perpendicular to the mandibular cortex at the intersection with the tangent line to the anterior border of the ramus (normal value > 3.2mm) [15].
The Gonial Index (GI) (Fig. 5) is the measurement of the mandibular cortical thickness measured on the bisectrix of the angle between the tangent lines to the posterior border of the ramus of mandible and the bottom of the mandible (normal value of > 1.2 mm) [15].
The relationships between these indices among different age groups and gender were analyzed using Mann-Whitney U test.
OBSERVATION AND RESULTS
Out of 23 patients 12 were males and 11 were females. 13 were above 40 years of age of the total number of patients with a mean age of 45.48 years (Table 2). The c3 category of MCI was observed in 3 patients of the 23 patients and the remaining patients belonged to c1 and c2 category. Table 3 and Table 4 show the MCI in different groups.
Comparison of four different indices i.e. panoramic mandibular index, mental index, antegonial index and gonial index is done based on age and gender using Mann-Whitney U test. (Table 5 & 6).
There was 69.57% agreement between MI and PMI which was significant (p<0.05) (Table 7). There was 56.52% agreement between AI and PMI which was non-significant (p>0.05) (Table 8). Similarly 78.26% agreement was seen between AI and MI which was significant (p<0.05) (Table 9).
In contrast, 30.43%, 52.17% and 56.52% agreement was observed while comparing GI with PMI (Table 10), MI (Table 11) and AI (Table 12) respectively which was not significant (p>0.05).
Sensitivity and specificity of different indices when compared to PMI are shown in Table 13.
DISCUSSION
Bone is constantly resorbed and formed in the process known as remodelling. Thus, bone formation takes place not only during growth but throughout life. From age thirty to age fifty, the amount of bone formed approximately equals the amount resorbed. From the menopause in women and from about the sixth decade in men, bone resorption starts to exceed bone formation [16].
The earliest suggestion of an association between osteoporosis and oral bone loss was made in 1960 [17].
Researchers have studied alveolar bone which they believed best resembled the vertebral bodies in that, neither of the types of bone have muscular insertions. They utilized dental radiographs and commented that with standardized technique and proper control, radiographs of alveolar process might prove to be the better indicator of systemic osteoporosis [17].
Based on histological quantification, it was also found that the cortical porosity of the mandible increased with age and that there was considerably intra-mandibular variation in cortical porosity, with bone resorption and deposition being most active in alveolar process as opposed to mandibular body [18, 19]. However, alveolar bone is influenced by local factors (periodontal disease and denture quality), and hence the bone values from a single biopsy of the alveolar process cannot be used to indicate general structure of the mandible [20].
In the present study radiomorphometric indices of the mandible were measured and assessed in the panoramic radiographs. Researchers have studied that alveolar bone resembles the vertebral bodies as neither of the bone types have muscular insertions. Hence, dental radiographs made with standardized technique might prove to be the better indicator of systemic osteoporosis [21].Since dental panoramic radiography is used as a routine screening tool in general dental practice, assessment of radiomorphometric indices in it, may be helpful to identify low BMD and create awareness of osteoporosis.
In the present study three out of 23 patients showed C3 type of MCI among which all were elderly females. In a study done by Gulsahi et al, patients with C3 type of MCI should be considered as high-risk individuals for osteoporosis irrespective of age and gender [22]. Leite et al., considered MCI to be one of the accurate indices in assessing low BMD [23].Kiswanjaya et al, Dagistan et al., and Hastar et al., concluded that MCI could be used as one of the ancillary tool for assessing low skeletal bone mass [24-26].
The radiomorphometric index assessment in the present study showed that the mean PMI in younger individuals was 0.69 whereas in older individuals it was 0.64. Also, the mean PMI in males was 0.73 whereas in females it was 0.58. In a study conducted by Benson et al., the mean PMI in younger females and males was 0.32 and the value of PMI showed a negative correlation with the age and was found to be 0.353 and 0.266 in males and females respectively [27].
In the present study the mean values for GI, AI and MI were 0.98, 2.98 and 3.37 respectively. In a study conducted by Ledgerton et al., the mean values for the same indices were 1.35, 3.29 and 4.46 respectively. They also stated that MI, GI and AI have a general downward trend with age until the sixth decade, when values began to fall sharply compared to the mean values for the population [28]. The variation in mean values of the indices in comparison to those of Benson et al., and Ledgerton et al., could be attributed to the variation in the ethnicity and smaller sample size [27, 28].
The PMI in the present study, decreased with age and was smaller among women when compared with men; which is similar to the study done by Dagistan S [25]. Also, a gradual increase was found upto the sixth decade and then decreased [29], which was found in our study as well.
MI decreases with age and is lower in white individuals than in black individuals [24-26]. Researchers found out that MI is lower in women than in men and is lower among female patients with osteoporosis compared with healthy female individuals [15]which is congruent with the present study.
Ledgerton et al., found out AI had lower values in females when compared to males which are demonstrated in the present study [28, 29].
The value for GI in the present study was 1.13 and 0.77 in males and females respectively. According to Bras et al., GI demonstrated a very gradual thinning with age and the values were lower in females when compared to males [30] which were demonstrated in the present study.
CORRELATION IN BETWEEN INDICES
PMI is considered one of the most accurate radiomorphometric indices because of its method of calculation that takes account of the differences in magnification associated with different panoramic equipments. Hence in the present study GI, AI and MI were compared with PMI.
In the present study, the inter-relationship agreement between MI and PMI was 69.57% which was significant (p < 0.05), whereas the inter-relationship agreement between AI and PMI was 56.52% which was non-significant (p > 0.05). These findings suggested that only MI gave valid and consistent reading when compared to PMI, hence could be used to assess the BMD.
Also, the inter-relationship agreement between MI and AI was 78.26% which was significant (p<0.05). However, in the present study, the inter-relationship agreement between GI and PMI, GI and MI, GI and AI were 30.43%, 52.17% and 56.52% respectively which was not significant (p > 0.05)
On comparing the other indices with PMI, GI showed the least sensitivity and specificity of 83.33% and 11.76% respectively. On the other hand AI and MI had greater sensitivity and specificity. Thus, this correlation demonstrates that of all the radiomorphometric indices GI was least accurate.
The reason for variation in measurement of GI may be due to the influence of the muscle attachment, observer variation and a far too smaller value when compared to other indices. Kribbs et al., also found similar variation in the measurement of GI and stated that it could not be used to assess the BMD of an individual [31, 32].
LIMITATIONS
The present study sufficiently demonstrates the reliability of the radiomophometric indices in identifying the individuals with a greater risk of osteoporosis. Further studies need to be carried out with a much larger population to ascertain its efficacy. Also, the agreement between multiple observers should be carried out to analyze the accuracy of the measurement of different radiomophometric indices. Blinding the investigators or masking the dentition status in panoramic radiograph would increase the validity of these indices. Correlation of radiomorphometric indices with sophisticated tools like DEXA would yield better representation of the skeletal condition.
CONCLUSION
MCI, PMI, AI and MI can be effectively measured on a panoramic radiograph, hence could be used as a screening tool for determining osteoporosis. Difficulties in precisely marking and measuring the indices especially with GI, were encountered in the study. Hence GI could impose a considerable obstacle to its use in general practice, in identification of low BMD individuals. All indices have a negative correlation with age and a significant difference between the younger and older age groups. All indices were significantly lower in females when compared to males of the same age group. Thus radiomorphometric indices in a panoramic radiograph may possibly be used as a potential screening tool in identifying individuals with osteoporosis.
CONFLICT OF INTEREST
The authors confirm that this article content has no conflict of interest.
ACKNOWLEDGEMENTS
Declared none.


