All published articles of this journal are available on ScienceDirect.

EDX-Element Analysis of the In Vitro Effect of Fluoride Oral Hygiene Tablets on Artificial Caries Lesion Formation and Remineralization in Human Enamel
Abstract
Aim of this in-vitro-study was to assess the remineralization potential of a tooth cleaning tablet with different fluoride content quantitatively using EDX analysis.
Twenty three caries free impacted third molars were examined; enamel surfaces were wax coated leaving two 3x4mm windows for exposure to demineralization/remineralization cycles. The teeth were randomly assigned to 4 groups of 5 control and 6 experimental teeth each. Demineralization by standardized HEC-gel, pH 4.7 at 37°C for 72h, was alternated by rinsing in remineralization solution, pH 7.0 at 37°C for 72h, total challenge time 432h. The negative control group N was treated during remineralization cycles with saline; positive control group P was treated with remineralization solution; experimental group D1 was exposed to remineralization solution containing Denttabs®-tablets with 1450 ppm F; experimental group D2 was exposed to remineralization solution and Denttabs®-tablets with 4350 ppm F. Each tooth was cut into serial sections and analyzed by scanning electron microscopy with EDX element analysis for assessment of the different zones of the lesions in 3 representative sections. Statistical analysis was based on the AVOVA test for repeated measurements and post hoc Bonferroni adjustment. The results showed a significantly higher Ca and P content in the body of the lesion in both fluoride treated groups compared to the controls. It can be concluded that higher concentrations of NaF may be more effective in remineralization of early advanced caries lesions.
INTRODUCTION
The use of fluorides is the most effective method in caries inhibition. In caries preventive protocols fluoride containing dentifrices are widely used. Dentifrices contain usually between 1200 and 1450 ppm fluoride. Their effect on remineralization of initial caries lesions depends upon the fluoride concentration and the fluoride formulation [1]. Recently it could be shown, that remineralization of caries lesions is enhanced by higher fluoride concentrations [2, 3]. A novel application of fluoride is the use of oral hygiene tablets. The advantage of the use of oral hygiene tablets is that they are rapidly dissolved in saliva, and that the fluoride bioavailability immediately after tooth brushing is higher compared to a conventional dentifrice [4-6]. A recent study reported that the effectiveness of the remineralization of initial artificial caries lesions depends upon the fluoride concentration in the tablets [7].
In vitro studies address mechanistic questions of enamel de- and remineralization with standardized methods. During the past decades pH cycling models for the determination of the efficiency of fluoride products for remineralization of caries lesions have become state of the art [3, 8, 9]. Different methods to determine the effectiveness of fluoride products on artificial caries lesions have been used. Mineral loss and uptake has been measured by determining the Ca content in the de- and remineralizing solutions [10, 11]. Most widely microradiography of the lesions has been applied for determining the demineralization and remineralization effect [2, 12]. It is the advantage of polarized light microscopy to characterize the morphological features of remineralization effects in initial artificial caries lesions [7]. Serial sections through caries lesions can further be investigated using SEM imaging and EDX element analysis [1, 13-15] It was therefore the aim of this study to determine the quantitative effect on de- and remineralization of artificial caries lesion of different NaF concentrations in a newly developed oral hygiene tablet.
MATERIALS AND METHODOLOGY
Tissue
Twenty three completely impacted human third molars were used in agreement with GLP instructions governing the use of human tissue. These teeth were selected because of the uniform enamel structure with no individual challenges due to the non-exposure to the oral cavity. Immediately after clinically indicated surgical removal they were thoroughly cleaned of organic debris and stored in saline containing 0.1% thymol. No further surface treatment of the enamel was applied. The teeth were than coated with wax leaving a 3x4 mm window on the buccal and lingual smooth surfaces and finally randomly assigned to 4 groups (Table 1).
Element Content in Weight % in The Different Lesion Zones
| Lesion Zone | Group | Value | C | F | P | Ca | Ca/P |
|---|---|---|---|---|---|---|---|
| Superficial layer | N | Median | 12.19 | 0.15 | 18.65 | 34.24 | 1.84 |
| Mean | 12.52 | 0.17 | 19 | 35.08 | 1.84 | ||
| SD | 2.8 | 0.13 | 1.5 | 3.36 | 0.06 | ||
| P | Median | 12.48 | 0.2 | 18.08 | 32.74 | 1.82 | |
| Mean | 12.95 | 0.21 | 18.06 | 32.67 | 1.81 | ||
| SD | 2.89 | 0.15 | 1.11 | 2.54 | 0.07 | ||
| D1 | Median | 11.48 | 0.21 | 18.88 | 34.62 | 1.84 | |
| Mean | 11.89 | 0.31 | 19.03 | 35.01 | 1.84 | ||
| SD | 2.38 | 0.27 | 1.37 | 3.19 | 0.06 | ||
| D2 | Median | 11.63 | 0.21 | 18.56 | 34.31 | 1.85 | |
| Mean | 11.98 | 0.23 | 18.56 | 34.51 | 1.86 | ||
| SD | 2.26 | 0.18 | 1.21 | 2.74 | 0.06 | ||
| Body of the lesion | N | Median | 26.19 | 0.18 | 15.49 | 28.6 | 1.86 |
| Mean | 26.65 | 0.2 | 15.62 | 29.15 | 1.86 | ||
| SD | 4.3 | 0.14 | 1.51 | 3.61 | 0.07 | ||
| P | Median | 27.68 | 0.15 | 14.81 | 27.15 | 1.83 | |
| Mean | 28.33 | 0.16 | 14.73 | 26.93 | 1.82 | ||
| SD | 7.34 | 0.12 | 2.05 | 4.64 | 0.10 | ||
| D1 | Median | 20.3 | 0.33 | 16 | 31.48 | 1.86 | |
| Mean | 21.39 | 0.42 | 16.79 | 31.27 | 1.86 | ||
| SD | 6.23 | 0.3 | 2.01 | 4.39 | 0.07 | ||
| D2 | Median | 21.5 | 0.29 | 16.31 | 30.57 | 1.89 | |
| Mean | 21.9 | 0.33 | 16.31 | 30.71 | 1.88 | ||
| SD | 6.44 | 0.2 | 1.82 | 3.5 | 0.05 |
Demineralization/Remineralization, pH-Cycling
pH-cycling conditions were chosen to create advanced artificial enamel lesions on natural smooth surfaces. Each cycle was scheduled for 3 days and was repeated 6 times. The experimental period of pH-cycling lasted therefore 18 days. After demineralization and remineralization (except for the negative control group) the specimens were rinsed in distilled water to remove excess treatment gel solution. Demineralization gel contained 1.5 mM CaCl2, 0.9 mM KH2PO4, 150 mM KCl, 0.1 M sodium acetate buffer, 30 mM acetate in hydroxyehtylcellulose. The pH was adjusted to 4.7 and controlled before and after each 3 day cycle [16].
Remineralization solutions were comprised of 1.5 mM CaCl2, 0.9 mM KH2PO4, and 150 mM KCl at pH 7.0, again controlled before and after each 3 day cycle.
The wax coated teeth were fixed with metal wires and hang in the respective solutions and the volume of each solution was 100 ml. These solutions were constantly agitated using a magnetic stirrer. All cycles were executed under constant climatic conditions at 370.
Treatment Groups
The experimental scheme has been previously described in detail by Gaengler et al., 2009 [7]. The negative control group N of 5 teeth with10 lesions underwent demineralization cycles only and was kept during the remineralization cycles in saline. The positive control group P of 6 teeth with 12 lesions was remineralized in the specified solution without fluoride content. The 2 experimental groups (D1 and D2) of 6 teeth with 12 lesions each were exposed to remineralization solution containing Denttabs ® with 1450 ppm F- (D1) or Denttabs ® with 4350 ppm F- (D2). The oral hygiene tablets contain fluoride from NaF, and the other ingredients according to INCI are microcrystalline hydroxyethylcellulose, hydrated silica, sodium hydrogen carbonate, sodium laurylsulfate, ascorbic acid, magnesium stearate, aspartame and mint flavor (Innovative Zahnputzgesellschaft mbH, Berlin, Germany).
The tablets were suspended in the remineralization solution with a ratio of one tablet per 5 ml solution to simulate the maximal bioavailability of fluoride immediately after brushing [4].
Scanning Electron Microscopy
After removal of the wax coatings standardized micro photos of all lesions at 10x magnification were taken. Before further processing the roots were removed. All teeth were then dehydrated in graded alcohol and embedded in Technovit 9100 (Kulzer, Weinheim, Germany). Serial ground sections were cut with a saw microtome (LEICA CM 1900, Leica, Wetzlar, Germany) with a thickness of 80 µm in corono-apical direction. Three ground sections per tooth representing two approximal lesions on the buccal and lingual sides were used for quantitative assessment of calcium, phosphorus, fluoride and carbon content. The results of the polarization light microscopic investigations of the sections have already been published [7]. Prior to electron microscopy the sections were coated with carbon. The sections were investigated with a Philips XL 30 FEG scanning electron microscope (Philips, Eindhoeven, Netherlands). Acceleration voltage was 20 kV using a backscattered electron detector (BSE). Element analysis was carried out with an energy dispersive x-ray analysis system (EDX) using a S-UTW detector (EDAX INC, Mahwah, NJ, USA). In each lesion within the superficial zone, the body of the lesion, and sound enamel five measuring points were selected. The measuring time was 60 seconds with a resolution of 135.8 eV and an amplification time of 100 live seconds. Line scans through whole caries lesions of the teeth were made at 510 points with a dwell time of 1000ms and an amplification time of 10 live seconds.
Statistical Analysis
The obtained data were processed with the Statistical Package for Social Sciences (SPSS 17.0, Chicago, III., USA). Normal distribution of the data was tested with the Levene test and for comparison of the data between the different groups. the ANOVA test for multiple comparisons with post hoc adjustment after Bonferroni was used. The data within the groups were compared using the non parametric sign test for related samples. The level of significance after α-adjustment was determined at p<0.025.
RESULTS
Scanning electron microscopy of the lesions revealed remarkable differences in the lesion morphology. The negative control group N showed inhomogeneous large laminated lesions (Fig. 1a). The positive control P showed also large lesions, but less expressed (Fig. 1b). In experimental group D1 the lesions were smaller and clearly less demineralised. The body of the lesion was almost absent (Fig. 1c). In experimental group D2 the lesions were even smaller with a narrow band as body of the lesion (Fig. 1d). The line scan through a lesion of group N demonstrated the demineralization of the body of the lesion and the non demineralized superficial zone (Fig. 2).
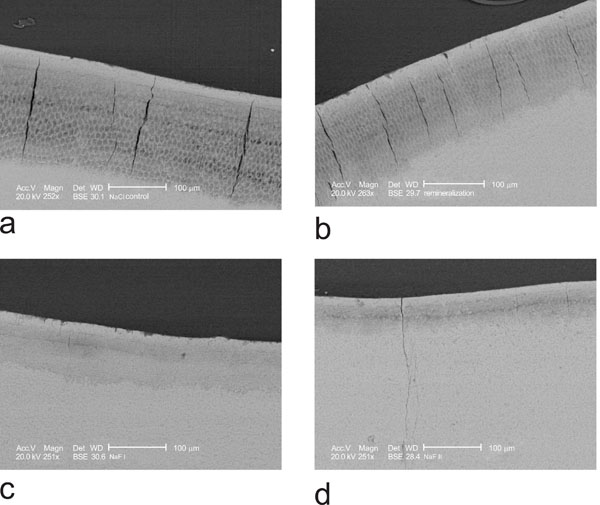
a) NaCl negative control shows a large demineralized body of the lesion with high porosity and a superficial layer. b) positive control incubation with remineralization solution shows a large, but slightly less demineralized body of the lesion and a continuous superficial layer. c) D1 incubation with 1450 ppm fluoride shows a smaller, less demineralised body of the lesion with remineralizing laminations and a continuous superficial layer. d) D2 incubation with 4350 pp, fluoride shows a very small body of the lesion and large superficial layer.
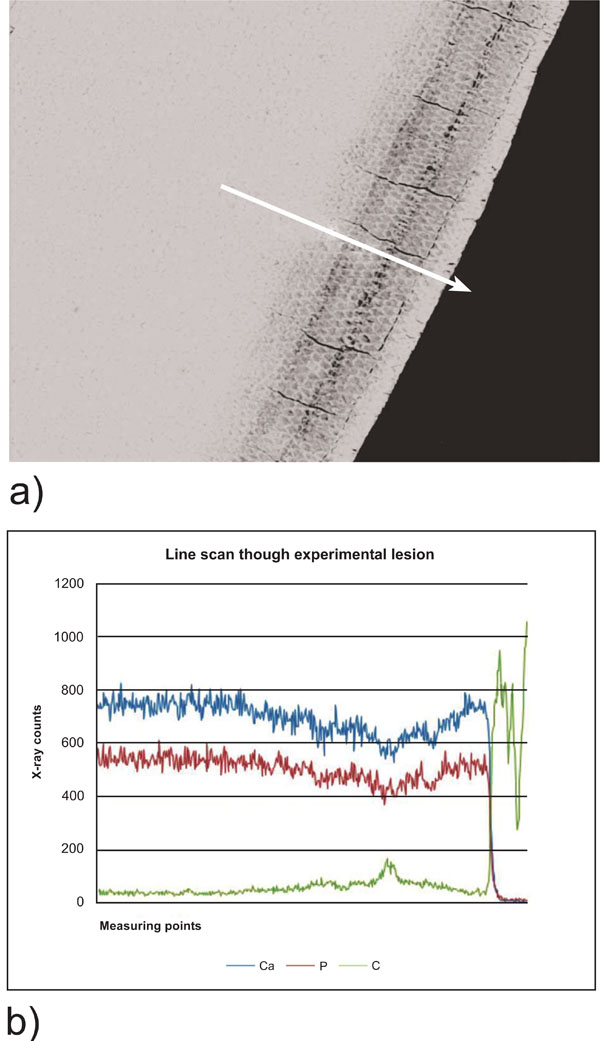
Line scan through a NaCl negative control lesion. a) scanning electron micrograph of the lesion. The arrow indicates the measured line from sound enamel towards the surface. b) Line scan through the lesion demonstrating the loss of Ca and P within the body of the lesion and increasing Ca and P content towards the superficial layer. Left is the beginning of the scan in sound enamel, right the enamel surface.
In the superficial layer the calcium and phosphorus content was similar in the control group N and experimental group D1 and D2 (Tables 1 and 2, Fig. 3). The content of phosphorous and calcium in the body of the lesion was significantly higher in groups D1 and D2 compared to both control groups N and P. The numeric values are summarized in table 1. All measurements showed a rather wide range of variation (Fig. 4).
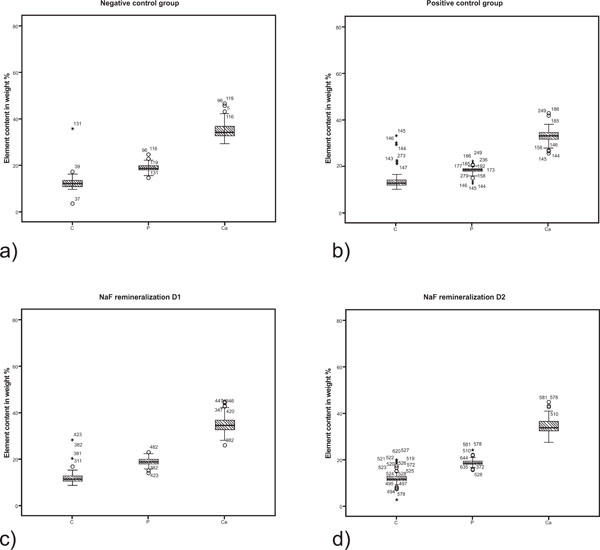
Boxplot graphics of the element content in the superficial layer of the different experimental lesion groups. a) N = negative control; b) P = positive control; c) D1 = NaF remineralization with 1450 ppm fluoride; d) D2 = NaF remineralization with 4350 ppm NaF.
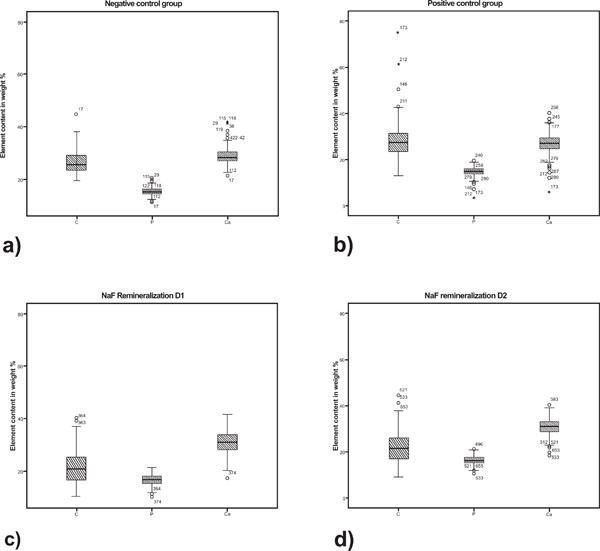
Boxplot graphics of the element content in the body of the lesion of the different experimental lesion groups. a) N = negative control; b) P = positive control; c) D1 = NaF remineralization with 1450 ppm fluoride; d) D2 = NaF remineralization with 4350 ppm NaF.
For the body of the lesion statistical analysis showed significant differences in the content of all measured elements between group N and P and D1 and D2. In the superficial layer the Ca, P and C content was significantly higher in group D2 compared to group P. All statistical results are summarized in Table 2.
Statistical Differences of the Element Content Within the Different Lesion Zones.
| p Value | ||||||
|---|---|---|---|---|---|---|
| Lesion Zone | Groups | C | F | P | Ca | Ca/P |
| Superficial layer | N/P | p = 0.864 | p = 0.435 | p < 0.001 | p < 0.001 | p<0.0001 |
| N/D1 | p = 0.208 | p < 0.001 | p = 1.000 | p = 1.000 | p=1.000 | |
| N/D2 | p = 0.445 | p = 0.064 | p = 0.017 | p = 0.554 | p=0.230 | |
| P/D1 | p = 0.001 | p < 0.001 | p < 0.001 | p < 0.001 | p < 0.001 | |
| P/D2 | p = 0.003 | p = 1.000 | p = 0.002 | p < 0.001 | p < 0.001 | |
| D1/D2 | p = 1.000 | p < 0.001 | p = 0.004 | p = 0.638 | p=0.018 | |
| Body of the lesion | N/P | p = 0.125 | p = 1.000 | p < 0.001 | p < 0.001 | p<0.001 |
| N/D1 | p < 0.001 | p < 0.001 | p < 0.001 | p < 0.001 | p=1.000 | |
| N/D2 | p < 0.001 | p < 0.001 | p = 0.011 | p = 0.006 | p= 0.230 | |
| P/D1 | p < 0.001 | p < 0.001 | p < 0.001 | p < 0.001 | p < 0.001 | |
| P/D2 | p < 0.001 | p < 0.001 | p < 0.001 | p < 0.001 | p < 0.001 | |
| D1/D2 | p = 1.000 | p < 0.001 | p = 0.092 | p = 1.000 | p= 0.018 | |
Statistically significant differences are marked in red.
The Ca/P ratio was between 1.81 and 1.88 reflecting not the ratio of chemically pure hydroxyapatite, which is 1.66. However, a statistically significant difference in the Ca/P ratio was found between the superficial layer of N-P, P-D1, P-D2 D1-D2 and in the body of the lesion between N-P, P-D21, PD2 and D1-D2 (Tables 1 and 2).
Comparison of the element content within the groups showed, that for C, Ca and P the element contend was significantly different (p < 0.001) between the superficial layer, the body of the lesion and sound enamel. The fluoride content was significantly higher in the superficial layer of D1 compared to the control group N. In the body of the lesion the fluoride content was significantly higher in D1 and D2 compared to control N, and P and to D2 (Table. 2). In both D1 and D2 groups the fluoride content in the body of the lesion was higher than in the superficial layer.
DISCUSSION
The predominant effect of topically applied fluoride is to inhibit demineralization and increase remineralization. Newer studies showed that the efficiency of higher concentrations of fluoride in oral hygiene products for remineralization of advanced subsurface caries lesions is even better [2, 3, 7]. De- and remineralizing processes are yet not fully understood. This investigation showed that the mineral content within the surface layer was not different between the demineralized control group and the remineralised NaF groups. On the other hand the mineral content in the body of the lesion increased significantly compared to the demineralized control group. This indicates that fluoride enhances the remineralization of the body of the lesion. This is also supported by the increased fluoride content of the body of the lesion.
The pH cycling model, applied in this investigation, resulted in well defined advanced caries-like lesions, which have been described earlier [7]. In agreement with the data already reported, the quantitative element analysis demonstrated a similar remineralization potential of the 4350 ppm fluoride concentration and the 1450 ppm fluoride concentration. This seems to be contradictory with previous studies, which demonstrated that higher fluoride concentrations enhance the remineralization of advanced caries lesions [2, 3, 12]. However, Yamazaki et al. (2007) [12] observed, that already low concentrations of fluoride prevented demineralization of sound enamel, and higher concentrations enhanced remineralization of artificial caries-like lesions. The presented results clearly demonstrate, that the remineralization effect is due to fluoride, because the content of Ca and P in D1 and D2 is higher in the body of the lesion compared to the positive control group.
Long term bioavailability of fluoride is essential for remineralization of caries lesions. In-vivo bioavailability of fluoride is dependent upon several factors which are fluoride formulation, fluoride concentration and salivary composition [5, 6]. After fluoride administration the fluoride concentration in dental plaque increases. [6, 17].
Inhibition of demineralization and/or enhancement of remineralization depend upon the availability of free fluoride ions. It has been discussed that fluoride may form CaF2 fluoride depots which slowly release fluoride ions [18, 19]. However, it could be shown that shortly after the application of a sodium fluoride mouth rinse CaF2 – like deposits were not formed in plaque [20].
The complex fluoride kinetics in saliva and plaque fluid are influenced by both sources, the fluoride secretion via salivary glands and, mainly, by alimentary uptake or topical application of fluoride containing oral hygiene products. The pathobiological conditions on biofilm coated tooth surfaces are not entirely reproduced by the in-vitro cycling remineralization model. However, the results clearly demonstrate the elevated bioavailability of fluoride contributes to enhanced remineralization of advanced caries-like enamel lesions.
The SEM images of subsurface lesions confirm the dynamic remineralization process with laminations at the forefront of mineral deposits and with decreasing pore volume. This is further supported by the significant increase of calcium and phosphorus exclusively in the body of the caries lesion if fluoride was available.
COMPETING INTERESTS
The authors’ declare that they have no competing interests.
ACKNOWLEDGEMENTS
The authors would like to thank Mrs. Susanne Haussmann for her technical assistance in the lab.

