All published articles of this journal are available on ScienceDirect.

Setting Reaction of Polyacid Modified Composite Resins or Compomers
Abstract
The hardening of modified polyacid composite resins (compomers) and glass-ionomers have been studied using infrared spectroscopy. The acid-base reaction in Ketac-fil, a glass ionomer, was followed by the ratio between the COOH band located around 1715 cm-1 and that corresponding to COO- located around 1570 cm-1. The combination of infrared analysis and band narrowing treatments enable us to propose in the glass-ionomer two maturation steps. First, a very rapid equilibrium acid-base related, and second the cross-linking of polycarboxylate with the metal ions present in the cement. In compomers, a new reaction has been described involving polymerization induced by free radicals besides the two steps associated with the acid-base reaction. Using infrared spectroscopy and band narrowing techniques, it is shown that water is essential to complete the hardening process but no acid-base reaction is produced since the COO- band does not appear. The reaction associated with free radicals could be described as a polymerization of methacrylate monomers together with an aqueous dilution of the filling particles releasing different metal cations that would chelate with the polymer molecules to form a macromolecular structure.
INTRODUCTION
Conventional glass ionomer cements (C-GIC) or glass polyalkenoate cements [1] have been used in odontology since their discovery [2]. One of the major reasons for using them is their prolonged fluoride release and inherent cariostatic effect [3]. Besides the development of these cements, to overcome the clinical problems new materials have appeared via the combination of C-GIC with composite resins [4] without losing the acid-base reaction characteristic which determines its hardening [5] and subsequent fluoride release [6].
Since 1993 new materials known as modified polyacid composite resins or compomers have appeared on the market. Included in their composition are bifunctional monomers which are polymerised via methacrylate and carboxylic groups capable of reacting in the presence of water with the cations released from the filling particles [7]. Whilst there are no doubts as to acrylic polymerisation, the potential existence of an acid-base neutralisation reaction has given rise to great controversy among different authors [8-11].
Among the different methods for determining the transformation of many reactions and the degree of chemical conversion, Fourier-transform infrared spectroscopy (FTIR) has proven to be a powerful technique for detecting the replacement ratio between C=C and C-C in methacrylate groups, as well as the COOH/COO- exchange in acid-base reactions [12,13]. In the present work, using mathematical treatments of FTIR spectra we have studied the compomer hardening reaction looking at the changes in the bands attributed to the methacrylate double bonds and the process of maturation in a conventional ionomer to evaluate the acid-base reaction.
MATERIALS AND METHODOLOGY
Three commercial materials were used in the present study (Table 1). The Ketac powder was mixed with the liquid according to the manufacturer’s instructions. The hardening reaction was stopped by adding ethanol at different time intervals and the specimen was subsequently dried. For Hytac and Compoglass, a small portion of light-cured glass ionomer was exposed to a visible light-curing unit (Visilux 2, 3M Germany) during 40 seconds. The specimens of each light cured glass ionomer were prepared and stored in a glass tube in the presence or absence of distilled water for different measurement time periods; samples were dried before the IR analysis.
Materials Tested
| Product | Type | Manufacturer | Batch |
|---|---|---|---|
| Ketac-Fil | Conventional Glass Ionomer | ESPE, Germany | 007 |
| Compoglass | Compomer | VIVADENT, Liechtenstein | 902646 |
| Hytac | Compomer | ESPE, Germany | 231 |
IR SPECTROSCOPY
The samples were measured as KBr disks. IR spectra were obtained using a Nicolet Magna II spectrometer (Thermo Nicolet, Madison, Wisconsin), at a nominal resolution of 2 cm-1, averaging 1000 scans. The spectra in the region between 1800 cm-1 and 1500 cm-1 were analysed using previously described protocols for data treatment (deconvolution and derivative) and curve-fitting [14,15].
RESULTS
Ketac-Fil: Glass Ionomer
The acid-base reaction in the hardening and maturation of a glass-ionomer cement was monitored by IR spectroscopy looking at the C=O stretching vibration ratio between the COO- (base) and COOH (acid) bands. Fig. (1) shows the original and deconvolved spectra of Ketac- Fil in the 1850-1500 cm-1 region measured at different incubation times up to 1 h after activation. Longer incubation periods did not produce any further changes. The use of deconvolution enables visualization of overlapping bands in the spectrum and clearly shows the maturation course. Before mixing the components, the spectrum of the liquid is dominated in both cases by a band at 1715 cm-1, characteristic of the vibration corresponding to the carboxylic acid. Immediately after mixing with the ionomer, a clear decrease in the band at 1715 cm-1, concomitant with an increase in the band at 1637 cm-1 and the appearance of a new component around 1598 cm-1, corresponding to different COO- species occurs. It must be noted that discrimination between these bands can be made only after the use of band narrowing techniques, such as Fourier deconvolution, since they cannot be distinguished in the original spectra. The band at 1598 cm-1 can be assigned to a carboxyl stretching vibration arising from COO- conjugated with cations from the cement. Polycarboxylate cross-linking with ions would decrease the frequency of the band in a similar way to the effect of hydrogen bridges in C=O band absorption in biological molecules; i.e., the stronger the interaction, the larger the decrease in band wavenumber.
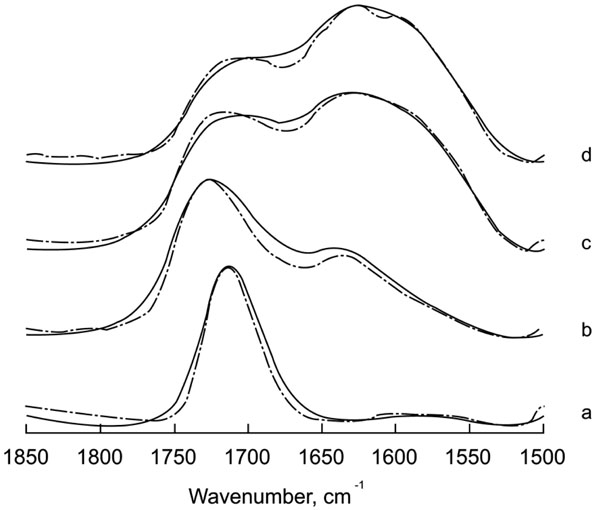
Original and deconvolved spectra of Ketac Fil in the region 1850-1500 cm -1. (a: Liquid component of the mixture; b: time zero; c: 10 minutes; d: 1 hour). Deconvolution parameters are FWHH=25 and k=1.5.
The degree of reaction can be followed by curve-fitting the region 1800-1500 cm-1 and obtaining the percentages of the components corresponding to the COOH band and the two COO- bands (Fig. 2). The decrease in polycarboxylic acid is very rapid and in 10 minutes reaches 35% of the percentage in equilibrium. In the bands corresponding to the COO- components, the maximum for the 1630 cm-1 band it is also at 10 min, where it can also be observed an increase in the1590 cm-1 band at the expense of the other component. This response would be compatible with a rapid acid-base reaction, corresponding to a COOH → COO – transition and a slower process of cross-linking of the base components conjugated with the cations present in the cement.
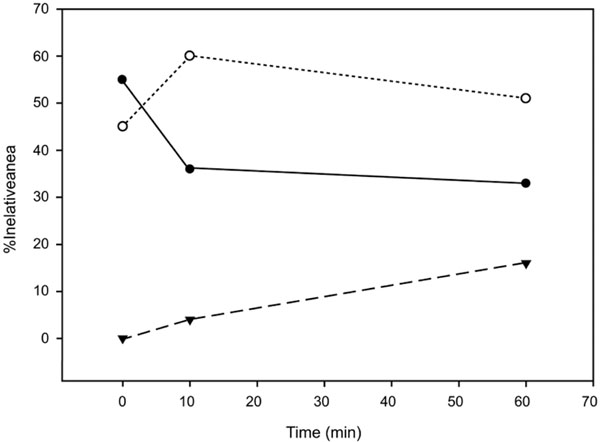
Relative areas of the C=O stretching band components for Ketac Fil. The polycarboxilic acid component (●) is represented together with the two policarboxilate bands corresponding to the free (○) and conjugated species (▼).
Hytac and Compoglass: Compomers
The hardening of these two compomers was followed in the same way as the aforementioned ionomer. The spectral region 2000-1000 cm-1, (Fig. 3) shows the original spectra for Compoglass and Hytac after 5 days incubation in the presence or absence of added water. The spectra in the absence of water after 5 days is identical to the one before the reaction started thereby demonstrating that water is essential for the reaction to proceed. A prominent band at around 1720 cm-1 is indicative of the C=O stretching of the COOH species. The band corresponding to COO- is located around 1535 cm-1. Several bands can be attributed to the methacrylate component such as those located around 1700, 1633, 1300 and 1150 cm-1 that decrease after incubation. Curing of the cement by visible light under different water conditions in the region corresponding to the acid-base reaction is shown in Fig. (4). Unlike the glass ionomer, the ratio between the bands at 1720 and 1535 cm-1 in this case does not change during the reaction. However, a clear decrease in the C=C band at 1638 cm-1 from the methacrylate can be clearly seen together with the disappearance of other methacrylate bands around 1300 and 1150 cm-1. This change in the spectrum points to a non-involvement of an acid-base process in the hardening reaction, but to a polymerization of the methacrylate present in the cement. The change in shape and position observed in the band at 1720 cm-1 would imply involvement of the carboxylic acid in the cross-linked organization obtained after the polymerization reaction. It has to be mentioned, that the polymerization reaction observed as the reduction of the 1637 cm-1 band is very fast, with completion during the first minute. There are no subsequent decreases in the methacrylate bands, but the change in shape and position of the band at 1720 cm-1 indicates that compound rearrangement still takes place at longer times after cross-linking of the monomers.

Original spectra for Compoglass (a) and Hytac (b) in the region 2000-1000 cm -1 after incubation in water for 5 days. Solid line: Same time without water incubation.
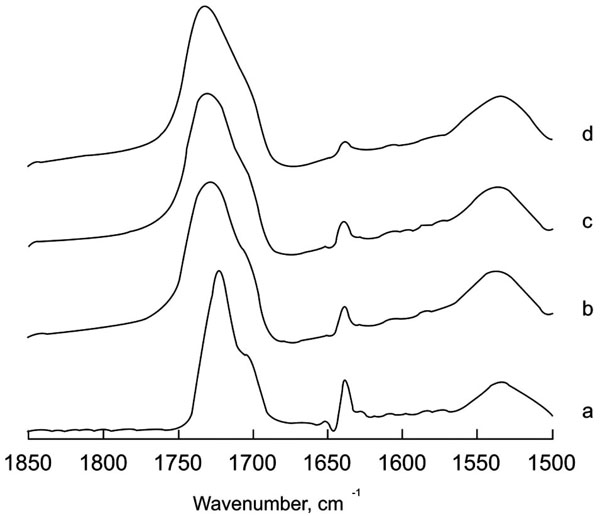
Deconvolved spectra of Hytac in the region 1850-1500 cm -1 at different water incubation times. a= no incubation; b= 1 minute; c= 15 minutes; d= 5 days. Deconvolution parameters are FWHH=18 and k=2.
DISCUSSION
Infrared spectroscopy and resolution enhancement techniques have been applied to follow the maturation of Ketac-Fil, a glass ionomer cement, and the compomers Hytac and Compoglass. In glass ionomers, the acid-base reaction had been previously characterized by infrared spectroscopy, but without applying band-narrowing techniques. The use of Fourier deconvolution or derivation enables narrowing of the intrinsic broad bands and visualization of overlapping components, such as those representing different populations. The acid-base reaction is characterized observing of the ratio between protonated and unprotonated modes. These two bands are resolved to allow for the reaction progress to be followed without difficulty. The COOH species generally appears above 1700 cm-1 whereas the COO- has a band in the region around 1570 cm-1 [16]. This splitting is not only observable in organic compounds, but also in carboxylic acids such as amino acids [17]. In Fig. (1), a decrease in the band attributable to the –COOH species concomitant with an increase in the –COO- band is shown in the glass ionomer Ketac. After band-narrowing, it was clearly seen that in the –COO- species band, two components appeared one hour after mixing. This new species may correspond to a band representing the polycarboxylate cross-linking with metal ions present in the cement mainly calcium, and aluminium. Therefore, the maturation process of the glass ionomer would be primarily a deprotonation and secondly the formation of a complex net in conjugation with ions released from the glass and present in the medium. Previous results showing only one acid-base process would agree with the results presented, but since no deconvolution was applied, the deprotonation and subsequent conjugation processes could not be separated. Furthermore, it seems that the hardening reaction measured as the ratio between the band in the region 1500-1600 cm-1 and the one in the region 1700-1800 cm-1, would stop before the material is completely set.
Applying the same mathematical treatment in the compomers two conclusions can be obtained from the data. First, the polyacid –modified composite needs water for the polymerization process to be carried out completely. Second, the polymerization process is not followed by an interconversion between unprotonated and protonated forms at least in the compomers studied. The band disappearing in the cross-linking reaction corresponds to C=C bonds arising from methacrylate monomers located at 1637 cm-1, and not to C=O bonds from carboxylic acids. Band reduction is concomitant with methacrylate polymerization as described previously [18]. The 1700-1750 cm-1 region corresponding to the COOH species undergoes changes in band shape and position, probably as a result of variations in the chemical interactions of this group with their surrounding, but not to –COOH/-COO- conversion, since intensity differences with the 1500-1600 cm-1 region do not occur. This result would indicate, contrary to some previously reported interpretations and in agreement with others [10] that the hardening is not an acid-base reaction, but rather a polymerization of the methacrylate component and cross-linking of the polymer with different species present in the glass component to form a molecular structure containing embedded and bonded filler particles [19]. From the band shape changes in the region 1700-1750 cm-1 observed in Fig. (4), the reaction seems to be rather complex at the beginning also with variations in peak position, indicating different –COOH populations until an equilibrium is reached with the band maximum similar in position to before irradiation but broader, being these changes in bandwidth indicative of a more complex rearrangement of the COOH groups. The broadening could be due to an aqueous dilution of the filling particles releasing different metal cations that could chelate with the polymer molecules [20]. This explanation would agree with the need for water to complete the reaction.
CONCLUSIONS
The use of infrared spectroscopy together with resolution enhancement techniques has been used to follow the hardening of two different materials used in dentistry, glass-ionomers and compomers.
From the results, it can be concluded that no acid-base reaction was observed as a hardening mechanism in the Hytac and Compoglass compomers. Furthermore, they may be lacking in the fluoride release inherent in such a reaction system. The short-term fluoride release process described for the modified polyacid composite resins can be ascribed to an initial leaching of fluoride from the glass particles in the material surface layer [21].The observed photo-activated polymerization mechanism indicates that this kind of material behaves more like a composite resin as previously noted by other authors [22].
On the other hand, the use of deconvolution allows the differentiation of two components in the carboxylate produced after the acid-base reaction corresponding to different polycarboxylate interactions.
ACKNOWLEDGMENTS
This work was supported in part by grant BFU2006-14423 from Ministerio de Ciencia e Innovación.

