All published articles of this journal are available on ScienceDirect.

Acid Resistance of the Enamel in Primary Second Molars from Children with Down Syndrome and Cerebral Palsy
Abstract
Objectives:
This study was carried out to evaluate the extent of differences in mineralization of inner and outer enamel of the lower primary second molars of children with Down syndrome (DS) and Cerebral Palsy (CP) as revealed by acid treatment of exfoliated teeth. The results were compared to those obtained from a control group of healthy children.
Methods:
The sample included 4 mandibular second molars from each group. On each tooth, a thin section was cut, bisecting the mesial cusps. The analysis was carried out on the mesio-buccal cusps. Atomic force microscopy (AMF) was used to analyze the morphological structure of the dental enamel after 10 sec of 0.1 mol% citric acid treatment. The measurements were performed on 3 points in the enamel close to the outer surface and 3 points in the enamel close to the dentin. The differences between groups were analyzed using Mann Whitney tests.
Results:
In controls and CP teeth the outer enamel was more resistant to etching than the inner enamel. In DS teeth both outer and inner enamel showed similar results for all parameters. Between group comparisons showed that roughness values were significantly higher (P<0.01) in DS teeth than in either controls or CP teeth. No significant differences were found between CP and control teeth.
Conclusions:
The higher values obtained for DS enamel reflect increased solubility of the enamel to acid relative to controls and CP teeth together with irregularity of the organic matrix. The practical importance of the results is that DS primary molars needs reduced etching time when prepared for pit and fissure sealants or composite/compomer restorations.
INTRODUCTION
It is well known that stress of sufficient severity to affect development leaves a permanent imprint on the teeth and its location reflects the timing and duration of such events [1].
Bio-mineralization of tooth enamel takes place in a highly structured organic matrix laid down by the ameloblasts and is divided into three stages classified as forming, maturing and mature [2-4], during which mineral content increases and the organic content decreases. Impaired ameloblast function will affect the quantity and integrity of the organic matrix and so affect the orientation and growth of the apatite crystals and subsequent degradation and removal of the organic matrix.
The primary second molars (DM2) are especially suitable for analysis of developmental disturbances. In those teeth, bio-mineralization of the mesio-buccal and mesio-lingual cusps begins at approximately 22 weeks in utero and in the disto-buccal and disto-lingual cusps at 26 weeks in utero and crown formation is completed 10 month after birth [5].
The influence of developmental insults on the bio-mineralization of mandibular primary second molars was studied by Keinan et al. [6] by comparing prenatal enamel formed to post natal enamel development. Their research showed that on the early formed mesial cusps the thickness of prenatal enamel was significantly reduced in Down syndrome and cerebral palsy compared to normal teeth. Furthermore, the Ca/P ratios were significantly higher in DS and CP teeth compared to normal controls, indicating reduced hydroxyapatite component in the enamel.
Primary teeth have higher Ca/P ratio than permanent teeth as a result of calcium bonded to other elements than phosphate [4]. It is well known that different calcium crystals in the enamel have different resistance to acid treatment [7, 8]. Other studies have shown correlation between Ca/P ratio and microhardness [9, 10].
Micromechanical properties of teeth were studied on permanent molars using micro-hardness test performed with Vickers and Knoop indenters. In sound human enamel, the hardness values, mineral content and density have been reported to gradually decrease from the outer surface to the dentino enamel junction (DEJ) [11-14].
Correlation between calcium content and microhardness of decalcified enamel was reported [12]. In etched enamel the microhardness values were at a lower level compared to untreated enamel. The change in microhardness of enamel has been correlated with decrease in calcium concentration after slow decalcification and etching [7, 8]. The hardness experiment indicates that the structure after etching is not comparable to that of a caries like lesion as a result of slow demineralization. Difference in the nano-mechanical properties between the enamel prisms and their surrounding sheaths of extracted third molars were reported [15]. The nanohardness of the enamel of third molars revealed differences between the tail of the rods and inter-rod enamel to that of the head of the rods- the values (Young’s moduli and hardness) for the head of the rods were higher. Those differences were attributed to changes in crystal orientation and the higher content of soft organic tissue [16].
On the basis of these results we propose that examination of the nanomechanical characteristics using atomic force microscopy (AFM) may reveal differences in the chemical composition and the enamel matrix of teeth from children with developmental disorders.
Down syndrome (DS) is caused by trisomy of the 21st chromosome. In those patients the postnatal growth and development are progressively impaired [17-21]. Dental anomalies previously reported range from hypodontia [22] to microdontia of the second deciduous molar and permanent teeth, although earlier forming primary teeth are larger than those of normal controls [19, 20], altered crown morphology [23, 24], and reduced enamel thickness [17, 18].
Cerebral palsy (CP) is a non-progressive defect of the central nervous system [25]. The vast majority of cases (85%) are congenital, but it is still unclear whether they result from developmental insults in utero, or during parturition [26-29]. A high frequency of enamel defects and a thickened neonatal line has been reported in this condition [26, 30].
In order to examine the extent of differences in quality of the enamel matrix, nano-roughness of the mesiobuccal cusps of primary lower second molars was evaluated by AFM analysis of the resistance of enamel to acid etching. This analysis was carried out by comparing the roughness measured at different areas of the enamel after polishing and acid treatment.
MATERIALS AND METHODS
This study was carried out on ground sections derived from exfoliated primary lower second molars. The teeth belonged to three groups: children with no adverse medical history (controls), children with DS, and children with CP. The sample comprised sections from 12 teeth, 4 from each group. The teeth were immersed in acrylate according to the protocol of Caropreso et al. [31], and a 200 micrometer thick section was obtained from each tooth using a standard procedure in which the section was made through the tips of the mesial cusps (mesiobuccal and mesiolingual) parallel to the long axis of the tooth, with a Beuhler isomet diamond wafering-blade saw. The sections were then polished using a 600 grit polishing paper to a thickness of 100-150 micrometers. The sections were immersed in citric acid (0.1 mol %) for 10 seconds, rinsed with water and dried at room temperature. The sections were then examined using an Atomic Force Microscope (AFM), (D3100, Nanoscope IVa, Veeco, Santa Barbara, CA, USA) in order to determinate the surface roughness of outer and inner areas of enamel. The topographic images (20μm X 20μm) were obtained in air in tapping mode using etched silicon probes (TESP, Veeco). On the mesiobuccal cusp tip of each section, three independent measurements were taken at standard locations on the inner and outer enamel (Fig. 1). Image roughness (Rq), Z range and surface area difference (%SA), were obtained from each location.
- Image roughness (Rq) - Root mean square average of height deviations taken from the mean image data plans.
- Image Z range - Maximum vertical distance between the highest and lowest data points in the image prior to the plane fit.
- Image surface area difference (%SA) - Difference between the image’s three-dimensional surface area and two-dimensional projected surface areas.
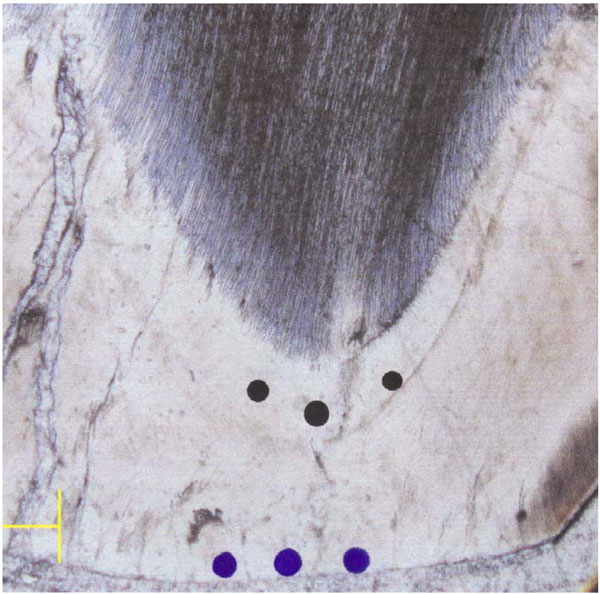
Location of the measurements points on the inner (prenatal) and outer (postnatal) aspects of enamel.
The differences between groups were analyzed statistically using Mann Whitney U tests.
RESULTS
The AFM images were obtained from the inner and from the outer aspect of the enamel of teeth from CP, DS and control children. The entire sample was polished to the same level; therefore differences in the roughness data indicate differences in the resistance of the enamel to acid treatment. Fig. (2) shows the topographic images of inner aspect of enamel from each group after acid treatment. The difference in architecture of the enamel in the three groups is clearly visible. Fig. (2A) shows the characteristic structure of enamel for normal teeth. The well-defined shape long rods with pronounced borders appear on the topographic image. The long extended rods are also observed on CP sample, Fig. (2B). In this case the borders of the rods are not so clearly defined. These structures cannot be observed on DS sample, in Fig. (2C). In comparison with two previous samples, the surface of DS samples shows marked irregularity.
Table 1 shows the mean Rq, Z range and %SA in the inner and outer enamel aspect of each set of measurements taken on each section for normal, CP and DS teeth.
Roughness Parameters (Mean for 3 Points and Range) Measured on the Inner and Outer Enamel of the Normal, CP and DS Primary Second Molars. Each Group Comprised of 4 Teeth
| Inner Enamel | Outer Enamel | |||||
|---|---|---|---|---|---|---|
| Rq | Z Range | %SA | Rq | Z Range | %SA | |
| Normal |
39.04 (23-52.1) |
283.11 (224-351) |
7.79 (3.37-13.5) |
29.70 (13.3-58.4) |
229.22 (103-367) |
10.20 (2.7-23.2) |
| CP |
32.00 (27.4-46.2) |
239.36 (202-299) |
8.98 (5.1-14.3) |
27.98 (11.2-54.1) |
207.08 (108-346) |
7.29 (3.2-15.4) |
| DS |
196.44* (140-235) |
1190.44* (822-1467) |
18.81* (6.8-30.7) |
189.2* (143-271) |
1242.1* (1020-1882) |
26.13* (7.26-70.3) |
Note: CP-cerebral palsy, DS- Down syndrome.
* = P value <0.01 compared to controls or CP.
Rq - Image roughness - Root mean square average of height deviations taken from the mean image data plans.
Z range - Maximum vertical distance between the highest and lowest data points in the image prior to the plane fit.
%SA - Image surface area difference - Difference between the image’s three-dimensional surface area and two dimensional projected surface areas.
In controls and DS, the average values for Rq and Z range were higher in the inner enamel, while %SA was higher in the outer enamel. In CP teeth, the average values for all parameters (Rq, Z range and SA%), were higher in the inner enamel compared to those at the outer aspect. For all measurements taken, increased range was observed in the outer enamel.
Both inner and outer enamel aspects of DS teeth showed higher values for all parameters analyzed (Rq, Z range and %SA) than either the controls or CP teeth, and the differences were significant statistically (P<0.01). The differences between CP and control teeth were not significant. The roughness pattern in DS teeth was twice to five times greater than that of controls or CP teeth.
Table 2 summarizes the ratio between outer and inner enamel aspects of each section for each set of measurements taken on normal, CP and DS teeth. For all groups the average ratio between inner to outer enamel was greater than 1, implicating greater roughness on the inner aspect after the acid treatment. In controls and CP teeth the inner enamel roughness was 35-56% greater than measured in the outer enamel. In DS teeth the differences between inner and outer enamel aspects were minimal (5-16%), showing similar roughness on both inner and outer enamel after acid treatment. The ratio of inner to outer enamel roughness in DS was significantly lower than that in controls or CP (P<0.01).
Ratios of the Different Roughness Parameters (Mean and Range) Calculated in the Outer and Inner Enamel Aspects for Normal, CP and DS Teeth
Note: CP-cerebral palsy, DS- Down syndrome.
* = P value <0.01 compared to controls or CP.
Rq - Image roughness - Root mean square average of height deviations taken from the mean image data plans.
Z range - Maximum vertical distance between the highest and lowest data points in the image prior to the plane fit.
%SA - Image surface area difference - Difference between the image’s three-dimensional surface area and two dimensional projected surface areas.
DISCUSSION
The roughness parameters measured in this research reveal the behavior of the primary second molar enamel to acid attack.
In the control group the ratios between inner and outer enamel values were positive for all parameters, implying that the resistance of the inner enamel to acid attack is less than that of the outer enamel. Several studies demonstrated the same pattern in permanent teeth [11-14]. The reduced resistance to acid treatment may be related to differences in the chemical composition, as the decreased resistance to acid attack follows increase in the enamel carbonate concentration [7, 8]. Robinson et al. [32] found that fluoride concentrations decreased from enamel surface to EDJ, while carbonate and magnesium concentrations increased (from 4-6% to 2%, and from 0.2% to 0.5% respectively).
Controls and CP teeth showed similar values, without any significant differences, and the resistance of both groups to acid was similar. The striking finding was that the results for DS molars were 3-5 times higher than controls or CP. The results for roughness showed that the microstructure of the hydroxyapatite in DS is different than that of CP and controls and that the resistance of DS primary teeth to acid attack was very low. This presumably was caused by the high concentration of calcium compounds, other than hydroxyapatite, as reported by Keinan et al. [6] in DS primary molars. The differences found in nano-roughness between the three groups can be observed in Fig. (2). This low resistance to acid attack in DS primary molars can be compared to hypomineralized regions in permanent teeth as measured by Mahoney et al. [33]. Al-Jawad et al. [34] have shown that changes in lattice parameters are primarily associated with changes in the chemical composition of the enamel in different regions of the tooth. Cuy et al. [14] demonstrated that the crystallographic and mechanical properties of enamel are closely linked.
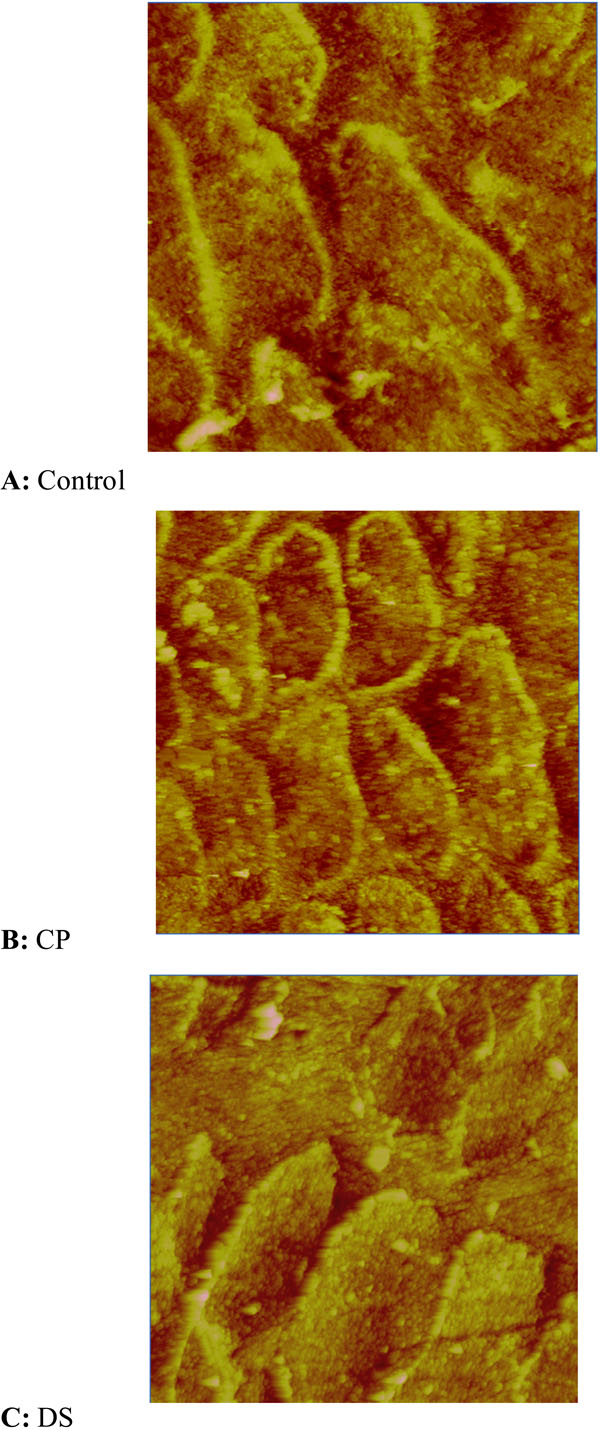
Prism pattern of the inner aspect of normal, CP and DS primary second molars after etching.
In a previous study, Keinan et al. [2006], showed impaired development and mineralization of lower primary second molars in DS and CP groups (Table 3). Their results showed that significantly less enamel was laid down prenatally in DS and CP teeth compared to the control group. Enamel biomineralization has been described as a “spontaneous assembly and hierarchial organization of birefringent microribbons” primarily composed of amelogenin that provides the three dimensional framework on which hydroxyapatite crystals assemble and aggregate [35]. The biomineralization of DS was poorer than that of controls (greater Ca/P ratio) but seemed better than that of CP. Based on the previous data, Keinan et al. [2006] the expectation was that DS teeth will show also roughness values between the controls and CP teeth, following the acid treatment. The results described in this paper showed that acid etching has significantly greater influence on the DS enamel. We found high irregularity in enamel surface morphology of DS samples following the acid attack, greater than those observed in controls and CP teeth. Those differences in nanostructure after etching may represent different prism pattern that influences acid sensitivity. Combining the data from the chemical analysis we may assume that DS primary molars showed the faster decalcification process, causing abnormal prism morphology and interprismal defects, with little or no relevance to the Ca/P ratios.
Mineral Content (Mean and Range) of the Mesial Cusps of Normal, DS and CP Primary Second Molars
Note: The data is from Keinan et al. 2006.
* = P value <0.05 compared to normal.
CONCLUSIONS
The effect of acid on the enamel of primary second molars of Down syndrome and CP children was compared to normal population. Although the primary molars of Down syndrome showed a better Ca/P ratio than that of CP teeth the results obtained in this study showed that in Down syndrome primary molars the enamel is softer probably due to calcium compounds other than hydroxyapatite. The practical importance of the results in dental practice is that the etching treatment in primary molars in DS should be reduced.

