All published articles of this journal are available on ScienceDirect.

Salivary Biomarkers and Pseudomonas aeruginosa Levels in Type 1 Diabetes with Periodontitis: An Uncontrolled State May Exacerbate Oral Inflammation
Abstract
Introduction
Periodontitis is a chronic inflammatory disease known to be more severe in individuals with diabetes. However, the specific impact of glycemic control in Type 1 Diabetes (T1D) on a comprehensive panel of oral inflammatory and stress biomarkers, alongside opportunistic pathogens like Pseudomonas aeruginosa, requires further elucidation. This study aimed to investigate the associations between glycemic control status in T1D patients with periodontitis and levels of salivary stress (cortisol, Chromogranin A [CgA], Salivary Alpha-Amylase [sAA]) and inflammatory (C-reactive protein [CRP], albumin) biomarkers, subgingival P. aeruginosa counts, and clinical periodontal parameters.
Methods
This cross-sectional study enrolled 116 adults who were divided into four equal groups (n=29 each): Uncontrolled T1D with Periodontitis (UC-T1D; HbA1c ≥ 6.5%), controlled T1D with Periodontitis (C-T1D; HbA1c < 6.5%), Non-Diabetics with Periodontitis (NP), and Non-Diabetics with Healthy Periodontium (NH). Salivary biomarkers were quantified using commercial ELISA kits. Subgingival P. aeruginosa bacterial loads were determined by real-time Polymerase Chain Reaction (PCR) targeting the oprL gene. Clinical periodontal parameters (PPD, CAL, PI, BOP) were recorded by a single calibrated examiner. Non-parametric tests (Kruskal-Wallis, Mann-Whitney U) were used for group comparisons, and Spearman's correlation was used to assess relationships.
Results
The UC-T1D group exhibited significantly higher salivary cortisol, CgA, sAA, CRP, and albumin levels, along with greater subgingival P. aeruginosa counts, compared to all other groups (all p<0.001). This group also presented with the most severe periodontal parameters (highest mean PPD, CAL, PI, and BOP%; p<0.001). Subgingival P. aeruginosa counts were significantly and positively correlated with salivary cortisol (r=0.52, p<0.01), CgA (r=0.48, p<0.01), CRP (r=0.67, p<0.001), and albumin (r=0.62, p<0.001).
Discussion
The findings indicated that an uncontrolled glycemic state in T1D is strongly associated with a heightened oral inflammatory and stress environment. The elevation of both HPA and SAM axis markers (cortisol, CgA, sAA) suggests that systemic physiological stress in uncontrolled T1D may contribute to oral inflammation. The parallel increase in salivary CRP and albumin confirms a state of local and systemic inflammation with compromised gingival vascular integrity. The higher burden of the opportunistic pathogen P. aeruginosa in the UC-T1D group suggests that poor glycemic control may create a favorable niche for its colonization, potentially exacerbating periodontal destruction. Study limitations include the cross-sectional design and focus on a single opportunistic pathogen.
Conclusion
Uncontrolled T1D is associated with significantly elevated salivary stress and inflammatory biomarkers, increased subgingival P. aeruginosa colonization, and more severe periodontitis. These findings underscore the critical importance of diligent glycemic management in T1D patients to mitigate oral inflammation and alter microbial profiles that contribute to the development of periodontal disease. Longitudinal studies are warranted to confirm these associations and explore causality.
1. INTRODUCTION
Periodontitis, a chronic inflammatory condition affecting the tissues supporting the teeth, remains a significant global health issue. Characterized by the progressive destruction of periodontal ligaments and alveolar bone, it can lead to tooth mobility, discomfort, and ultimately, tooth loss [1], thereby impacting chewing function, aesthetics, and the overall quality of life [2]. The disease often follows a pattern of exacerbations and remissions, sometimes resolving spontaneously but frequently causing irreversible damage [3]. Crucially, emerging evidence highlights intricate bidirectional links between periodontitis and various systemic conditions, underscoring the importance of oral health in overall wellness and the need for a holistic diagnostic and therapeutic approach [4].
Among the systemic conditions strongly associated with periodontitis is diabetes mellitus. Individuals managing diabetes, particularly those experiencing challenges with glycemic control, face an elevated risk of developing periodontitis and suffering more severe consequences [5]. Type 1 Diabetes (T1D), characterized by autoimmune destruction of pancreatic beta cells leading to absolute insulin deficiency, often presents unique challenges due to its typical onset in younger individuals and the lifelong dependence on exogenous insulin for managing blood glucose levels [6]. This dependency can lead to significant glycemic variability, which may further complicate inflammatory responses. While the link between diabetes (broadly) and periodontitis is well-established, the specific impact of varying glycemic control within the T1D population on the oral inflammatory environment, including specific microbial and biomarker profiles, warrants more focused investigation compared to the more extensively studied Type 2 Diabetes. The hyperglycemic state common in poorly controlled diabetes disrupts immune cell function (e.g., impaired neutrophil activity), promotes a pro-inflammatory cytokine profile, and impairs wound healing. This collectively exacerbates periodontal tissue destruction and creates a detrimental cycle of persistent inflammation and delayed repair, accelerating disease progression [7-9].
The oral cavity hosts a complex polymicrobial community. While classical pathogens, such as Porphyromonas gingivalis, are strongly implicated in periodontitis, the role of opportunistic pathogens in disease modulation, especially under conditions of systemic compromise like diabetes, is increasingly recognized. Pseudomonas aeruginosa, a Gram-negative bacillus known for its virulence factors and ability to thrive in diverse environments, is typically considered an opportunistic pathogen [10]. While not traditionally classified as a primary periodontal pathogen, its presence has been noted in subgingival plaque, and it possesses mechanisms that can induce inflammation and contribute to tissue damage [11]. Notably, P. aeruginosa infections are frequently associated with immunocompromised states. Given that poorly controlled diabetes impairs immune function [7, 8], investigating the levels of P. aeruginosa in the subgingival environment of T1D patients with varying glycemic control may provide insight into whether this opportunistic bacterium flourishes and contributes to the exacerbated periodontal destruction observed in this population. Therefore, this study specifically quantified P. aeruginosa not as the sole causative agent, but as a potential indicator or contributor to the altered microbial ecology and inflammatory state associated with poor glycemic control in T1D.
Traditional periodontal assessments, including clinical examinations and probing depths, provide valuable information about existing tissue destruction [12], but may not fully capture the underlying biological activity or the influence of systemic factors, such as glycemic control and stress responses [13]. Saliva-based biomarkers offer a non-invasive window into the local oral and systemic physiological state, reflecting levels of stress, inflammation, and potentially microbial activity [14]. Analyzing specific salivary markers in individuals with T1D and periodontitis could reveal crucial details about disease severity, the impact of glycemic management, and potential therapeutic targets [15]. For this study, a panel of biomarkers representing key physiological axes was selected. Salivary cortisol, the primary Glucocorticoid Hormone, Was Chosen As A Classical Indicator Of Hypothalamic-Pituitary-Adrenal (HPA) axis activation and chronic stress, which can modulate immune responses [16, 17]. CgA and sAA were selected as markers of the Sympathetic Nervous System (SNS) and Sympathoadrenal Medullary (SAM) axis activity [18]. CgA is co-released with catecholamines [19], while sAA activity reflects rapid SNS responses to stressors [16, 20]. To assess inflammation, the C-Reactive Protein (CRP), a systemic acute-phase reactant, was measured in saliva, as it can reflect both systemic inflammation common in diabetes and potentially local gingival inflammation spillover [21, 22]. Finally, salivary albumin, typically present at low levels, was chosen because its elevation indicates increased gingival crevicular fluid leakage due to compromised vascular integrity and local inflammation within the periodontal tissues [23, 24]. Evaluating this combination of stress and inflammatory markers provides a more comprehensive understanding of the complex interplay between systemic factors, such as diabetes and stress, and local periodontal factors [25].
Therefore, while the link between diabetes and periodontitis is established, this study is among the first in our specific population (Iraqi T1D patients) to simultaneously investigate the interplay between glycemic control status, a comprehensive panel of selected salivary stress and inflammatory biomarkers, the quantitative levels of the opportunistic pathogen P. aeruginosa, and clinical periodontal parameters. This multi-faceted approach aimed to provide a more nuanced understanding of how poor glycemic control in T1D might distinctly shape the oral microenvironment.
2. MATERIALS AND METHODS
2.1. Study Design and Participants
This cross-sectional clinical study was conducted at the Diabetic Department of Al-Sader Hospital in Najaf, Iraq, between January 2022 and July 2023. A total of 116 adult participants, aged 18 years or older, were recruited and categorized into four groups based on their diabetic status and periodontal health:
2.1.1. Uncontrolled Type 1 Diabetic with Periodontitis (UC-T1D)
Participants with type 1 diabetes mellitus and an HbA1c level ≥ 6.5% who exhibit at least two teeth with a Pocket Depth (PD) of 4 mm and a positive Bleeding On Probing (BOP) response. (n=29).
2.1.2. Controlled Type 1 Diabetic with Periodontitis (C-T1D)
Participants with type 1 diabetes mellitus and an HbA1c level < 6.5%, exhibiting at least two teeth with a PD of 4 mm and a positive BOP. (n=29).
2.2. Sample Size
The sample size was determined using a power analysis (G*Power software) with a desired power of 80%, an alpha level of 0.05, and an estimated effect size of 0.5 (considered a medium effect size) based on previous research [13]. This analysis indicated that a minimum sample size of 29 per group was required to detect a statistically significant difference in mean pocket depth between the groups.
2.3. Inclusion and Exclusion Criteria
2.4. Periodontal Assessment
Periodontal disease status was evaluated at four sites per tooth (mesiobuccal, labial/buccal, distobuccal, lingual/palatal) using a UNC-15 probe (Hu-Friedy's, USA). All periodontal examinations were performed by a single calibrated examiner (S.M.I.). The following parameters were measured:
2.4.1. Pocket Depth (PD)
Measured as the distance from the gingival margin to the base of the periodontal pocket in millimeters.
2.4.2. Clinical Attachment Loss (CAL)
Measured as the distance from the cementoenamel junction to the base of the periodontal pocket in millimeters.
2.4.3. Plaque Index (PI)
Assessed using the Silness and Löe plaque index [26], which remains a foundational and widely utilized method for quantifying supragingival plaque.
2.5. Saliva Collection and Analysis
Unstimulated whole saliva samples were collected in the morning between 8:00 am and 11:00 am from all participants using the spitting method. Participants were instructed to rinse their mouths with water to remove food debris, sit still for six minutes, and avoid chewing or speaking until the saliva sample was collected. The samples were stored in sterile, plain bottles and immediately transported to the laboratory in an ice pack at 4°C, then frozen at or below -20°C [27].
According to the manufacturer's instructions, the following salivary markers were analyzed using commercially available Enzyme-Linked Immunosorbent Assay (ELISA) kits (Monobind Inc., Lake Forest, CA, USA). These kits are validated for use with saliva samples; their use with saliva is supported by literature, and appropriate sample processing protocols were followed as per manufacturer guidelines:
2.5.1. Salivary Cortisol
Cortisol levels were measured using a Ruthenium complex-labeled cortisol derivative and a cortisol-specific biotinylated antibody [28].
2.5.2. Salivary Chromogranin A (CgA)
CgA levels were determined using a sandwich enzyme-linked immunosorbent assay (ELISA) technique [29].
2.5.3. Salivary Alpha-amylase (sAA)
sAA was extracted from oral fluid using an amylase-removing device, eluted from a potato starch matrix, and analyzed using a standard assay [30].
2.5.5. Salivary Albumin
Albumin levels were estimated using the Bromocresol Green (BCG) dye method [32].
2.6. Subgingival Plaque Sampling and P. Aeruginosa Quantification
Subgingival plaque samples were collected from the deepest pocket in each quadrant using sterile paper points. Each paper point was inserted into the base of the pocket for 20 seconds. The four paper points from each participant were pooled into a single vial containing Reduced Transport Fluid (RTF). Samples were processed for DNA extraction and real-time PCR within one hour of collection [1, 9].
2.7. Real-time PCR for P. Aeruginosa Quantification
Bacterial chromosomal DNA was extracted from the pooled subgingival plaque samples using the QIAamp DNA Mini Kit (Qiagen, Hilden, Germany) according to the manufacturer's protocol for Gram-negative bacteria.
The quantification of P. aeruginosa was performed using a commercial real-time PCR kit (Microis Co., Ltd., Seoul, Korea) on a Bio-Rad CFX96 Real-Time PCR Detection System (Bio-Rad Laboratories, Hercules, CA, USA). Standard PCR laboratory practices were implemented to prevent cross-contamination, including using separate pre- and post-PCR work areas, dedicated micropipettes with aerosol-resistant filter tips, and regular decontamination of surfaces. Each PCR run included No-Template Controls (NTCs) to monitor for contamination and positive controls (derived from the provided DNA standard) to ensure the validity of the amplification process. The kit utilized specific primers and a probe targeting the oprL gene, which is highly specific to P. aeruginosa. Amplification was performed according to the manufacturer's recommended cycling conditions, typically consisting of an initial polymerase activation step at 95°C for 10 minutes, followed by 40 cycles of denaturation at 95°C for 15 seconds and combined annealing and extension at 60°C for 60 seconds. Fluorescence data were collected during the annealing and extension steps.
Quantification was based on the Cycle threshold (Ct) values obtained. Absolute quantification was performed using a standard curve method. The standard curve was generated using serial dilutions (e.g., 10^7 to 10^1 copies/reaction) of a provided DNA standard containing a known concentration of the P. aeruginosa oprL target sequence, which was run in parallel with the clinical samples. The bacterial load was determined by comparing the sample Ct values to the standard curve using the PCR instrument's software (e.g., Bio-Rad CFX Maestro Software). Results were calculated based on the initial sample processing volumes and DNA elution volume. Finally, they expressed the number of P. aeruginosa cells per microliter (log10 cells/µL) of the original sample, assuming a single copy of the oprL gene per P. aeruginosa cell, as per standard conversion practices referenced by the kit manufacturer [33]. An example of an amplification plot is shown in Fig. (1).
2.8. Statistical Analysis
Data were analyzed using the Statistical Package for Social Sciences (SPSS) version 23.0 for Windows. Descriptive statistics were calculated for all variables. Non-parametric tests, including the Kruskal-Wallis test and the Mann-Whitney U test, were used to compare salivary marker levels, P. Aeruginosa counts, and periodontal parameters among the four groups. Spearman's rank correlation coefficient was used to assess the relationships between salivary markers and P. Aeruginosa counts. Statistical significance was set at p < 0.05.
3. RESULT
3.1. Participant Characteristics and Baseline Periodontal Status
The demographic characteristics, including age and gender distribution, were comparable across the four groups, with no statistically significant differences observed (p = 0.345 for age, p = 0.789 for gender; Table 1, Fig. 2). As expected based on group definitions, HbA1c levels were significantly higher in the UC-T1D group (Mean 8.1%, SD 1.2) compared to the C-T1D group (Mean 5.8%, SD 0.8) (p<0.001; Table 1).
Baseline periodontal parameters showed significant differences among the groups, reflecting their defined health status (Table 2). The UC-T1D group exhibited significantly worse periodontal health compared to all other groups, demonstrating the highest mean Pocket Depth (PD) (5.2 ± 1.3 mm), Clinical Attachment Loss (CAL) (4.8 ± 1.5 mm), Plaque Index (PI) (2.3 ± 0.6), and percentage of sites with Bleeding on Probing (BOP) (83%) (all p<0.001). The C-T1D group also exhibited significantly worse periodontal parameters than the NP and NH groups, although generally less severe than those of the UC-T1D group (Table 2). The NH group displayed parameters consistent with periodontal health, serving as the baseline control (all p<0.001 compared to the periodontitis groups).
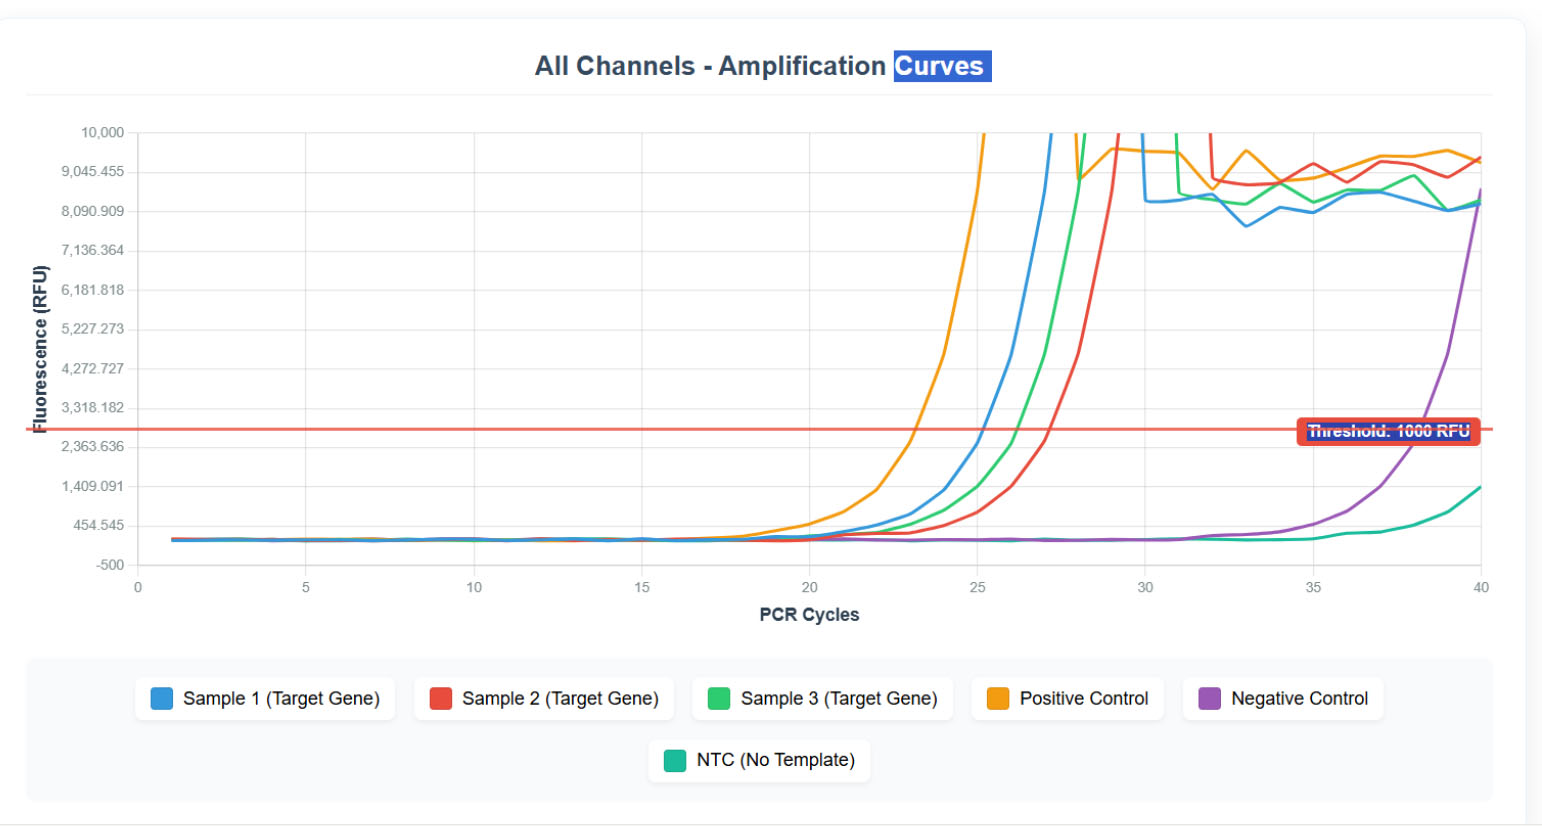
Real-time PCR amplification plot.
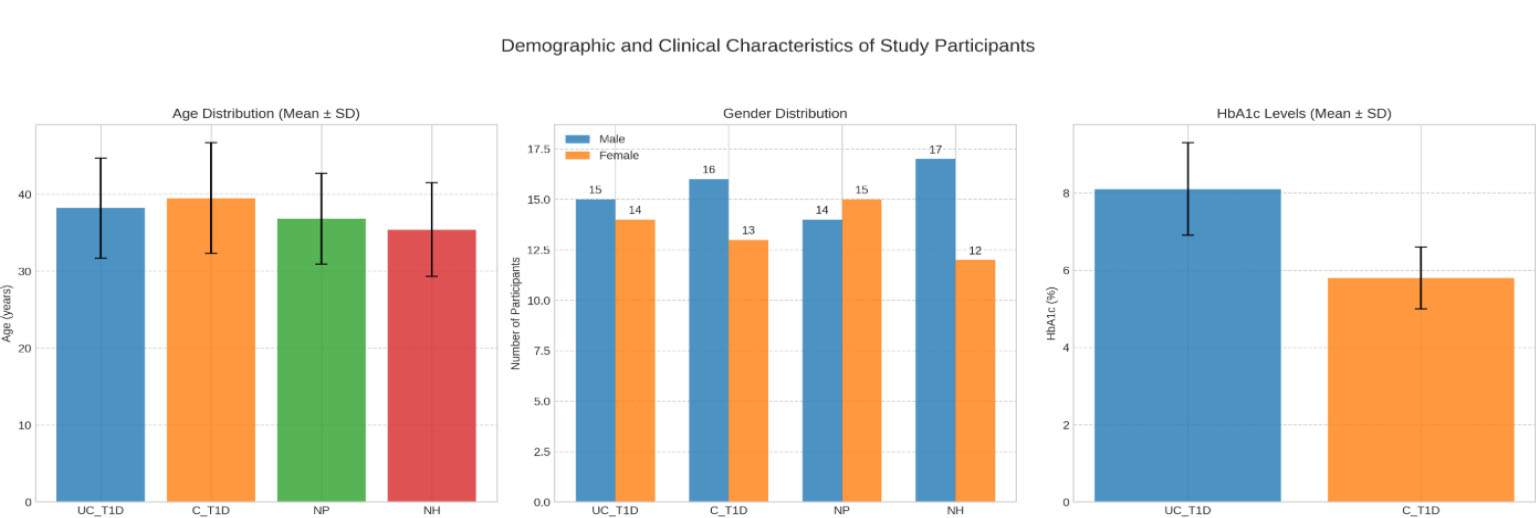
Demographic and clinical characteristics of study participants across different groups.
| Variable | UC-T1D (n=29) Mean (SD) | C-T1D (n=29) Mean (SD) | NP (n=29) Mean (SD) | NH (n=29) Mean (SD) | p-value |
|---|---|---|---|---|---|
| Age (years) | 38.2 (6.5) | 39.5 (7.2) | 36.8 (5.9) | 35.4 (6.1) | 0.345 |
| Gender (Male/Female) | 15/14 | 16/13 | 14/15 | 17/12 | 0.789 |
| HbA1c (%) | 8.1 (1.2) | 5.8 (0.8) | N/A | N/A | <0.001* |
| Parameter |
UC-T1D (n=29) Mean (SD) |
C-T1D (n=29) Mean (SD) |
NP (n=29) Mean (SD) |
NH (n=29) Mean (SD) |
p-value |
|---|---|---|---|---|---|
| PD (mm) | 5.2 (1.3) | 4.6 (1.1) | 3.9 (0.9) | 2.1 (0.5) | <0.001* |
| CAL (mm) | 4.8 (1.5) | 4.1 (1.2) | 3.4 (0.8) | 1.2 (0.4) | <0.001* |
| PI | 2.3 (0.6) | 2.0 (0.5) | 1.7 (0.4) | 0.8 (0.3) | <0.001* |
| BOP% | 83% | 72% | 62% | 24% | <0.001* |
| Variable |
UC-T1D (n=29) Mean (SD) |
C-T1D (n=29) Mean (SD) |
NP (n=29) Mean (SD) |
NH (n=29) Mean (SD) |
p-value |
|---|---|---|---|---|---|
| Cortisol (ng/mL) | 15.2 (3.8) | 12.1 (2.9) | 10.5 (2.1) | 8.7 (1.5) | <0.001* |
| CgA (ng/mL) | 10.8 (2.7) | 8.5 (1.9) | 7.2 (1.6) | 5.9 (1.2) | <0.001* |
| sAA (U/mL) | 125 (35) | 108 (28) | 95 (20) | 82 (15) | <0.001* |
| CRP (ng/mL) | 12.3 (3.1) | 9.7 (2.5) | 8.1 (1.8) | 6.4 (1.3) | <0.001* |
| Albumin (mg/dL) | 18.5 (4.2) | 15.6 (3.7) | 13.2 (2.9) | 10.8 (2.2) | <0.001* |
| Variable |
UC-T1D (n=29) Mean (SD) |
C-T1D (n=29) Mean (SD) |
NP (n=29) Mean (SD) |
NH (n=29) Mean (SD) |
p-value |
|---|---|---|---|---|---|
| P.aeruginosa Count (log10 cells/µL) | 6.8 (1.2) | 5.9 (1.0) | 5.2 (0.8) | 4.1 (0.6) | <0.001* |
3.2. Salivary Biomarker Levels
Analysis of salivary biomarkers revealed significantly different levels across the study groups (Table 3, Fig. 3). The UC-T1D group consistently demonstrated the highest levels for all measured stress and inflammatory markers. Specifically, mean salivary cortisol (15.2 ± 3.8 ng/mL), chromogranin A (10.8 ± 2.7 ng/mL), alpha-amylase (125 ± 35 U/mL), C-reactive protein (CRP) (12.3 ± 3.1 ng/mL), and albumin (18.5 ± 4.2 mg/dL) were significantly elevated in the UC-T1D group compared to the C-T1D, NP, and NH groups (Kruskal-Wallis test, p<0.001 for all biomarkers). Post-hoc analyses confirmed significant differences between most group pairings, generally showing a trend of UC-T1D > C-T1D > NP > NH (Table 3).
3.3. Subgingival Pseudomonas aeruginosa Levels
Quantification of Pseudomonas aeruginosa in subgingival plaque samples also revealed significant differences between the groups (Table 4, Fig. 4). The highest mean bacterial load was observed in the UC-T1D group (6.8 ± 1.2 log10 cells/µL). This level was significantly higher than that found in the C-T1D group (5.9 ± 1.0 log10 cells/µL), the NP group (5.2 ± 0.8 log10 cells/µL), and the NH group (4.1 ± 0.6 log10 cells/µL) (Kruskal-Wallis test, p<0.001). Post-hoc analyses indicated significant differences between all group comparisons (Table 4).
3.4. Correlations between Salivary Markers, P. aeruginosa Count, and Periodontal Parameters
To examine the associations between measured variables in all participants, Spearman rank correlation analyses were performed (Tables 5 and 6). Significant positive correlations were found between subgingival P. aeruginosa values and all measured salivary biomarkers (Table 5). In particular, moderate positive correlations were found between P. aeruginosa levels and the stress markers salivary cortisol (r = 0.52, p < 0.01) and chromogranin A (r = 0.48, p < 0.01). Stronger positive correlations were found between P. aeruginosa levels and salivary inflammatory markers CRP (r = 0.67, p < 0.001) and albumin (r = 0.62, p < 0.001). A significant moderate positive correlation was also found between P. aeruginosa and salivary α-amylase (r = 0.39, p < 0.05).
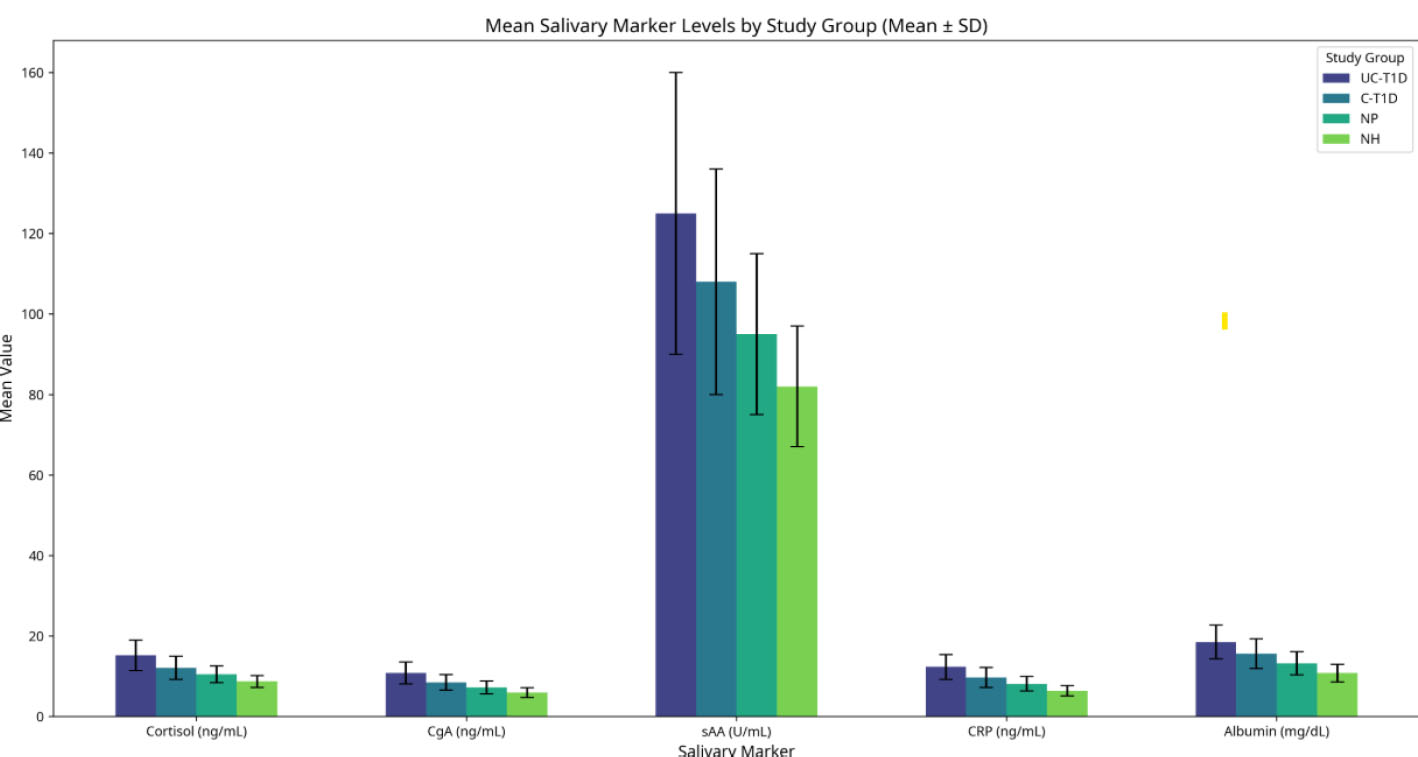
Salivary markers across different study groups.
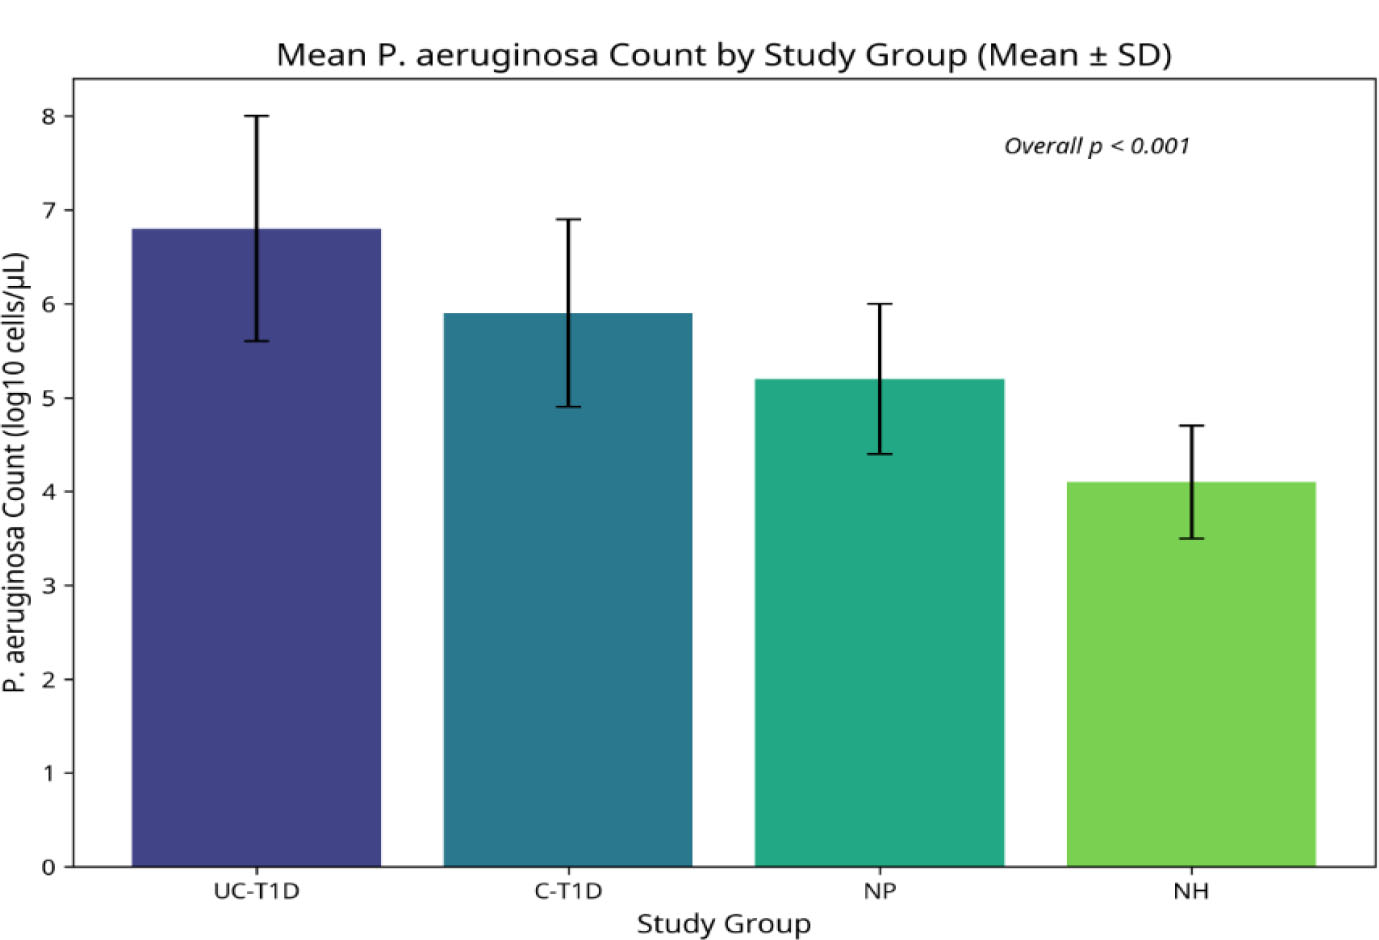
Pseudomonas aeruginosa count in study groups with different diabetic status and periodontal health.
| Salivary Marker | Correlation Coefficient (r) | p-value |
|---|---|---|
| Cortisol | 0.52 | <0.01** |
| CgA | 0.48 | <0.01** |
| sAA | 0.39 | <0.05* |
| CRP | 0.67 | <0.001*** |
| Albumin | 0.62 | <0.001*** |
| Salivary Marker | (PD) r (p-value) | (CAL) r (p-value) | (PI) r (p-value) | (BOP) r (p-value) |
|---|---|---|---|---|
| Cortisol | 0.54*** (p < 0.001) | 0.51*** (p < 0.001) | 0.42*** (p < 0.001) | 0.61*** (p < 0.001) |
| CgA | 0.48*** (p < 0.001) | 0.45*** (p < 0.001) | 0.36*** (p < 0.001) | 0.57*** (p < 0.001) |
| sAA | 0.39** (p < 0.01) | 0.35** (p < 0.01) | 0.29* (p = 0.002) | 0.45*** (p < 0.001) |
| CRP | 0.67*** (p < 0.001) | 0.65*** (p < 0.001) | 0.58*** (p < 0.001) | 0.72*** (p < 0.001) |
| Albumin | 0.62*** (p < 0.001) | 0.60*** (p < 0.001) | 0.52*** (p < 0.001) | 0.69*** (p < 0.001) |
Furthermore, significant positive correlations were observed between all salivary biomarkers and the severity of periodontal parameters, indicating that higher biomarker levels were associated with worse periodontal health (Table 6). Salivary CRP and albumin demonstrated strong positive correlations with Pocket Depth (PD) (r=0.67 and r=0.62, respectively; p<0.001), Clinical Attachment Loss (CAL) (r=0.65 and r=0.60, respectively; p<0.001), Plaque Index (PI) (r=0.58 and r=0.52, respectively; p<0.001), and Bleeding on Probing (BOP) (r=0.72 and r=0.69, respectively; p<0.001). Salivary cortisol and chromogranin A also exhibited moderate-to-strong positive correlations with all four periodontal parameters, with r values ranging from 0.36 to 0.61 and all p values < 0.001. Salivary alpha-amylase showed statistically significant positive correlations with all periodontal parameters, although generally weaker than the other biomarkers, PD (r=0.39, p<0.01), CAL (r=0.35, p<0.01), PI (r=0.29, p=0.002), and BOP (r=0.45, p<0.001).
Within the biomarkers themselves, a strong positive correlation was observed between salivary CRP and albumin levels (r = 0.78, p < 0.001), consistent with their roles as inflammatory markers.
4. DISCUSSION
This cross-sectional study, investigating the intricate relationship between salivary biomarkers, P. aeruginosa levels, and periodontal parameters in patients with type 1 diabetes mellitus, revealed a significant association between uncontrolled diabetes and an exacerbated inflammatory state within the oral environment. The results demonstrated the potential for uncontrolled diabetes to contribute to the development and progression of periodontitis, underscoring the importance of strict glycemic control and early intervention for optimal oral health in diabetic individuals.
The study enrolled 116 participants, carefully distributed across four groups (Table 1). Importantly, the groups were relatively homogenous in terms of age and gender, minimizing the influence of these confounding factors on our results. The significant difference in HbA1c levels between the uncontrolled and controlled diabetic groups (p<0.001) confirmed the effectiveness of our grouping strategy and allowed us to directly assess the impact of glycemic control on the parameters of interest [34].
The significantly elevated levels of salivary stress and inflammatory biomarkers in the UC-T1D group compared to C-T1D, NP, and NH groups are particularly noteworthy. The concurrent elevation of salivary cortisol, Chromogranin A (CgA), and Salivary Alpha-Amylase (sAA) in individuals with uncontrolled T1D points to heightened activity of the Hypothalamic-Pituitary-Adrenal (HPA) axis and the Sympathetic Nervous System (SNS)/Sympathoadrenal Medullary (SAM) axis. This indicates increased physiological stress, which is often associated with poor metabolic control and can, in turn, modulate immune responses and exacerbate inflammation [35-38]. Elevated sAA levels, an enzyme involved in starch digestion found in saliva, further support the idea of increased stress and sympathetic activity, hinting at an impact on oral health in uncontrolled diabetes [39]. Simultaneously, the increased salivary C-Reactive Protein (CRP) and albumin levels in this group reflect both systemic inflammation—a hallmark of uncontrolled diabetes—and increased local oral inflammation with gingival crevicular fluid leakage due to compromised vascular integrity within periodontal tissues [40]. This pattern suggests that poor glycemic control in T1D contributes to a pro-inflammatory oral microenvironment, likely aggravated by systemic stress responses [41]. The significantly higher P. Aeruginosa counts observed in the uncontrolled diabetic group, compared to all other groups, reinforce the role of this key periodontopathogen in the pathogenesis of periodontitis, particularly in individuals with uncontrolled diabetes. This finding aligned with previous research suggesting that P. Aeruginosa is a potent inflammatory agent that can exacerbate periodontal disease [10]. The data indicated that uncontrolled diabetes might create an environment that favors the growth and activity of P. Aeruginosa, potentially accelerating periodontal breakdown [42, 43].
The uncontrolled diabetic group showed higher levels of P. Aeruginosa compared to other groups, highlighting the important role of this key periodontal bacterium in causing gum disease, especially in individuals with uncontrolled diabetes [44, 45]. Controlling blood glucose levels might reduce the pro-inflammatory environment that favors the growth and activity of P. Aeruginosa [46]. Periodontal screening and early intervention are essential for diabetic patients, particularly those with uncontrolled blood sugar [43, 45]. These findings suggested that a panel of salivary biomarkers could, with further validation and standardization, serve as a non-invasive tool for chair-side risk assessment or monitoring of oral inflammatory status in T1D patients. Such tools could help identify individuals requiring more intensive periodontal care or those whose glycemic control might be impacting their oral health, thereby facilitating more personalized management strategies [47]. Antibacterial therapies targeting P. Aeruginosa and other periodontal pathogens might be beneficial in managing periodontitis in diabetic patients, helping to control the bacterial load and reduce inflammation [9].
5. LIMITATIONS
It is important to acknowledge the limitations of this study. The study's design makes it challenging to establish a connection between diabetes, salivary markers, P. Aeruginosa, and the development of disease. Additionally, the small sample size and reliance on a hospital for participants may hinder the generalizability of these findings. The focus on P. aeruginosa alone means that the contributions of other established periodontal pathogens, such as Porphyromonas gingivalis, Tannerella forsythia, and Treponema denticola, as well as the broader shift in the subgingival microbiome (dysbiosis), were not assessed. The recruitment of participants from a single hospital center may limit the generalizability of these findings to the broader population of individuals with T1D and periodontitis.
6. FUTURE DIRECTIONS
Future longitudinal studies are crucial to establish causality and to track changes in these biomarkers and microbial profiles in response to periodontal therapy and improved glycemic control. Exploring the utility of serial salivary biomarker measurements could help monitor treatment efficacy or identify T1D patients at higher risk for periodontal disease progression, potentially guiding the tailoring of preventive and therapeutic interventions. Comprehensive microbiome analyses (e.g., 16S rRNA sequencing) would also provide a complete picture of the dysbiotic shifts beyond P. aeruginosa alone.
CONCLUSION
This study provided evidence of a connection between managed T1D and higher levels of stress, inflammation, and P. Aeruginosa in the oral cavity. These findings emphasized the importance of regulating blood sugar levels and identifying and addressing the disease early in people with diabetes. Further research is needed to investigate the underlying mechanisms and develop targeted treatment strategies for managing the interplay between overall health and oral health.
AUTHORS’ CONTRIBUTIONS
The authors confirm their contribution to the paper as follows: S.M.I.: Study conception and design; A.M.K., M.N.H.: Data collection. All authors reviewed the results and approved the final version of the manuscript.
LIST OF ABBREVIATIONS
| T1D | = Type 1 Diabetes |
| PLI | = Plaque Index |
| PD | = Pocket Depth |
| CAL | = Clinical Attachment Loss |
| BOP | = Bleeding on Probing |
| CgA | = Chromogranin A |
| sAA | = Salivary Alpha-Amylase |
| CRP | = C-Reactive Protein |
| NTC | = No-Template Control |
| Ct | = Cycle Threshold |
| HbA1c | = Glycated Hemoglobin |
| UC-T1D | = Uncontrolled Type 1 Diabetic with Periodontitis |
| C-T1D | = Controlled Type 1 Diabetic with Periodontitis |
| NP | = Non-Diabetic with Periodontitis |
| NH | = Non-Diabetic with Healthy Periodontium |
ETHICS APPROVAL AND CONSENT TO PARTICIPATE
This study was approved by the Ethical Committee of the College of Dentistry, University of Kufa (Reference number 4367, dated June 24, 2022).
HUMAN AND ANIMAL RIGHTS
All procedures performed in studies involving human participants were in accordance with the ethical standards of the institutional and/or research committee and with the 1975 Declaration of Helsinki, as revised in 2013.
CONSENT FOR PUBLICATION
Informed consent was obtained from all participants prior to their enrollment.
AVAILABILITY OF DATA AND MATERIALS
All data generated or analyzed during this study are included in this published article.
ACKNOWLEDGEMENTS
The authors appreciate the assistance and resources provided by the Department of Periodontics at the College of Dentistry in Baghdad.

