All published articles of this journal are available on ScienceDirect.

Designing and Validating New Instruments to Measure Patient Satisfaction Regarding Removable Dentures (Hindi Version)
Authors Info & Affiliations
Abstract
Introduction
There is a need for affordable dental treatment modalities like removable dentures (RDs). This study aimed to assess the validity and reliability of newly developed instruments (questionnaires and indices) in Hindi to measure patient satisfaction with all types of RDs.
Methods
Phase one involved the translation of validated and tested German instruments in Hindi, followed by backward translation. Phase two involved testing the face validity of the pilot questionnaires through 3 rounds of cognitive interviews with 13 participants. Trained examiners conducted the interviews in the presence of an external observer. Phase three involved distributing 291 questionnaires to 179 participants. A total of 178 questionnaires were completed by the participants after one week but not more than three weeks. Construct validity was evaluated using factor analysis. The reliability and appropriateness of the items in the indices were assessed using the intraclass correlation coefficient and Cronbach's alpha.
Results
The upper and lower jaw questionnaires had good face validity. Cronbach's alpha scores showed excellent reliability and consistency. The intraclass correlation coefficient values fell within the range of 0.72 to 0.95, indicating “moderate” to “excellent” reliability.
Discussion
The developed Hindi versions of the upper and lower jaw questionnaires and indices to study patient satisfaction with RDs were valid and reliable. These questionnaires can be applied in the clinical setting to test patient satisfaction with removable dentures. They can be used for research and can be integrated into routine patient assessment. Based on patient satisfaction, treatment modifications can be done in the follow-up visits. Further studies can be conducted to include more samples from various populations.
Conclusion
Patient satisfaction outcome measures are the most frequently used subjective assessments for dental treatments in clinical dentistry. The Hindi version of the upper and lower jaw questionnaire and index shows valid and reliable outcomes. This questionnaire can be used to measure patient satisfaction with all types of removable dentures and can be used for routine patient assessment.
1. INTRODUCTION
According to the US Census Bureau, India has officially exceeded all nations globally in terms of population [1]. The demand for prosthodontics treatment has clearly been influenced by the significant population growth in the country in the last decades, highlighting the urgent requirement for affordable dental treatment modalities like removable dentures (RDs) [2]. The continuous demand for RDs, complete or partial dental prostheses, can be attributed to several factors, including the increase in life expectancy and the increase in the country's senior population, as well as the relative ease of maintenance and repair, affordability, flexibility, and noninvasiveness of RDs [3-5]. A retrospective study that reported the factors affecting the continued use of removable partial dentures (RPDs) and the level of patient satisfaction with RPDs revealed that 39% of the RPDs were no longer in use after five years [6]. A recent service evaluation report that focused on patient satisfaction with complete dentures revealed that only 39% of the patients were satisfied with the fit of the lower complete denture [7]. Hence, it is crucial to pinpoint the factors linked to satisfaction, and researchers have suggested conducting additional studies in which patient satisfaction is the main focus in evaluating treatments [8, 9]. Moreover, there is a need for a deeper understanding of which aspects of patient satisfaction signify successful treatment outcomes [8, 9]. Various factors influence the perception of prosthetic dental treatment and esthetics, such as social environment, education, or cultural background [10]. Several social and cultural factors can indirectly influence patients’ perceptions of treatment outcomes [11]. These factors are literacy, culture, emotions, attitudes, socioeconomic status, and cultural beliefs. It showed that cultural beliefs may be deeply ingrained in certain tribes or ethnicities that may divert the perception of an individual toward health, well-being, quality of life, etc [12].
Healthcare professionals can ask patients for their feedback regarding satisfaction through different means such as phone surveys, written surveys, focus groups, computer-assisted personal interviews, or personal interviews [13, 14]. However, many practitioners find written surveys and self-administered questionnaires to be the most practical and dependable options, considering that they are cost-effective, self-administered, trustworthy, and easy to administer to large groups, thereby enabling more data collection in a short time [13, 15].
The importance of patient-centered care in dentistry has increased in recent years, as it is associated with higher levels of patient satisfaction and a decrease in instances of legal proceedings [16, 17]. Implementing patient-centered care requires building a team between dentists and patients, giving importance to the choices, requirements, and beliefs of the patients during treatment. This includes communication, making decisions together, and offering customized care based on each patient’s situation [16, 17]. Before asking patients to share their thoughts through a questionnaire, it is important to assess the psychometric properties of self-administered questionnaires or indices. These psychometric properties demonstrate the reliability and validity of the tools/instruments [18]. Because the instruments are measuring a subjective experience and interpretations may differ depending on individual perspectives, the collected data can be questionable and need to be tested and proved to be valid and reliable [18, 19].
While patient satisfaction is a crucial aspect, our search of the dental literature did not yield a reliable and valid instrument in the Hindi language for assessing patient satisfaction with RDs. This study aimed to assess the reliability and validity of newly developed instruments in Hindi designed to measure patient satisfaction with RDs. The Hindi versions were derived from reliable and validated German instruments [19].
2. MATERIALS AND METHOD
2.1. Study Design and Study Subjects
This is a descriptive crossectional study done from July 2022 to March 2023. This study complied with the guidelines of the World Medical Association’s Declaration of Helsinki. Approval (Reference number: D-F-H-18-Oct) for the study was obtained from the medical ethics committee of Ajman University, United Arab Emirates, and DY Patil Dental School, Pune, India. Written informed consent was obtained from the patients, who were informed that participation was not compulsory and that their nonparticipation would not affect their treatment.
The study subjects included 179 participants (44% females) wearing different types of RPDs. The mean age of the patients was 59 years old (range 36 to 71 years) (Table 1). The study’s participants were Hindi-speaking individuals who wore either complete RDs or RPDs. The RDs were supported by tissue, teeth, implants, or a combination of both. The RPDs were retained using clasps, attachments, or bars. The participants were allowed to wear their dentures comfortably for at least two months to be included in this study. Patients with any oral or facial pathologies were excluded. Patients who did not wear their dentures regularly or those diagnosed with any mental or behavioral disorders as per international classification standards were also excluded [20]. Given the necessity for a methodical and well-organized approach to design and develop the questionnaire, this study was conducted in three well-defined phases (Fig. 1).
| Subject Details | Frequency |
|---|---|
|
Total subjects • Males • Females |
179 101 78 |
| Age | Mean 59 years old (Range 36 to 71 years old) |
| Subjects | Hindi-speaking individuals who wore either complete dentures or removable partial dentures. |
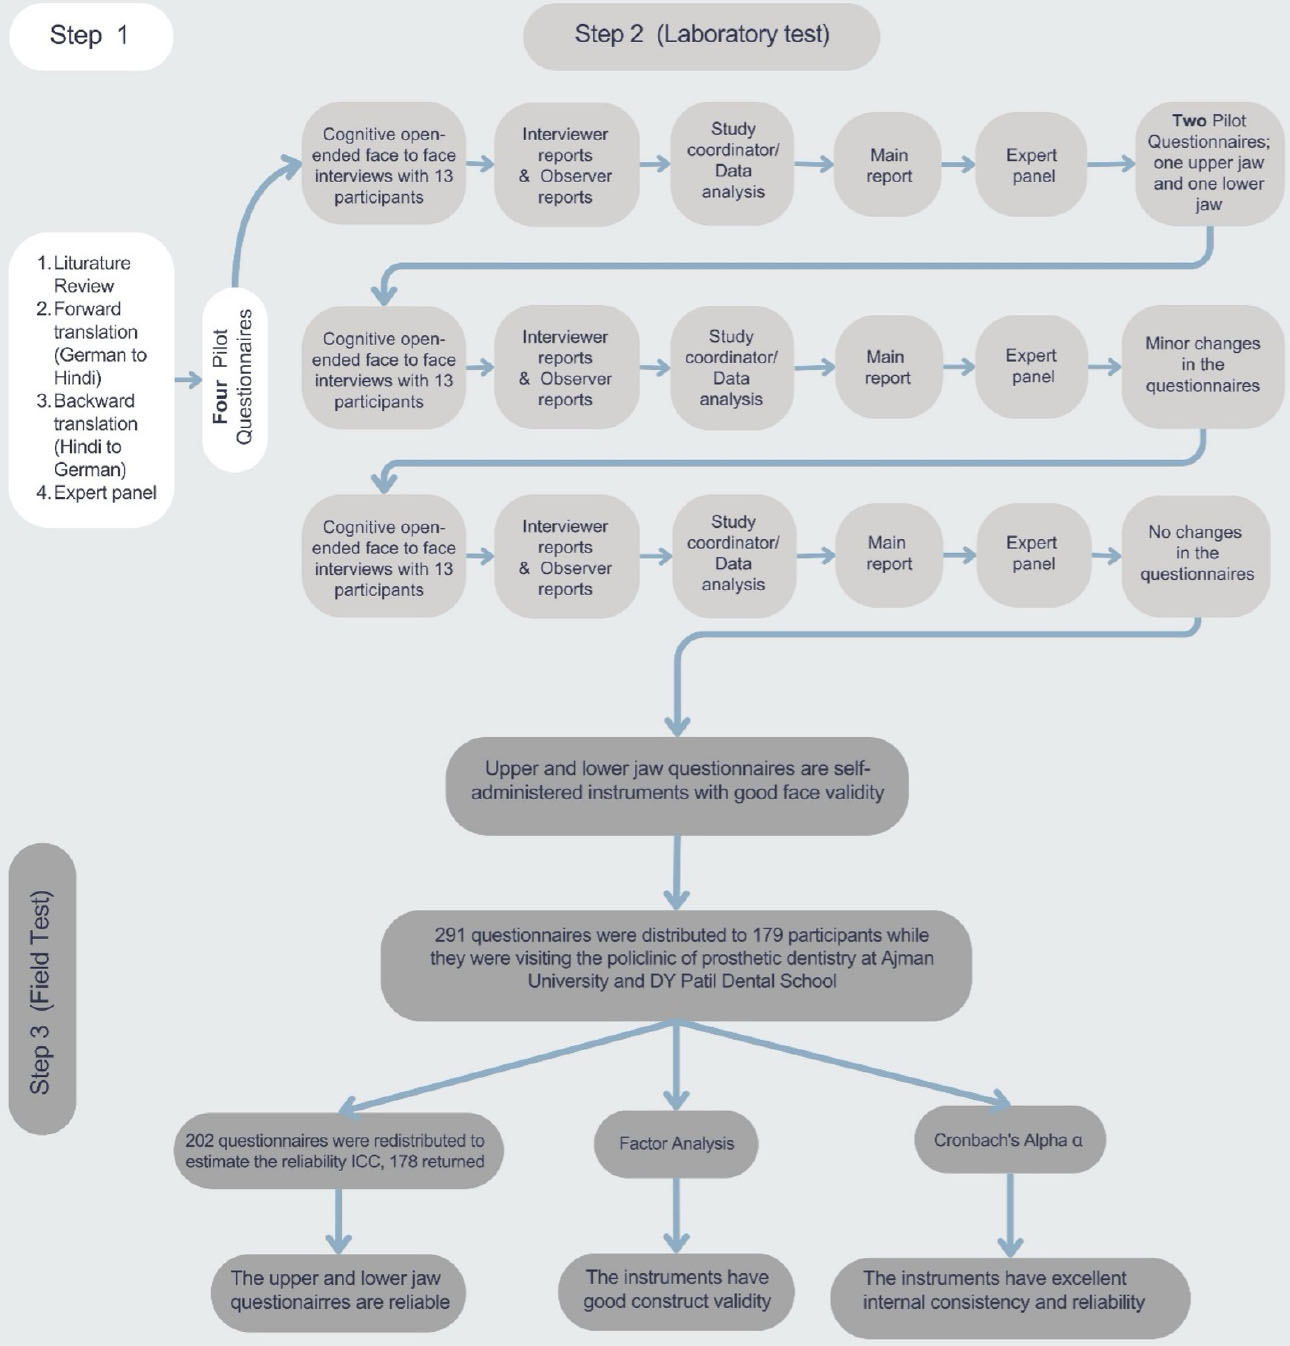
Study overview.
2.2. Phase One
The Hindi version (pilot version) of the upper and lower jaw questionnaires (Tables S1 and S2) was developed through forward-backward translation per the recommendations of Guillemin et al. [21]. Two translators proficient in two languages (German and Hindi), one of whom was a prosthodontist, worked together to translate the separate questionnaire for the upper jaw and lower jaw from German to Hindi (forward translation). The Hindi version was translated back into German (backward translation) by two additional bilingual translators, one of whom was a dental specialist. One member of each translation pair was aware of the intended concept of the questionnaire. This method helps in detecting differences and enhances the quality of translation [21]. Any inconsistencies, misunderstandings, or unclear phrasing identified during both translation processes were brought to the attention of a panel of experts. The expert panel carefully examined the translations, resolved any discrepancies, and finalized the versions with the help and support of the translators. A 5-point Likert scale was used to record the patient’s responses for each item. The satisfaction index with the RDs was represented by the total sum of all items, where a higher index value indicated lower satisfaction and a lower index value indicated higher satisfaction. Upon completion of this phase, four pilot questionnaires were developed to measure patient satisfaction: two separate versions for the upper and lower jaw.
2.3. Phase Two
Two investigators (dentists) were trained in the conduct of cognitive interviews. Interviews were conducted by one of the investigators (KS) and the other investigator served as the observer (SN). Subsequently, each investigator individually reported the results of the interview to the study co-investigator. Phase Two was dedicated to test the face validity of the questionnaires. Face validity was assessed through three rounds of cognitive interviews involving 39 participants, with 13 participants in each round. All participants had upper and lower RDs except three, who had only a single RD. The interviews were conducted from 3rd July 2022 to 30th October 2022.
In the first round, patients were asked to use a virtual platform (Zoom), and questionnaires were read by the interviewer. Patients were assured that there were no right or wrong answers and that they were free to answer according to their understanding. Both versions of the questionnaire were subjected separately to patient comprehension, which was recorded. Nonverbal signs were also recorded. The observer assessed the quality of the interviews and recorded any issues leading to bias, such as leading questions and double-negative questions. Based on the data from this stage of the study, final versions of the questionnaire in the Hindi language were finalized that had better clarity: one for the upper jaw and one for the lower jaw. Second-round face-to-face interviews were conducted to assess participants’ comprehension of the selected versions. The interviewer assessed comprehension using various probes, such as asking for elaboration or clarification, providing overt encouragement, reframing questions or paraphrasing, repeating and reconfirming responses, confidence judgment, and silent probes. The commonly used probes were confirmation, overt encouragement, and clarification when required. Reports from both the observer and interviewer were obtained and subjected to data analysis. This analysis was incorporated into the main report. The main report, formulated by LA, encompassed evaluations of the clarity of questions, patients' comprehension, appropriateness of the questionnaire design (including readability and layout), acceptability of questions, and overall data quality. The observer’s reports played a pivotal role in this phase. Upon completing the second round of interviews, the expert panel meticulously reviewed the results. Ambiguous terms identified during these discussions were replaced based on patient feedback and expert opinions. The panel approved the adjusted questionnaires before proceeding with the third round. Finally, the observer and interviewer reports and the expert panel confirmed the face validity of the questionnaires, and the questionnaires were finalized.
2.4. Phase Three
The third phase included the assessment of the reliability and construct validity of the questionnaires as well as identifying the underlying structure of both instruments. During the field test, 291 questionnaires (134 upper-jaw questionnaires) were distributed to the participants wearing different types of RPDs. After one week, 178 questionnaires (92 upper-jaw questionnaires) were redistributed to estimate reliability (Fig. 1).
Bartlett’s sphericity test and the Kaiser–Meyer–Olkin test (KMO) were performed to test the dataset for factor analysis. Principal component factor analysis was conducted to analyze the construct validity and identify the factors underlying the study dataset. Furthermore, factor analysis was performed for the upper jaw and lower jaw satisfaction index with the RDs. The suitability and reliability of the items in the index were estimated using the intraclass correlation coefficient (ICC) and Cronbach’s alpha at a 95% confidence level. For the statistical analysis, IBM® SPSS 25.0 was used.
3. RESULTS
3.1. Phase One
The translation of the German version to Hindi resulted in the creation of four pilot questionnaires: two versions, each for the upper and lower jaws. Each questionnaire comprised eight items. The first item focused on overall patient satisfaction with the RD. The remaining seven items addressed eating, speaking, aesthetics, and cleanliness of the RD, as well as RD retention, support, and stability.
3.2. Phase Two
During this phase of the study, 39 participants were involved, with 13 participating in each round of interviews. Collectively, the participants wore 75 RDs. The initial round commenced with four pilot questionnaires, culminating in the formulation of one questionnaire each for the upper and lower jaws.
In the second round, adjustments were made to three areas related to RD retention, support, and stability with the aim of enhancing clarity and understanding among participants. When the third round was concluded, no further adjustments were required. The questionnaires were successfully refined, resulting in final versions of both the upper and lower jaw questionnaires that possessed good face validity.
3.3. Phase Three
One hundred seventy-nine participants (101 male) with a mean age of 59 completed 134 upper-jaw questionnaires and 157 lower-jaw questionnaires (Table 2). The KMO test was used to determine whether the sample size was sufficiently large to reliably extract factors [22, 23]. Additionally, the suitability of the dataset for factor analysis was evaluated using the correlation matrix between the items. Both tests yielded acceptable results. Bartlett’s sphericity test, which rejected the null hypothesis and suggested that the correlation matrix for the data was identical, further confirmed the dataset's suitability for factor analyses (Table 3).
Principal component analysis was applied as the extraction method in the factor analyses. Eight factors were identified for each questionnaire (Table 4), but only one, with an eigenvalue >1.0, should be retained. For this factor, the items would have strong loadings >0.6 (Table 5). Moreover, a factor with ≥4 loadings is considered reliable regardless of the sample size [22], which makes the selected factor for every questionnaire reliable, as shown in Table 5. Based on the data suitability, the eigenvalues, and the factor loading, it was determined that the one-factor model is acceptable and reliable [24]. As a result, it was decided to develop separate upper jaw and lower jaw indices to gauge patient satisfaction with RD. This was accomplished by summing the scores of all items, following the approach of Jenkinson et al. [25]. Furthermore, the reliability of the RD satisfaction indices showed excellent internal consistency (Cronbach’s alpha α > 0.9; Table 6).
| - | Jaw | Gender | Type of RD | |||||
|---|---|---|---|---|---|---|---|---|
| - | Upper Jaw | Lower Jaw | Male | Female | Complete Denture | RPD with Metal Framework | Acrylic RPD | Implant-supported RD |
| Frequency | 134 | 157 | 101 | 78 | 106 | 39 | 134 | 12 |
| Percent | 46.0 | 54 | 56 | 44 | 36.4 | 13.4 | 46.0 | 4.1 |
| Total | 291 | 179 | 291 | |||||
| - | Upper Questionnaire | Lower Questionnaire | ||||||||||||||
|---|---|---|---|---|---|---|---|---|---|---|---|---|---|---|---|---|
| - | I1 | I2 | I3 | I4 | I5 | I6 | I7 | I8 | I1 | I2 | I3 | I4 | I5 | I6 | I7 | I8 |
| I1 | 1.000 | 0.737 | 0.752 | 0.715 | 0.744 | 0.767 | 0.589 | 0.670 | 1.000 | 0.768 | 0.773 | 0.732 | 0.656 | 0.715 | 0.592 | 0.626 |
| I2 | 0.737 | 1.00 | 0.748 | 0.753 | 0.743 | 0.706 | 0.543 | 0.669 | 0.768 | 1.00 | 0.759 | 0.733 | 0.585 | 0.704 | 0.499 | 0.633 |
| I3 | 0.752 | 0.748 | 1.000 | 0.727 | 0.745 | 0.695 | 0.555 | 0.542 | 0.773 | 0.759 | 1.000 | 0.772 | 0.728 | 0.738 | 0.671 | 0.681 |
| I4 | 0.715 | 0.753 | 0.727 | 1.000 | 0.744 | 0.775 | 0.549 | 0.626 | 0.732 | 0.733 | 0.772 | 1.00 | 0.726 | 0.753 | 0.661 | 0.687 |
| I5 | 0.744 | 0.743 | 0.745 | 0.744 | 1.000 | 0.734 | 0.585 | 0.655 | 0.656 | 0.585 | 0.728 | 0.726 | 1.000 | 0.604 | 0.773 | 0.666 |
| I6 | 0.767 | 0.706 | 0.695 | 0.775 | 0.734 | 1.000 | 0.499 | 0.669 | 0.715 | 0.704 | 0.738 | 0.753 | 0.604 | 1.000 | 0.515 | 0.627 |
| I7 | 0.589 | 0.543 | 0.555 | 0.549 | 0.585 | 0.499 | 1.000 | 0.632 | 0.592 | 0.499 | 0.671 | 0.661 | 0.773 | 0.515 | 1.000 | 0.696 |
| I8 | 0.670 | 0.669 | 0.542 | 0.626 | 0.655 | 0.669 | 0.632 | 1.000 | 0.626 | 0.633 | 0.681 | 0.687 | 0.666 | 0.627 | 0.696 | 1.000 |
| - | Upper Jaw Questionnaire, N= 134 | Lower Jaw Questionnaire, N= 157 | ||||
|---|---|---|---|---|---|---|
| Eigenvalue | % of Variance | Cumulative % | Eigenvalue | % of Variance | Cumulative % | |
| 1 | 5.738 | 71.719 | 71.719 | 5.778 | 72.221 | 72.221 |
| 2 | 0.622 | 7.776 | 79.495 | 0.709 | 8.865 | 81.086 |
| 3 | 0.427 | 5.336 | 84.832 | 0.360 | 4.501 | 85.586 |
| 4 | 0.301 | 3.763 | 88.595 | 0.322 | 4.019 | 89.606 |
| 5 | 0.289 | 3.614 | 92.208 | 0.240 | 3.004 | 92.609 |
| 6 | 0.252 | 3.150 | 95.359 | 0.212 | 2.654 | 95.263 |
| 7 | 0.196 | 2.446 | 97.805 | 0.204 | 2.554 | 97.818 |
| 8 | 0.176 | 2.195 | 100 | 0.175 | 2.182 | 100.000 |
| Upper Jaw Questionnaire | Lower Jaw Questionnaire | ||
|---|---|---|---|
| Item (I) | Loading | Item | Loading |
| I1 | 0.886 | Q1 | 0.865 |
| I2 | 0.875 | Q2 | 0.838 |
| I3 | 0.855 | Q3 | 0.904 |
| I4 | 0.874 | Q4 | 0.895 |
| I5 | 0.882 | Q5 | 0.843 |
| I6 | 0.868 | Q6 | 0.834 |
| I7 | 0.719 | Q7 | 0.791 |
| I8 | 0.803 | Q8 | 0.824 |
| Upper Jaw Questionnaire, N= 134 | Lower Jaw Questionnaire, N= 157 | |||||
|---|---|---|---|---|---|---|
| Item | Scale Mean if Item Deleted | Scale Variance if Item Deleted | Cronbach's Alpha if Item Deleted | Scale Mean if Item Deleted | Scale Variance if Item Deleted | Cronbach's Alpha if Item Deleted |
| I1 | 15.31 | 33.811 | 0.931 | 16.55 | 31.544 | 0.935 |
| I2 | 15.28 | 34.006 | 0.932 | 16.42 | 32.066 | 0.938 |
| I3 | 15.33 | 34.102 | 0.934 | 16.52 | 31.533 | 0.932 |
| I4 | 15.22 | 33.438 | 0.932 | 16.32 | 31.052 | 0.932 |
| I5 | 15.43 | 34.201 | 0.932 | 16.43 | 31.374 | 0.937 |
| I6 | 15.22 | 33.829 | 0.933 | 16.27 | 30.915 | 0.938 |
| I7 | 15.40 | 35.384 | 0.943 | 16.34 | 31.932 | 0.941 |
| I8 | 15.42 | 35.238 | 0.938 | 16.41 | 31.821 | 0.938 |
| - | Cronbach's Alpha if all items included is 0.943 | Cronbach's Alpha if all items included is 0.945 | ||||
| Item (I) | Upper Jaw Questionnaire, n=92 | Lower Jaw Questionnaire, n=86 | |
|---|---|---|---|
| I1 | Single Measures | 0.87 (0.79-0.92) | 0.91(0.84-0.95) |
| Average Measures | 0.93 (0.88-0.96) | 0.95(0.91-0.97) | |
| I2 | Single Measures | 0.81 (0.73-0.87) | 0.85 (0.73-0.91) |
| Average Measures | 0.9(0.84-0.93) | 0.92 (0.84-0.95) | |
| I3 | Single Measures | 0.83 (0.74-0.88) | 0.82 (0.74-0.88) |
| Average Measures | 0.9 (0.85-0.94) | 0.9 (0.85-0.94) | |
| I4 | Single Measures | 0.81 (0.68-0.88) | 0.84 (0.75-0.89) |
| Average Measures | 0.89 (0.81-0.94) | 0.91 (0.86-0.94) | |
| I5 | Single Measures | 0.86 (0.79-0.9) | 0.85 (0.76-0.9) |
| Average Measures | 0.92 (0.88-0.95) | 0.92 (0.87-0.95) | |
| I6 | Single Measures | 0.82 (0.73-0.88) | 0.86 (0.74-0.91) |
| Average Measures | 0.9 (0.95-0.94) | 0.92 (0.85-0.96) | |
| I7 | Single Measures | 0.82 (071-0.88) | 0.8 (0.66-0.88) |
| Average Measures | 0.9 (0.83-0.94) | 0.89 (0.8-0.94) | |
| I8 | Single Measures | 0.88 (0.82-0.92) | 0.92 (0.84-0.95) |
| Average Measures | 0.94 (0.9-0.96) | 0.96 (0.91-0.98) | |
| Index | Single Measures | 0.86 (0.76-0.92) | 0.91 (0.78-0.96) |
| Average Measures | 0.93 (0.86-0.96) | 0.95(0.88-0.98) | |
Ninety-two upper jaw questionnaires, and 86 lower jaw questionnaires were redistributed to estimate their reliability. The time interval between completing and re-completing the questionnaire was approximately nine days, ranging from six to 16 days. The ICC values varied, with a range of 0.94 to 0.81 observed in the upper jaw questionnaire items and from 0.96 to 0.80 observed in the lower jaw questionnaire items, which was considered excellent to good reliability [26] (Table 7).
4. DISCUSSION
Patient satisfaction is a reliable indicator of quality dental treatment, reflecting individuals' perceptions of healthcare services. A notable measure of dental treatment quality is patient satisfaction, which is the patient's opinion of the care they receive. Therefore, a validated and reliable German test instrument was used to develop a Hindi version capable of measuring patient satisfaction with RD. The developed Hindi versions of the upper and lower jaw questionnaires and indices to study patient satisfaction with RDs were valid and reliable. The third round of interviews revealed that the questionnaire had good face validity. The ICC indicated that the questionnaires have excellent reliability. This questionnaire can be applied in the clinical setting to test patient satisfaction with removable dentures. They can be used for research and can be integrated into routine patient assessment. Based on patient satisfaction, treatment modifications can be done in the follow-up visits.
Upper and lower jaw indices that represent the degree of patient satisfaction with RDs were formed by summing the item scores in each questionnaire because the items pertained to the same cluster. The cluster was statistically identified through factor analyses in which only one factor was distinguished with an eigenvalue >1. This cluster comprised 8 items consisting of the following domains: appearance, eating, speaking, cleanability, RPD movement in 3 directions (support, stability, and retention), and patient satisfaction. The 2 indices showed high internal consistency and reliability.
Control procedures and quality assurance were implemented during the study. First, this was a multicentre study. The observer oversaw and reported the quality of all interviews. The co-investigator then compared the interviewers’ reports with the observers’ reports. Any discrepancies noted between the reports were documented before proceeding with the data analysis and drafting the final report. This layered approach to controlling study quality played an important role in enhancing study quality and instilling confidence in its findings.
Many studies have reported that the common responses for patients’ dissatisfaction with RD are the condition, number, and distribution of the abutments, health of the gingival, periodontal, and mucosal tissues, and RPD design and material [27, 28]. Moreover, factors such as age, gender, disability, racial or ethnic minority, sociodemographics, level of education, type of opposing dentition, systemic health condition, and prior experience with a prosthesis can all impact patient satisfaction [29-31]. However, none of these were included in the current questionnaires. Only the RPD-related factors were included in the analysis. This study aimed to create a questionnaire that is easy to navigate and complete in a reasonable amount of time. Additionally, as most RD wearers are elderly patients, this study attempted to develop instruments that are more appropriate for them, matching their abilities and needs more effectively. At the end of the third round of interviews, all 13 patients fully understood the items. The patients stopped providing new information to the existing findings, and conducting additional interviews were deemed repetitive due to recurring comments and themes [32]. The approach is supported by other studies [33, 34], where the sample size in such qualitative studies was 12. Subsequently, 13 participants in every round of interviews were considered sufficient for the data analysis, which concluded that the instruments had good face validity and that no more changes in the instruments were needed.
There is an importance of structured surveys in assessing patient perspectives. A recent cross-sectional study examined the prevalence and severity of orofacial disorders in patients with fibromyalgia patients utilizing a structured questionnaire to assess the correlation between fibromyalgia and oral health issues and demonstrated significant correlations between the Fibromyalgia Assessment Status index and various orofacial symptoms, emphasizing the need for multidisciplinary treatment approaches [35]. Hence, there is a great importance of structured surveys in assessing patient perspectives in patients.
In this study, factor analysis revealed that the one-factor model accounted for 71.72% of the total variance in the items of the upper jaw satisfaction questionnaire and 72.2% of the variance in the items of the lower jaw satisfaction questionnaire (Table 4). Some researchers regard loading as important if it exceeds 0.3 [22]. Others have placed special emphasis on the sample size. Taking all this into account, it can be stated that the factor loadings in the upper and lower jaw questionnaires were significant and that none of the items should be disregarded or removed (Table 5). In addition, Cronbach's alpha was used to evaluate the indices' internal consistency, which was found to be excellent (α > 0.94) [36]. To assess the indices, items that did not fit well with the index were identified as they had the potential to influence the index negatively. Item-rest correlations are regarded as a valuable technique for identifying item fit. Item-rest correlation refers to the correlation between a specific item and the composite index formed by all the other items [36]. Table 6 shows that removing any item from the index results in a reduction in reliability rather than an improvement. Therefore, it was decided that none of the items should be removed and that all items should be kept in the index. This decision is in agreement with the results of the factor analysis.
Some limitations exist in this study. The potential for response bias was the main limitation of this study. It remains uncertain whether any of the responses were influenced by the patient-doctor relationship despite assuring the participants that the collected data would be kept confidential. During the test-retest phase, some patients returned the completed questionnaires after five weeks. Therefore, the panel recommended discarding data collected from these patients according to the exclusion criteria. In addition, we did convenient sampling without power analysis. Further studies can be done to include more samples from various populations.
CONCLUSION
The patient satisfaction outcome provides subjective assessments for dental treatments. In this study, we found that the Hindi version of the upper and lower jaw questionnaire and index showed valid and reliable outcomes. This Hindi version questionnaire can be used to measure patient satisfaction with removable prosthodontics.
AUTHORS’ CONTRIBUTIONS
The authors confirm their contribution to the paper as follows: A.A.J.: Study Conception and Design; S.S.N.: Conceptualization; L.M.A.: Methodology; K.S.: Data collection; D.D.: Data curation; T.M.: Visualization; D.R.: Validation. All authors reviewed the results and approved the final version of the manuscript.
LIST OF ABBREVIATIONS
| RD | = Removable dentures, whether complete or partial, can be supported by teeth, implants, or a combination of both. |
| RPD | = Removable Partial Denture |
| ICC | = intraclass correlation coefficient |
| KMO | = Kaiser–Meyer–Olkin test |
ETHICS APPROVAL AND CONSENT TO PARTICIPATE
Approval (Reference number: D-F-H-18-Oct) for the study was obtained from the medical ethics committee of Ajman University, United Arab Emirates, and DY Patil Dental School, Pune, India.
HUMAN AND ANIMAL RIGHTS
All human research procedures followed were in accordance with the ethical standards of the committee responsible for human experimentation (institutional and national), and with the Helsinki Declaration of 1975, as revised in 2013.
CONSENT FOR PUBLICATION
All participants gave their written informed consent to all study procedures.
AVAILABILITY OF DATA AND MATERIALS
The data used to support the findings of this study are available from the corresponding author [A.Al-J] upon reasonable request.
FUNDING
This study was supported by Ajman University Internal Research Grant No. 2022-IRG-DEN-9 United Arab Emirates.
ACKNOWLEDGEMENTS
We would like to thank Ms. Nour Faisal Alaila for her help in collecting the data.

