All published articles of this journal are available on ScienceDirect.

Systemic Consistency of Uric Acid Levels in Saliva and Gingival Crevicular Fluid Across Different Periodontal Health Statuses
Authors Info & Affiliations
Abstract
Introduction
Uric acid, a potent antioxidant and pro-oxidant molecule, plays a critical role in neutralizing oxidative stress, a key driver of periodontal disease progression. This study investigates the systemic and localized dynamics of uric acid levels in saliva and Gingival Crevicular Fluid (GCF) among individuals with varying periodontal health statuses based on the 2017 classification system for periodontal diseases.
Methods
A cross-sectional study was conducted on 43 participants grouped into healthy, mild, moderate, and severe periodontitis categories. Saliva and GCF samples were collected and analyzed for uric acid levels using spectrophotometric methods. Statistical analyses included Kruskal-Wallis and Wilcoxon signed-rank tests to assess differences between groups and fluids.
Results
Significant differences in salivary uric acid levels were observed across severity groups (Kruskal-Wallis, p = 0.002), with levels decreasing progressively from healthy individuals (median = 40.51 µmol/L) to severe periodontitis (median = 6.01 µmol/L). Pairwise comparisons revealed significant differences between most severity groups, except for mild and moderate periodontitis. In GCF, uric acid levels also differed significantly across groups (Kruskal-Wallis, p = 0.0024), with lower levels in severe periodontitis compared to healthy and mild groups. No significant difference was found between uric acid levels in saliva and GCF (Wilcoxon, p = 0.088), indicating consistency across the two fluids.
Discussion
The study demonstrated that uric acid levels in both saliva and gingival crevicular fluid decrease significantly with increasing periodontal disease severity. This pattern supports the role of oxidative stress in periodontitis progression and highlights the potential depletion of antioxidant reserves as the disease advances. The consistent uric acid concentrations between saliva and GCF suggest systemic reflection of local periodontal inflammation. These findings reinforce the utility of uric acid as a non-invasive biomarker for assessing periodontal health and indicate that salivary measurements could reliably mirror local oxidative changes in the periodontal microenvironment.
Conclusion
Uric acid levels in saliva and GCF reflect periodontal health status, with significant reductions observed as disease severity increases. The consistency of uric acid levels between these fluids highlights their potential as non-invasive biomarkers for monitoring oxidative stress in periodontal disease.
1. INTRODUCTION
Periodontitis is a complex, multifactorial inflammatory disease characterized by the progressive destruction of the periodontal ligament and alveolar bone, ultimately leading to tooth loss if left untreated [1].
It is highly prevalent globally and has been linked to systemic conditions such as cardiovascular diseases and diabetes [2].
The 2017 classification system for periodontal and peri-implant diseases, established through the joint consensus of the American Academy of Periodontology (AAP) and the European Federation of Periodontology (EFP), represents a significant advancement in the diagnosis and management of periodontal diseases. This updated system classifies periodontitis into four stages (I–IV) according to the severity and extent of disease—using parameters such as Clinical Attachment Loss (CAL), radiographic bone loss, and tooth loss attributed to periodontitis—as well as complexity factors, including furcation involvement and vertical bone defects. In addition, the system incorporates three grades (A–C) that reflect the rate of disease progression, responsiveness to therapy, and risk factors such as smoking and glycemic control in diabetes. This multidimensional framework enables a more personalized and accurate diagnosis, resolves previous inconsistencies by unifying chronic and aggressive forms of periodontitis under a single category, and facilitates improved treatment planning and prognostic assessment. The 2017 classification also includes peri-implant health, mucositis, and peri-implantitis, thereby broadening its clinical applicability [3-5]. In this study, the staging and grading criteria of the 2017 classification were utilized to ensure precise and standardized grouping of participants according to periodontal health status and disease severity.
Uric acid, a natural antioxidant and end-product of purine metabolism, plays a pivotal role in neutralizing Reactive Oxygen Species (ROS) [6].
As a dual-faced molecule, uric acid has been associated with both protective antioxidant effects and pro-oxidant activity, depending on the local biochemical environment [7].
The interplay between oxidative stress and periodontal disease progression has been widely recognized, with oxidative stress serving as both a driver and consequence of tissue destruction in periodontitis. Uric acid, a potent endogenous antioxidant, offers a unique dual role in mitigating oxidative damage while also acting as a pro-oxidant in specific pathological contexts [8, 9]. This makes it a critical biomarker for understanding the balance between protective and harmful mechanisms within the periodontal microenvironment. Although serum uric acid has been extensively studied in systemic diseases such as cardiovascular conditions and gout, its role in oral health remains underexplored, particularly in non-invasive fluids like saliva and GCF [10-12].
Saliva, a readily accessible diagnostic medium, reflects systemic health, while GCF provides localized biochemical insights into the periodontal pocket [13, 14].
Evaluating the consistency of uric acid levels between these two fluids across the periodontal health spectrum can illuminate the systemic and localized contributions of oxidative stress. By leveraging the comprehensive 2017 classification system for periodontal diseases, which integrates disease staging and grading, this study aims to bridge gaps in understanding the relationship between systemic and local antioxidant defenses in periodontal pathology [3, 9].
Given the growing emphasis on non-invasive diagnostic approaches, assessing uric acid in saliva and GCF may not only improve our ability to monitor periodontal disease progression but also offer insights into novel therapeutic interventions targeting oxidative stress [15, 16].
Therefore, the current study seeks to evaluate the systemic consistency of uric acid levels in saliva and GCF among individuals with varying periodontal health statuses, providing a deeper understanding of its diagnostic and therapeutic implications.
2. METHODOLOGY
This cross-sectional study assessed uric acid levels in saliva and GCF among individuals with varying stages of periodontitis. Participants were grouped into four categories, healthy controls, mild periodontitis, moderate periodontitis, and severe periodontitis. The study was conducted at RAK College of Dental Sciences (RAKCODS) over six months, from October 2023 to April 2024, following ethical approval from the Research and Ethics Committee of RAKMHSU (RAKMHSU-REC-043-2022/23-UG-D). All research procedures adhered to the ethical standards of the committee responsible for human experimentation (institutional and national) and complied with the principles of the Helsinki Declaration of 1975, as revised in 2013 (http://ethics.iit.edu/ecodes/node/3931).
The sample size for this study was determined based on feasibility and participant availability within the defined recruitment period. To assess the adequacy of the selected sample size, a post hoc power analysis was conducted using G*Power software (version 3.1.9.7). Assuming a medium effect size (Cohen’s f = 0.25), an alpha level of 0.05, and the actual group allocation ratios, the calculated statistical power was 0.36. While this power is lower than the conventional threshold of 0.80, it was considered acceptable for detecting moderate to large effects in this exploratory cross-sectional study. The limited power has been acknowledged as a constraint on generalizability and is discussed among the study’s limitations.
Participants were recruited through convenience sampling based on the following criteria:
2.1. Inclusion Criteria
Adults aged 18–55 years, consenting to participate, with a clinical diagnosis of periodontitis or healthy periodontal tissues (control group).
2.2. Exclusion Criteria
Smokers, alcohol consumers, pregnant or lactating women, individuals with systemic diseases or medications affecting periodontal health, and those undergoing or having received periodontal treatment within the past six months.
2.3. Clinical Examination and Grouping
Participants underwent a comprehensive periodontal examination to measure Clinical Attachment Loss (CAL) and probing depth (PD) using a University of Michigan probe with William markings. Staging and grading of periodontitis were determined according to the 2017 classification system for periodontal and peri-implant diseases. The assessment included radiographic evaluation to confirm the extent of alveolar bone loss, which was critical for accurate staging and grading. Orthopantomograms (OPGs) were obtained for all participants to ensure consistency in radiographic evaluation.
Sites with the highest CAL and the most severe clinical signs of inflammation were identified for GCF collection. All periodontal diagnoses were independently verified by three calibrated examiners (N.H., S.F., and N.M.). Calibration exercises were conducted prior to data collection to ensure consistent diagnostic criteria and measurement techniques. Examiner reliability was assessed using Cohen’s kappa statistic, which demonstrated substantial agreement (κ = 0.8), thereby ensuring consistency and accuracy in clinical assessments.
2.4. Sample Collection
Saliva and GCF were collected from all participants under standardized conditions:
2.4.1. Saliva Collection
Unstimulated saliva samples were collected between 9 AM and 11 AM to minimize diurnal variation in antioxidant levels. Participants refrained from eating, drinking, or performing oral hygiene procedures for at least one hour before collection. Saliva was collected by the spitting method over 5 seconds into sterile collection tubes, which were immediately stored at -80°C.
2.5. GCF Collection
GCF was collected from sites based on the extent of periodontal involvement. In periodontitis patients, sampling was performed from the most severely affected sites. For individuals with localized periodontitis (involving <30% of teeth), GCF was obtained from the three most severely affected teeth. In generalized periodontitis (≥30% of the dentition affected), GCF was collected from ten representative teeth to ensure comprehensive coverage across all quadrants. In the control group, samples were taken from a clinically healthy site.
Prior to collection, the selected sites were isolated and gently dried to prevent contamination with saliva or blood. Sterile absorbent paper points (Meta® Biomed, Korea) were inserted into the gingival sulcus for 30 seconds to absorb the crevicular fluid. The paper points were then transferred into sterile Eppendorf tubes and stored at -80°C. For analysis, samples were immersed in phosphate buffer (pH 7.4) and gently agitated to release the absorbed fluid. After removing the paper points, the tubes were stored at 4°C, and the supernatant obtained after centrifugation was used for uric acid assays.
2.6. Biochemical Analysis
The collected samples were prepared for biochemical analysis as follows:
- Saliva and GCF samples were centrifuged at 3000 rpm for 15 minutes to remove debris, and the supernatant was collected.
- Uric acid concentrations in saliva and GCF were measured using the Elabscience® Uric Acid (UA) Colorimetric Assay Kit (Cat. No.: E-BC-K016-M). The analysis was carried out at the RAK Medical and Health Sciences University Research Laboratory, following the manufacturer’s instructions. The detection method is based on a colorimetric principle with a quantifiable range of 0.31– 20 μg/mL. To ensure accuracy and optimal sample handling, a pre-experiment was performed using 2–3 representative samples with expected variability. Based on these initial results, appropriate dilution protocols were applied to ensure all sample readings fell within the standard range of the assay. Each sample was analyzed in duplicate, and absorbance was measured using a microplate reader at the designated wavelength. Final uric acid concentrations were calculated using a standard curve and recorded in a master datasheet alongside participant demographics and their periodontal classification. The spectrophotometric absorbance was measured at 540 nm using a UV-visible spectrophotometer (JENWAY 6505, Unico).
2.7. Statistical Analysis
Data analysis was performed using IBM SPSS version 21. Descriptive statistics were used to summarize uric acid concentrations in both saliva and GCF across the periodontal health categories. Normality of the data was first assessed using the Shapiro-Wilk test. Given the non-normal distribution observed in several groups, non-parametric statistical methods were applied throughout the analysis.
To evaluate differences in uric acid levels across the four severity groups (Healthy, Mild, Moderate, and Severe), the Kruskal-Wallis test was employed. Upon identifying significant group-level differences, pairwise comparisons were conducted using the Mann-Whitney U test with Bonferroni correction to adjust for multiple testing.
To compare uric acid concentrations between saliva and GCF within individuals, the Wilcoxon signed-rank test was used as a non-parametric method for paired samples. A p-value < 0.05 was considered statistically significant for all analyses.
3. RESULTS
3.1. Data Description
The study included 43 participants who were classified based on the severity of their periodontal condition, ranging from healthy individuals to those with varying stages and grades of periodontitis (Stage I to Stage IV, Grade A to Grade C). Of the participants, 58% were male, and 42% were female, with a mean age of 38.8 ± 8.8 years.
The severity of periodontal disease among the study participants was categorized into mild, moderate, or severe based on the CAL and corresponding to the stages and grades of periodontitis. Mild periodontitis was observed in 9 participants, characterized by a clinical attachment loss of 1–2 mm. Moderate periodontitis included 13 participants, exhibiting a clinical attachment loss of 3–4 mm, representing an intermediate stage between mild and severe periodontitis. Severe periodontitis, the most advanced form of the disease, was identified in 8 participants with a clinical attachment loss exceeding 5 mm, indicating extensive periodontal destruction [4]. In contrast, the healthy group comprised 13 participants with intact periodontium, showing no evidence of clinical attachment loss or alveolar bone loss [5] (Table 1).
3.2. Uric Acid Concentrations in Saliva by Disease Severity
A comparison of the levels of uric acid in saliva across different severity groups was done and statistical tests were used to determine if there are significant differences between these groups.
| Diagnosis | Mild | Moderate | Severe | Healthy Gingiva |
|---|---|---|---|---|
| Healthy Gingiva | 0 | 0 | 0 | 13 |
| Stage IV Grade C | 0 | 0 | 1 | 0 |
| Stage I Grade A | 5 | 0 | 0 | 0 |
| Stage II Grade A | 4 | 0 | 0 | 0 |
| Stage II Grade B | 0 | 6 | 0 | 0 |
| Stage II grade B | 0 | 1 | 0 | 0 |
| Stage III grade B | 0 | 1 | 0 | 0 |
| Stage III Grade B | 0 | 4 | 0 | 0 |
| Stage III Grade C | 0 | 0 | 2 | 0 |
| Stage IV Grade C | 0 | 0 | 6 | 0 |
| Severity | Median Uric Acid (Saliva) | - |
|---|---|---|
| Healthy gingiva | 40.5076 | - |
| Mild | 17.2 | - |
| Moderate | 12.9625 | - |
| Severe | 6.0144 | - |
| Test | Statistic | p-value |
| Kruskal-Wallis | 33.96 | 0.002 |
The data was checked for normality of distribution to decide which test was appropriate.
The results of the Shapiro-Wilk test for normality on the uric acid levels in saliva for each severity group reveal that some groups do not appear to follow a normal distribution, so it's appropriate to use a non-parametric test for the analysis. The Kruskal-Wallis test was used to compare the medians of uric acid levels in saliva across the severity groups.
The study examined the differences in uric acid concentrations in saliva across four groups defined by disease severity — Healthy Gingiva, Mild, Moderate, and Severe. The median uric acid concentrations were 40.51, 17.20, 12.96, and 6.01 for healthy, mild, moderate, and severe groups, respectively. The Kruskal-Wallis test shows a statistic of approximately 33.69 with a p-value of approximately 0.002, suggesting that there are statistically significant diff-
| Severity | Mean Uric Acid (Saliva) | Median Uric Acid (Saliva) | Pairwise Comparison | U Statistic | p-value | Significant (α = 0.05 after Bonferroni correction) |
|---|---|---|---|---|---|---|
| Healthy gingiva | 41.31928 | 40.5076 | Healthy Gingiva vs. Mild | 110 | 0.000658 | Yes |
| Mild | 19.70472 | 17.2 | Healthy Gingiva vs. Moderate | 149 | 0.000125 | Yes |
| Moderate | 15.67772 | 12.9625 | Healthy Gingiva vs. Severe | 117 | 0.000107 | Yes |
| Severe | 6.149944 | 6.0144 | Mild vs. Moderate | 81 | 0.059663 | No |
| - | - | - | Mild vs. Severe | 81 | 0.000412 | Yes |
| - | - | - | Moderate vs. Severe | 108 | 0.000143 | Yes |
erences in the median levels of uric acid in saliva among the different severity categories (Table 2).
Pairwise comparisons by using the Mann-Whitney U test for multiple comparisons using the Bonferroni correction. The results indicated that, except for the comparison between Mild and Moderate, all other pairwise comparisons show significant differences in uric acid levels in saliva (Table 3).
3.3. Uric Acid Concentrations in GCF by Disease Severity
The results indicated that the uric acid levels in GCF differ across various severities of the condition being studied, from “Healthy Gingiva” to different stages of severity labeled as “Mild,” “Moderate,” and “Severe.
The median uric acid levels in GCF for the different groups were 18.8027, 18.5840, 15.9871, and 6.2331 for the Healthy, mild, moderate, and severe groups, respectively.
The Kruskal-Wallis test is suitable for comparing median differences across groups without the assumption of normality. The Kruskal-Wallis test result was 14.37 with a p-value of 0.0024 indicating that there were statistically significant differences in uric acid levels in GCF among the different severity groups (“Healthy gingiva,” “Mild,” “Moderate,” and “Severe”) (Table 4). To further explore which specific severity groups differed significantly in terms of uric acid levels in GCF, we can perform post-hoc pairwise comparisons using Bonferroni-adjusted p-values using the Mann-Whitney U test. The results revealed that the “Severe” group was significantly different from all other groups (“Healthy Gingiva,” “Mild,” and “Moderate”).
No significant differences were found between the “Healthy Gingiva,” “Mild,” and “Moderate” groups when considering the Bonferroni correction for multiple comparisons (Tables 4 and 5).
3.4. Comparison of Uric Acid Levels Between Healthy and Periodontitis Groups
To strengthen statistical power, participants were regrouped into two main categories: Healthy controls and Periodontitis cases (which included all mild, moderate, and severe cases). The comparison of uric acid levels in both saliva and GCF between these two groups is presented in Table 6.
In saliva, the Healthy group exhibited significantly higher uric acid concentrations (median = 40.51 µmol/L) compared to the Periodontitis group (median = 12.96 µmol/ L). The Mann-Whitney U test indicated a statistically significant difference between the groups (U = 46.0, p = 0.001), confirming that salivary uric acid levels decline with the presence of periodontal disease.
Similarly, in GCF, the Healthy group showed higher uric acid levels (median = 18.80 µmol/L) relative to the Periodontitis group (median = 11.32 µmol/L). This difference was also statistically significant (U = 60.0, p = 0.003), supporting the observation that localized antioxidant depletion occurs in periodontal disease.
| Severity | Median Uric Acid (GCF) | - |
|---|---|---|
| Healthy gingiva | 18.8027 | - |
| Mild | 18.584 | - |
| Moderate | 15.9871 | - |
| Severe | 6.2331 | - |
| Test | Statistic | p-value |
| Kruskal-Wallis | 33.68661 | 2.31E-07 |
| Pairwise Comparison | U Statistic | p-value | Significant (α = 0.05 after Bonferroni correction) |
|---|---|---|---|
| Healthy Gingiva vs. Mild | 110 | 0.000658 | Yes |
| Healthy Gingiva vs. Moderate | 149 | 0.000125 | Yes |
| Healthy Gingiva vs. Severe | 117 | 0.000107 | Yes |
| Mild vs. Moderate | 81 | 0.059663 | No |
| Mild vs. Severe | 81 | 0.000412 | Yes |
| Moderate vs. Severe | 108 | 0.000143 | Yes |
To ensure clarity, we emphasize that this comparison involves 13 healthy individuals and 30 individuals with periodontitis, not seven cases as might have been misinterpreted (Fig. 1). The original subgroup analysis, including pairwise comparisons between the four disease severity groups, is retained in Tables 2-5, while Table 6 reflects the merged group analysis conducted to enhance statistical robustness.
| Fluid Type | Group | n | Mean Uric Acid (µmol/L) | Median Uric Acid (µmol/L) | Mann-Whitney U | p-value | Significant (p < 0.05) |
|---|---|---|---|---|---|---|---|
| Saliva | Healthy | 13 | 41.3 | 40.51 | 46.0 | 0.001 | Yes |
| - | Periodontitis | 30 | 15.2 | 12.96 | - | - | - |
| GCF | Healthy | 13 | 18.8 | 18.80 | 60.0 | 0.003 | Yes |
| - | Periodontitis | 30 | 12.1 | 11.32 | - | - | - |
3.5. Compare the Level of Uric Acid in Saliva and GCF
The Shapiro-Wilk test for the differences between uric acid levels in saliva and in GCF gives a p-value of approximately 0.0009, less than the typical alpha level of 0.05. This suggests that the differences do not follow a normal distribution.
Considering this result, the Wilcoxon signed-rank test was used for paired data that does not require the assumption of normal distribution. The Wilcoxon signed-rank test results in a statistic of 331 and a p-value of approximately 0.088. This result suggests that, statistically, the median difference between the uric acid concentrations measured in saliva and GCF is not significantly different across the entire dataset (Tables 6 and 7).
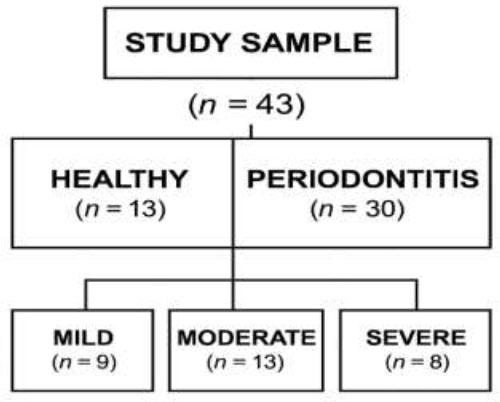
Flowchart illustrating the distribution of study participants by periodontal status. The study sample (n = 43) was initially categorized into two main groups: Healthy (n = 13) and Periodontitis (n = 30). The periodontitis group was further stratified into three severity levels—mild (n = 9), moderate (n = 13), and severe (n = 8)—based on the 2017 classification of periodontal diseases.
| Measurement | Value |
|---|---|
| Uric Acid (Saliva) | 16.4072 |
| Uric Acid (GCF) | 17.5999 |
| Wilcoxon Test Statistic | 331 |
| Wilcoxon Test p-value | 0.087619 |
4. DISCUSSION
The findings from this study highlight the role of uric acid as an important biomarker in periodontal health and disease. The observed decrease in salivary uric acid levels with increasing periodontal severity supports the hypothesis that oxidative stress plays a pivotal role in periodontitis progression [17].
Uric acid is a key endogenous antioxidant that neutralizes ROS generated during inflammation [18].
In healthy individuals, higher uric acid levels likely reflect a well-maintained systemic antioxidant capacity, which diminishes as the disease progresses [9].
This depletion could be attributed to increased utilization of uric acid to counteract oxidative stress and inflammation in the periodontal microenvironment. Similar findings have been reported in studies linking reduced salivary uric acid levels to systemic oxidative stress in periodontitis patients, supporting its role as a protective molecule in oral and systemic health [19-21].
The absence of significant differences between mild and moderate periodontitis groups in salivary uric acid levels suggests that the metabolic demand for uric acid may reach a plateau during the intermediate stages of the disease. This phenomenon could be attributed to the stabilization of oxidative stress levels at certain stages of tissue destruction or a threshold beyond which additional inflammatory changes do not significantly impact systemic antioxidant levels [22, 23].
Conversely, in severe periodontitis, the dramatic decline in uric acid levels may reflect systemic exhaustion of antioxidant reserves, as suggested by Nishida et al., who observed a correlation between advanced periodontal destruction and systemic depletion of antioxidants [24].
In GCF, uric acid levels also exhibited a significant reduction with increasing disease severity, particularly in the severe group, which was distinct from all other groups. GCF directly interfaces with the periodontal pocket, where ROS and inflammatory mediators are abundantly produced. The higher uric acid levels in healthy and mildly affected individuals may reflect a localized protective response aimed at neutralizing oxidative stress. As periodontitis progresses, the elevated ROS production and increased inflammatory burden could overwhelm the antioxidant capacity, resulting in decreased uric acid concentrations in GCF [25, 26].
This is consistent with findings by Toczewska et al., who demonstrated the significant contribution of oxidative stress to periodontal tissue breakdown and a concomitant decline in antioxidant defenses [27].
Interestingly, the lack of significant differences in GCF uric acid levels between the healthy, mild, and moderate groups suggests that local compensatory mechanisms may maintain GCF uric acid levels during the early stages of periodontal disease. These mechanisms might include upregulated transport of uric acid into GCF or localized antioxidant enzyme activity aimed at mitigating oxidative damage [21].
However, in severe periodontitis, these mechanisms may fail to counteract the overwhelming oxidative stress, leading to the observed reduction in GCF uric acid levels. This aligns with findings from studies by Bai et al., which emphasized the critical balance between oxidative stress and antioxidant defenses in periodontal health [28].
The findings of this study reinforce the emerging consensus that uric acid plays a significant role in the oxidative stress paradigm of periodontal disease. By regrouping participants into healthy and periodontitis categories, a clear and statistically significant reduction in uric acid levels was observed in both saliva and GCF among individuals with periodontitis. This reduction reflects a potential depletion of antioxidant reserves in response to the sustained inflammatory burden present in periodontal tissues.
These results are consistent with previous literature, including studies by Toczewska et al. and Bai et al., which demonstrated diminished antioxidant capacity in the oral environment in association with progressive periodontal destruction [27, 28]. The lower levels of uric acid in GCF may reflect localized oxidative stress at the site of active periodontal inflammation, where ROS are abundantly generated. In parallel, the reduction in salivary uric acid levels suggests that systemic antioxidant balance may also be disrupted, indicating a potential bidirectional interaction between local periodontal inflammation and systemic redox status.
Furthermore, our results align with findings by Ye et al. and Narendra et al., who highlighted the utility of salivary uric acid as a reliable, non-invasive biomarker for assessing periodontal disease severity [7, 20]. The systemic consistency observed between uric acid concentrations in saliva and GCF underscores their complementary roles in periodontal diagnostics. Importantly, the simplification of disease categorization into two primary groups (Healthy vs. Periodontitis) not only addressed statistical power limitations but also provided clearer insights into the redox imbalance characterizing periodontal disease.
The comparison between salivary and GCF uric acid levels revealed no statistically significant differences, suggesting systemic consistency between these two diagnostic fluids. This finding is supported by the shared physiological origins of uric acid in both fluids, which reflect systemic oxidative stress and local periodontal conditions [26, 29].
However, slight variations may exist due to the distinct biochemical environments of saliva and GCF. Saliva provides a systemic overview, influenced by factors such as dietary intake and systemic health, while GCF directly reflects the localized inflammatory and oxidative status of the periodontal tissues. This dual perspective highlights the value of evaluating both fluids for a comprehensive understanding of periodontal disease dynamics [30].
Previous studies have shown mixed findings regarding the relationship between uric acid levels in different oral fluids and periodontal disease. Some studies have reported significantly lower uric acid levels in GCF compared to saliva in periodontitis patients, attributing this to the localized depletion of antioxidants in the inflamed periodontal pocket. Others, however, have noted systemic consistency in uric acid levels between the two fluids, as observed in this study. These discrepancies could be due to differences in study design, participant characteristics, or analytical methods [9, 27, 31, 32].
The results of this study underscore the importance of oxidative stress and antioxidant dynamics in periodontal health and disease. Uric acid appears to play a dual role, acting as a systemic biomarker of oxidative stress and a local defender against periodontal inflammation. Future research should explore the molecular pathways governing uric acid metabolism in the context of periodontal disease, with an emphasis on its diagnostic and therapeutic potential.
Within the limitations of this study, several factors should be considered when interpreting the findings. The relatively small sample size, particularly within certain periodontal subgroups, may limit the statistical power and reduce the generalizability of the results to larger or more diverse populations. The cross-sectional nature of the study also restricts the ability to draw causal inferences regarding the relationship between uric acid levels and periodontal disease progression. Additionally, dietary intake and systemic antioxidant status—both of which can influence uric acid concentrations—were not controlled or assessed, potentially introducing confounding variables. The study was conducted within a single academic institution, which may further limit the external validity of the results. Future research involving larger, multicenter cohorts and longitudinal designs is recommended to validate these findings and enhance their applicability in broader clinical settings.
CONCLUSION
Significant reductions in uric acid levels were observed in both saliva and GCF among individuals with periodontitis when compared to healthy controls. This trend remained consistent across both fluids, supporting the hypothesis that oxidative stress is elevated in periodontal disease and contributes to the depletion of antioxidant reserves such as uric acid.
The consistency of uric acid concentrations between saliva and GCF suggests that both fluids may serve as reliable and non-invasive biomarkers for evaluating periodontal health. Salivary uric acid, in particular, demonstrated strong discriminatory potential, reflecting systemic oxidative balance, while GCF provided localized insight into periodontal inflammation.
By merging periodontitis stages into a single group, the statistical power of the analysis was enhanced, allowing for more robust comparisons. The results confirm that uric acid plays a meaningful role in the redox imbalance associated with periodontitis and support its clinical utility in monitoring disease status.
These findings contribute to the growing body of evidence supporting the diagnostic value of salivary and crevicular biomarkers in periodontology and underscore the importance of oxidative stress in periodontal pathophysiology.
AUTHORS’ CONTRIBUTIONS
The authors confirm their contribution to the paper: N.T.H. and M.M.R.: Study conception and design; H.K.Y., M.S.T., S.F., N.M.H., and A.C.: Data collection; N.T.H., P.S., R.M., and M.S.I.: Analysis and interpretation of results; N.T.H., S.P.P., N.C.C, and S.E.B.: Draft manuscript. All authors reviewed the results and approved the final version of the manuscript.
LIST OF ABBREVIATIONS
| GCF | = Gingival Crevicular Fluid |
| AAP | = American Academy of Periodontology |
| EFP | = European Federation of Periodontology |
| CAL | = Clinical Attachment Loss |
| ROS | = Reactive Oxygen Species |
ETHICS APPROVAL AND CONSENT TO PARTICIPATE
This study was approved by the Research and Ethics Committee of RAKMHSU, with ethical clearance no: RAKMHSU-REC-043-2022/23-UG-D.
HUMAN AND ANIMAL RIGHTS
All procedures performed in studies involving human participants were in accordance with the ethical standards of the institutional and/or research committee and with the 1975 Declaration of Helsinki, as revised in 2013.
AVAILABILITY OF DATA AND MATERIALS
The data and supportive information are available within the article.
FUNDING
This research was funded by RAK College of Dental Sciences, United Arab Emirates, under the Grant No. 2.
ACKNOWLEDGEMENTS
Declared none.

