All published articles of this journal are available on ScienceDirect.

Comparative Analysis of Mandibular Cortical Bone Indicators of Osteoporosis: CBCT vs. Traditional Panoramic Radiographs
Abstract
Background/Introduction
Osteoporosis decreases bone density and increases fracture risk. Radiographic techniques, such as panoramic radiography (PAN) and cone-beam computed tomography (CBCT), can aid in assessing bone health, particularly through mandibular cortical indices.
Objectives
This study aimed to compare the values of radiomorphometric mandibular indices between conventional panoramic radiographs (PAN) and CBCT-reformatted panoramic radiographs (CRP).
Methods
A retrospective analysis of the radiographic records of 96 patients was performed. The recorded measurements and indices included anteroinferior mandibular cortex thickness (AIMC), mental index (MI), panoramic mandibular index (PMI), gonial index (GI), antegonial index (AI), mandibular cortical index (MCI), and molar cortical thickness (MCT). Intra-class coefficient (ICC) analysis was carried out to assess inter- and intra-examiner reliability.
Results
Significant differences (p < 0.05) were found between CRP and PAN measurements for most indices (AIMC, MI, PMI, MCT, and AI), with CRP values generally lower. The GI index showed no significant difference between both modalities. Two-way ANOVA revealed significant effects of age and gender on specific indices. Additionally, MCI categorical analysis demonstrated a significant association between CRP and PAN.
Discussion
Different mandibular indices varied across the imaging modalities, with AIMC, MI, PMI, MCT, and AI showing lower values on CRP, while GI remained consistent across methods. This suggests that some indices may be more sensitive to imaging resolution and projection geometry. The moderate agreement in MCI classification highlights CRP’s potential for improved visualization of cortical erosion. The influence of age and gender highlights the importance of demographic context. However, the lack of DXA comparison remains a limitation.
Conclusion
Although the differences in indices measured on PAN and CRP were statistically significant, their mean values differed by less than a millimeter. Age and gender influence certain indices, underscoring the need for their consideration in clinical assessments. CBCT can be a valuable tool for enhancing the accuracy of osteoporosis diagnosis.
1. INTRODUCTION
Osteoporosis is a systemic skeletal disease characterized by reduced bone density and structural deterioration, leading to increased fragility and fracture risk. This condition represents a significant global health concern, contributing to morbidity and escalating healthcare costs worldwide [1, 2].
Identifying reliable and accessible methods for assessing bone health is crucial for early detection and management. While dual-energy X-ray absorptiometry (DXA) is the gold standard [3, 4], other techniques, including quantitative CT (QCT) [5], panoramic radiography (PAN) [6], CBCT [7], and quantitative ultrasound (QUS) [8], have shown promise.
A potential approach involves evaluating the cortical bone thickness at the inferior mandibular border through radiographic imaging, including CBCT and PAN [3, 6]. Multiple studies have explored the correlation between mandibular cortical thickness and osteoporosis diagnosis [9-12]. Mandibular cortical indices, such as the mandibular cortical index (MCI), mental index (MI), and panoramic mandibular index (PMI), have been proposed for osteoporosis screening [13]. The PMI measures the ratio between the thickness of the mandibular cortex and the distance from the mental foramen to the inferior border of the mandible, while the MCI classifies the morphology and architecture of the inferior cortex [14, 15].
Panoramic radiographs are widely used in dental clinics due to their simplicity, yet CBCT provides superior three-dimensional imaging for detailed mandibular cortical bone assessments [16, 17]. Recent studies have highlighted the accuracy of CBCT in detecting cortical porosity and bone density changes, particularly for PMI and MCI, which are critical for osteoporosis screening [18, 19].
The current study aims to compare the measurements of cortical bone thickness obtained from different radiomorphometric indices between conventional and CBCT-reformatted panoramic radiographs. Despite the wealth of literature on CBCT and PAN comparisons, the rationale for this study lies in addressing the gap in evaluating these imaging modalities, specifically within a Palestinian population. Given potential genetic, dietary, and environmental influences on bone density, this population-specific approach may yield insights relevant to localized screening protocols [20]. Moreover, to our knowledge, this study represents the first attempt to compare CBCT-reformatted and conventional panoramic radiographs for osteoporosis screening in the Palestinian population.
2. MATERIALS AND METHODS
This retrospective observational study analyzed radiographic data from patients receiving general dental treatments at the Arab American University Medical Center in Ramallah, Palestine, between January 2018 and July 2024. This study was conducted in accordance with ethical guidelines and received approval from the Helsinki Committee of the Palestinian Health Research Council (PHRC), Palestine, under approval number PHRC/HC/1227/22, dated 5/12/2022.
2.1. The Inclusion Criteria
The inclusion criteria are as follows:
1. Patients aged 18 to 70 years of both genders.
2. The absence of jaw pathologies that hinder the assessment of regions of interest.
3. CBCT volumes depicting the full extent of the mandible and condyles.
4. Patients who underwent both panoramic and CBCT imaging within a six-month interval.
5. Patients with their mandibular first molars are still present in the oral cavity.
6. Panoramic radiographs (both conventional and CBCT) clearly depicting the mental foramen structure.
2.2. The Exclusion Criteria
The exclusion criteria are as follows:
1. Radiographs of low quality or with evident distortions.
2. Unclear cortical borders of the mandible, mental foramen, or condyle.
3. Presence of jaw pathology that hinders assessment in the region of interest.
4. Absence of the first permanent lower molar.
The specifications of the X-ray machines (panoramic and CBCT) used for the radiographic exposures are detailed in Table 1. The radiographs were analyzed by two examiners: a maxillofacial radiologist and a second investigator. CBCT reformatted panoramic views (CRP) were reconstructed with a thickness of 25 mm using the automatic arch creator tool at the axial level of the mid-root region of the lower anterior teeth, with the sharpness filter set to “2X.” The principal investigator conducted the initial analysis and partially repeated it two weeks later to ensure consistency. An independent second examiner also performed part of the analysis. Before commencing the analysis, both examiners received independent training to align with the established methodology. The patients’ age and gender were documented. Cortical bone thickness was measured at five sites: the central incisor (aligned with the mid-root), mental foramen, and first molar, gonial, and antegonial regions. The recorded measurements (indices) included anteroinferior mandibular cortex thickness (AIMC), mental index (MI), panoramic mandibular index (PMI), gonial index (GI), antegonial index (AI), mandibular cortical index (MCI), and molar cortical thickness (MCT) (Table 2). These measurements were conducted on conventional panoramic radiographs and then repeated for comparison at the corresponding sites on the CBCT reformatted panoramic views of the same patients (Figs. 1 and 2).
Statistical analysis was performed to compare the differences in various indices measured using CRP and PAN. The indices analyzed included MI, PMI, MCT, AI, GI, and MCI. The sample size was determined based on an expected moderate effect size (Cohen’s d = 0.5), a significance level of 0.05, and a power of 0.8, providing sufficient power to detect significant differences and allowing for detailed subgroup analyses. Data from 96 patients were collected, with each side of the mandible (right and left) recorded along with the patient's age and gender. Descriptive statistics, including mean and standard deviation, were calculated for each index. Paired t-tests were conducted to examine the differences in the mean score of each quantitative index between PAN and CRP imaging methods. Fisher’s exact test and Cohen’s kappa statistic were conducted to assess the significance of the association/agreement between readings obtained from CRP and PAN for the MCI index. Two-way repeated measures ANOVA models were conducted for each index as the main outcome variable to examine the effect of age and gender. Statistical significance was sought at values lower than 5%. All statistical analyses were conducted using the Statistical Package for Social Sciences (SPSS) software version 26.0 (IBM Software Group, Chicago, IL, USA).
| - | Conventional Panorama (PAN) | CBCT Reformatted Panorama (CRP) |
|---|---|---|
| Machine model | Sirona® XG5® (Dentsply Sirona®, Bensheim, Germany) | i-CAT™ FLX 17 (DEXIS™, Pennsylvania, USA) |
| Exposure parameters | 64-73 kVp, 112 mAs | 120 kVp, 5 mA, 4.8 to 26.9 seconds |
| Software used for the analysis | Sidexis® 4 software (Dentsply® Sirona®, Bensheim, Germany) | OnDemand® 3D Software (CyberMed®, Seoul, South Korea) |
| Viewing monitor | Desktop-grade | Desktop-grade |
| Analysis | Description |
|---|---|
| Anteroinferior mandibular cortex (AIMC) | The length of the inferior mandibular cortex (IMC) was measured from its highest to lowest points in line with the mid-root of the central incisor. |
| Mental index (MI) [31, 33] /Mandibular cortical width (MCW) | Cortical thickness was measured by the portrayal of a perpendicular line from the base of the mandible to the midpoint of the mental foramen. |
| Panoramic mandibular index (PMI) [33] | This index represents the ratio of mandibular cortical width to the vertical distance between the inferior border of the mandible and either the superior or inferior margin of the mental foramen; in this study, the inferior margin was used. |
| Gonial index (GI) [31] | Cortical thickness was measured along the bisectrix of the angle formed by two tangential lines creating the gonial angle. |
| Antegonial (AI) [33] | Cortical thickness was measured at the point where a line drawn along the anterior border of the ascending ramus intersected the inferior border of the mandible. |
| Mandibular cortical index (MCI) [28] |
C1 – “Normal Cortex”: The endosteal margin appears smooth, continuous, and well-defined on both sides, indicating normal cortical integrity. C2 – “Moderately Eroded Cortex”: The endosteal margin exhibits semilunar resorption defects or forms cortical residues. C3 – “Severely Eroded or Porous Cortex”: The cortical border is characterized by pronounced porosity and the presence of irregular endosteal remnants, reflecting advanced cortical degeneration. |
| Molar cortical thickness (MCT) [31] | Cortical thickness was measured along a line perpendicular to the inferior border of the mandible at the level of the distal root of the first permanent molar. |
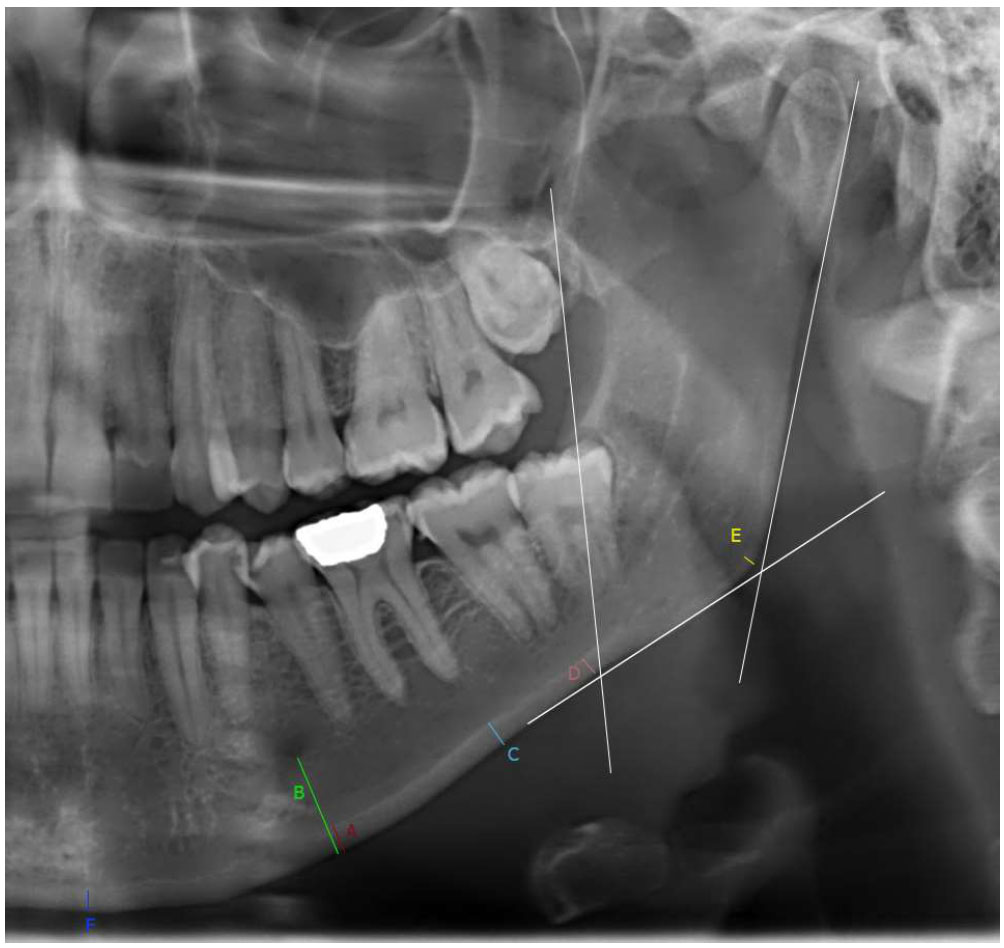
Radiomorphometric indices measured on a conventional panoramic radiograph (PAN). (A) Mental index, panoramic mandibular index (PMI = A/B), (C) molar cortical thickness, (D) antegonial index, (E) gonial index, and (F) anteroinferior mandibular cortex thickness (AIMC).
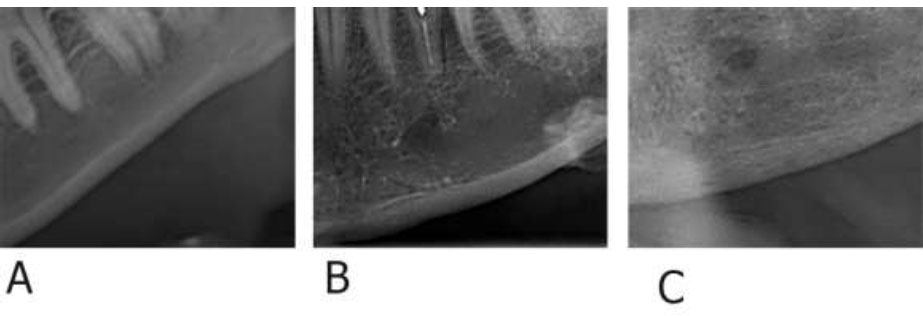
Examples of Mandibular Cortical Index (MCI) classifications: (A) C1 – Normal cortex, (B) C2 – Moderately eroded cortex, (C) C3 – Severely eroded cortex.
3. RESULTS
This study analyzed radiographs from 96 patients (51% females and 49% males), with measurements taken from both the right and left sides of the mandible. The patients' ages ranged from 19 to 78 years, with an average age of 45 years. The indices evaluated included MI, PMI, MCT, AI, GI, and MCI, using CRP and PAN imaging techniques. Table 3 presents the mean scores and standard deviations of each quantitative index for the PAN and CRP imaging techniques, along with the results of the paired samples t-tests for all quantitative indices. The results of the paired samples t-test revealed statistically significant differences in the mean scores of AIMC (3.5 ± 1.08 versus 2.91 ± 0.77, p-value < 0.001), MI (4.34 ± 1.11 versus 3.70 ± 0.81, p-value < 0.001), PMI (0.34 ± 0.09 versus 0.30 ± 0.08, p-value < 0.001), MCT (3.71 ± 0.92 versus 3.19 ± 0.65, p-value < 0.001), and AI (3.5 ± 0.88 versus 2.98 ± 0.65, p-value < 0.001) between the PAN and CRP imaging techniques, respectively. The average scores of these indices using the CRP imaging method were all less than those of the PAN method. However, the paired samples t-test did not show a statistically significant difference in the mean GI index between the two imaging methods. Additionally, there was a statistically significant association (p < 0.001) between the MCI categories on PAN and CRP (Table 3).
The descriptive statistical analysis of mandibular cortical indices, stratified by gender and age, including mean values and ranges, is presented in Tables 4 and 5. Two-way ANOVA revealed a significant effect of age on AIMC measured using CBCT (p = 0.002) and PAN (p = 0.006), indicating that these indices are influenced by age. Gender also had a significant main effect on MI obtained from PAN (p < 0.001). The intra-observer intraclass correlation coefficient (ICC) for all the measured variables was 0.871Avg. [95% CI: 0.215-0.989], indicating good reliability. Similarly, the inter-observer was 0.81Avg. [95% CI: 0.287-0.998], also reflecting good reliability.
| - | PAN | CRP | Difference in Means | T-statistic | p-value† | |||
|---|---|---|---|---|---|---|---|---|
| Range | Mean (±SD) | Range | Mean (±SD) | |||||
| AIMC | 0.96- 6.55 | 3.50 (1.08) | 1.16-5.75 | 2.91 (0.77) | 0.59 | -10.36 | < 0.001* | |
| MI | 1.3-7.33 | 4.339(1.11) | 1.26-5.9 | 3.704(0.810) | 0.635 | -8.91 | < 0.001* | |
| PMI | 0.005-.0586 | 0.337(0.09) | 0.096-0.52 | 0.3 (0.078) | 0.037 | -6.83 | < 0.001* | |
| MCT | 1.05-8.07 | 3.71(0.92) | 1.31-5.78 | 3.19(0.65) | 0.52 | -11.29 | < 0.001* | |
| AI | 1.29-6.82 | 3.5(0.88) | 1.17-4.56 | 2.98(0.65) | 0.52 | -8.71 | < 0.001* | |
| GI | 0-2.78 | 1.13(0.42) | 0.3-2.02 | 1.09(0.30) | 0.04 | -1.34 | 0.182 | |
| - | Fisher’s Exact Test | Kappa | ||||||
| MCI | Count (#) | Count (#) | Statistic | p-value | Statistic | p-value | ||
| C1 | 22 | 32 | 56.663 | < 0.001* | 0.497 | < 0.001* | ||
| C2 | 167 | 157 | ||||||
| C3 | 3 | 3 | ||||||
| - | Male | Female | ||
|---|---|---|---|---|
| - | PAN | CRP | PAN | CRP |
| Mean [Range] | Mean [Range] | Mean [Range] | Mean [Range] | |
| AIMC | 3.66 [1.24-6.55] | 3.03 [1.16-5.75] | 3.33 [0.96-6.05] | 2.80 [1.46-4.77] |
| MI | 4.68 [2.92-7.33] | 3.79 [1.81-5.90] | 4.01 [1.30-6.60] | 3.62 [1.26-5.90] |
| PMI | 0.34 [0.01-0.52] | 0.30 [0.12-0.52] | 0.34 [0.09-0.59] | 0.30 [0.10-0.52] |
| MCT | 3.84 [2.29-8.07] | 3.25 [1.87-5.78] | 3.59 [1.05-5.47] | 3.13 [1.31-4.15] |
| AI | 3.56 [1.80-6.82] | 3.02 [1.18-4.38] | 3.43 [1.29-5.86] | 2.94 [1.17-4.56] |
| GI | 1.16 [0.32-2.14] | 1.08 [0.30-1.90] | 1.11 [0.00-2.78] | 1.10 [0.54-2.02] |
| - | - | |||
| MCI | Count (#) | Count (#) | Count (#) | Count (#) |
| C1 | 8 | 9 | 24 | 13 |
| C2 | 85 | 84 | 72 | 83 |
| C3 | 1 | 1 | 2 | 2 |
| - |
Young Adult (18-29 years) |
Adult (30-44 years) |
Middle-aged (45-59 years) |
Senior (60 and above) |
||||
|---|---|---|---|---|---|---|---|---|
| PAN | CRP | PAN | CRP | PAN | CRP | PAN | CRP | |
| Mean [Range] | Mean [Range] | Mean [Range] | Mean [Range] | Mean [Range] | Mean [Range] | Mean [Range] | Mean [Range] | |
| AIMC | 3.49[1.24-6.05] | 2.76[1.16-4.77] | 3.21[1.24-4.81] | 2.75[1.16-4.58] | 3.46[0.96-5.50] | 2.94[1.46-4.65] | 4.33[2.06-6.55] | 3.38[1.90-5.75] |
| MI | 4.55[3.12-7.18] | 3.80 [2.51-5.45] | 4.12[2.92-6.79] | 3.61[2.56-5.54] | 4.32[1.30-7.33] | 3.77[1.26-5.90] | 4.72[3.13-7.18] | 3.66[1.81-5.90] |
| PMI | 0.33[0.10-0.44] | 0.31[0.12-0.52] | 0.34[0.22-0.52] | 0.30[0.14-0.52] | 0.34[0.01-0.59] | 0.30[0.10-0.52] | 0.34[0.22-0.54] | 0.29[0.14-0.52] |
| MCT | 3.53[2.44-4.62] | 3.02[2.13- 4.08] | 3.79[2.29-5.47] | 3.19[2.17-4.15] | 3.59[1.05-8.07] | 3.21[1.31-5.78] | 4.04[2.44-8.07] | 3.26[1.87-5.78] |
| AI | 3.37[2.05-5.86] | 2.99[1.69-4.14] | 3.48[1.80-5.86] | 3.01[1.17-4.56] | 3.51[1.29-5.86] | 2.90[1.18-4.30] | 3.62[1.80-6.82] | 3.09[1.18-4.38] |
| GI | 1.09[0.36-1.92] | 1.10[0.54-1.76] | 1.16[0.32-2.20] | 1.15[0.56-2.02] | 1.16[0.00-2.78] | 1.05[0.30-1.90] | 1.02[0.32-2.14] | 1.02[0.56-1.67] |
| MCI | # | # | # | # | # | # | # | # |
| C1 | 4 | 7 | 12 | 10 | 14 | 4 | 2 | 1 |
| C2 | 22 | 19 | 54 | 56 | 58 | 68 | 23 | 24 |
| C3 | 0 | 0 | 0 | 0 | 2 | 2 | 1 | 1 |
4. DISCUSSION
This study revealed significant differences between CRP and PAN measurements for most mandibular indices, although these differences were submillimeter (0.39 (Avg.) [ 0.037(Min.) - 0.635 (Max.)]). While statistically significant, it is essential to consider whether these small differences have clinical relevance in guiding diagnosis or management. The potential impact on clinical decisions, such as osteoporosis screening or risk assessment, should be further evaluated. Age and gender significantly influenced only a limited number of indices.
Using the MI/MCW method, measurements between ≤ 3 mm and ≤ 4.5 mm suggest osteoporosis [21]. Although PMI values typically range from 0.27 to 0.38, a threshold of less than 0.3 is commonly employed by researchers to identify osteopenia [21].
Healthy older people with Class 3 MCI (C3), an MI/MCW of less than 3 mm, and a PMI ratio below 0.3 were found to have a strong link with lower BMD T-scores as evaluated by QUS, which suggests a higher risk of osteoporosis, according to a study by Kiswanjaya et al. [21]. Furthermore, the correlation coefficient for MCI was found to be stronger than that for PMI and MI/MCW [21]. The mandibular cortical index (MCI) can serve as an effective screening tool for detecting osteoporosis [22]. It was found [23] that a higher MCI category (mainly C3) is linked to lower bone mineral density (BMD) values.
A study [24] conducted in Iran concluded that indices, such as MI and antegonial index (AI), along with the qualitative trabecular pattern (TP) index, could serve as reliable predictors for assessing the risk of osteoporosis in postmenopausal women.
In a recent systematic review by Heuchert et al. [25] that assessed the effectiveness of various mandibular radiomorphometric indices (such as MCI, MCW, and PMI) compared to DEXA-derived BMD measurements, it was concluded that while these indices could serve as valuable screening tools to detect individuals with low bone mineral density (BMD), they are not suitable for definitive diagnosis. The study found that none of the indices demonstrated optimal sensitivity and specificity. Among the indices examined, the mandibular cortical width (MCW) was considered the most effective, particularly with a cut-off value of less than 3 mm. Conversely, the MCI was deemed the least effective for identifying osteoporosis, especially when comparing classifications C1 + C2 against C3 [25].
Although this study does not aim to compare the mandibular cortical indices with patients diagnosed with osteoporosis, a comparison of the indices measured with reported cutoff values for these measures was performed. Considering a cutoff value of ≤ 3 mm for MI and < 0.3 for PMI as indicative of osteoporosis or a high risk of osteoporosis, MI was ≤ 3 mm in 34 readings from CRP and 13 from PAN, and PMI was less than 0.3 in 94 and 70 readings on CRP and PAN, respectively. Nonetheless, the mean values for MI and PMI were within normal ranges. Interestingly, only three mandibular sides (2 patients) among the analyzed sample presented with MCI category 3 (C3). A summary of multiple reports worldwide concerning radiomorphometric mandibular indices is presented in Table 6.
While the literature defining anteroinferior mandibular cortex (AIMC) measurements is quite limited, we believed it was valuable to include these measurements in our study, as they could provide meaningful insights.
| # | Author | Country | Sample | Technique | MI/MCW | PMI | AI | GI | MCI |
|---|---|---|---|---|---|---|---|---|---|
| 1. | Tanaka et al. (2020) [34] | Hong Kong | 700 | PAN | M: 4.4 ± 0.9. F: 4.0 ± 1.2 |
- | - | - | M: C1 – 46.9%, C2 – 49.7%, C3 – 3.4%; F: C1 – 41.2%, C2 – 47.1%, C3 – 11.7% |
| 2. | Dwivedi et al. (2021) [35] | India | 80 | PAN | M [4.86 Avg. (≤60 Y) - 4.87 Avg. (>60 Y)]. F [4.19 Avg. (>60 Y) - 4.62 Avg. (≤60 Y)] | M [0.12 Avg.- 0.53 Avg.]. F [0.12 Avg.- 0.55 Avg.] | - | - | C1: 0%; C2 – M: ≤60 Y – 93%, >60 Y – 67%; F: ≤60 Y – 73%, >60 Y – 13%; C3 – M: ≤60 Y – 7.1%, >60 Y – 33%; F: ≤60 Y – 26.7%, >60 Y – 87% |
| 3. | Pavicin et al. (2014) [36] | Croatia | 112 | PAN, DXA | 3.58 ± 0.63 | 0.38 ± 0.09 | 2.99 ± 0.77 | 1.58 ± 0.65 | C1: 48.2%, C2: 47.3%, C3: 4.5% |
| 4. | Khatoonabad et al. (2011) [37] | Iran | 140 | PAN, DXA | N: 3.81 ± 0.64, ON: 3.43 ± 0.76, OP: 2.84 ± 0.58 | N: 0.26 ± 0.06, ON: 0.25 ± 0.06, OP: 0.22 ± 0.07 | - | - | N: C1 – 57%, C2 – 43%, C3 – 0%; ON: C1 – 34.24%, C2 – 58.9%, C3 – 6.86%; OP: C1 – 27.27%, C2 – 54.54%, C3 – 18.18% |
| 5. | Kim et al. (2016) [38] | Korea | 194 | PAN, DXA | 2.7 ± 0.7 | - | - | - | C1: 23.7%, C2: 48.9%, C3: 30.4% |
| 6. | Vlasiadis et al. (2007) [23] | Greece | 133 | PAN, DXA | 4.57 ± 1.03 | 0.38 ± 0.24 | - | - | - |
| 7. | Balto et al. (2018) [39] | Saudi Arabia | 431 | PAN, DXA | 4.68 ± 1.29 | 0.442 ± 0.093 | - | - | - |
| 8. | Drozdzowska et al. (2002) [40] | Poland | 30 | PAN, DXA, QUS | 4.71 | 0.38 ± 0.13 | - | - | N: C1 – 31%, C2 – 44%, C3 – 25%; ON: C1 – 8%, C2 – 67%, C3 – 25%; OP: C1 – 0%, C2 – 50%, C3 – 50% |
| 9. | Kiswanjaya et al. (2022) [21] | Indonesia | 371 | PAN, QUS | M: 3.4 ± 0.54 F: 3.28 ± 0.59 |
M:0.32 ± 0.05 F: 0.31 ± 0.06 |
- | - | M: C1 – 70.3%, C2 – 25.3%, C3 – 4.4%; F: C1 – 16.9%, C2 – 67.2%, C3 – 15.9% |
| 10. | Mansour et al. (2013) [41] | Saudi Arabia | 100 | PAN, DXA | 4.36 ± 0.92 | 0.33 ± 0.07 | - | - | C1: 59%; C2: 38%, C3: 3% |
| 11. | Nasreen et al. (2019) [42] | India | 60 | PAN, blood sample | Urban: 2.88, Rural: 3.82 | Urban: 0.24, Rural: 0.32 | - | - | C1: 23.3%; C2: 41.7%; C3: 35% |
| 12. | Dagistan et al. (2010) [27] | Turkey | 40 | PAN, DXA | OP: 5.71. CO: 7.40 |
OP: 0.35. CO: 0.43 |
OP: 4.17. CO: 5.21 | - | C1: 37.5%; C2: 40%; C3: 22.5% |
| 13. | Gulsahi et al. (2010) [43] | Turkey | 49 | PAN, DXA | N: 3.9 ± 1.0. ON/OP: 2.9 ± 1.1 |
N: 0.33 ± 0.09. ON/OP: 0.26 ± 0.10 |
- | - | N: C1 – 77%, C2 – 41%, C3 – 17%; ON/OP: C1 – 23%, C2 – 59%, C3 – 83% |
| 14. | Alam et al. (2020) [44] | Saudi Arabia | 60 | PAN, DXA | OP: 4.9 ± 1.0. NOP: 4.8 ± 0.9 | OP: 0.36 ± 0.08. NOP: 0.35 ± 0.08 |
- | - | OP: C1 – 5, C2 – 20, C3 – 5; NOP: C1 – 18, C2 – 12, C3 – 0. * |
Both the MI and PMI indices demonstrated statistically significant differences between the CRP and PAN imaging techniques. PAN consistently yielded higher index values for both MI and PMI compared to CRP. This suggests that the two imaging techniques yield significantly different measurements for these indices. In the same manner, AIMC, MCT, and AI measurements between CRP and PAN are statistically significant, with PAN measurements generally being higher.
Additionally, a statistically significant association was observed between the MCI categories on PAN and CRP (p<0.001). The agreement between the two imaging methods was moderate, with a Cohen's Kappa value of 0.497 (p<0.001), indicating consistent classification in about half of the cases. Clinically, this moderate agreement suggests that CRP may provide a more detailed evaluation of cortical erosion, potentially offering enhanced precision in borderline cases. However, further studies are needed to validate the clinical significance of these differences.
Interestingly, the difference in gonial index (GI) measurements between CRP and PAN was not statistically significant, indicating no substantial difference between the two methods for measuring the gonial index.
The findings of this study highlight the varying effects of age and gender on radiomorphometric mandibular indices. Age significantly influenced AIMC (CBCT and PAN), suggesting that mandibular cortical thickness varies with advancing age. Gender had a significant impact on MI (PAN), indicating that gender differences, potentially driven by hormonal or anatomical factors, may influence mandibular indices, particularly in panoramic-derived measurements. These findings suggest that demographic factors should be accounted for but may not significantly alter diagnostic outcomes when using these indices for osteoporosis screening.
A study utilizing quantitative ultrasound (QUS) bone densitometry revealed that both genders classified with MCI of C2 and C3 exhibited lesser jawbone stiffness compared to those with C1 [26].
In a study by Koseoglu Secgin et al. [19], the MCI, MI, and PMI were compared using CBCT (both cross-sectional and reformatted panoramic) and conventional panoramic images. The study found that panoramic imaging was inadequate for accurately diagnosing nearly 50% of the patients classified as C3. Following the application of magnification correction, the panorama’s MI values aligned closely with those derived from cross-sectional images. When comparing CBCT and panoramic radiographs, there was moderate to good agreement in PMI values [19]. For assessing mandibular indices, CBCT cross-sectional reconstructions are recommended, as they clearly depict the inferior mandibular structure in all three dimensions [19].
A study by Dagistan et al. [27] revealed that MI, PMI, and AI values, key radiomorphometric indices, were notably lower in male osteoporosis patients than in healthy individuals. These findings strongly suggest that these indices, commonly used as supplementary diagnostic tools for osteoporosis in women, could be equally effective for diagnosing osteoporosis in men [27].
In a study by Neves et al. [28], panoramic radiomorphometric indices were used to assess the risk of low bone density in individuals with sickle cell disease (SCD). The study included seventy-eight Brazilian participants with SCD, divided into different age groups (above and below 40 years). The data revealed that individuals with SCD had reduced PMI, MI, and MCI (i.e., C2), particularly manifested among older age patients. Consequently, the radiomorphometric indices used in this investigation demonstrated their efficacy in diagnosing poor bone density in SCD patients through panoramic radiography [28]. Analysis of panoramic radiomorphometric indices and fractal dimensions (i.e., a mathematical technique employed to characterize and examine the complexity of shapes and structural patterns, like those observed in bone tissue) [29] did not detect notable bone alterations in women diagnosed with celiac disease [30].
A study [31] found substantial variations in cortical bone measures between female and male patients. The cortical bone thickness indices, i.e., MI, MCT, and GI, were greater in male patients than female patients and substantially lower in the youngest age group (18-30 years) compared to the three older age groups. It was proposed [31] that the mandibular cortex undergoes continuous remodeling with age and is potentially influenced by gender.
MCT and PMI values from panoramic radiographs of females with osteoporosis were compared to mandibular bone measures from DXA scans [32]. The study revealed a significant correlation between the two approaches. The researchers concluded that PMI and MCT might be used as a marker of mandibular bone density [32].
A study conducted by Ledgerton [33] analyzed panoramic radiomorphometric indices in a sample of British female patients. Results revealed a significant negative correlation between age and all quantitative indices (GI, MI, PMI, and AI), while MCI displayed an age-dependent pattern. However, the study highlighted issues with measurement repeatability and accuracy, particularly concerning GI, which could limit its practical use [33].
CONCLUSION
Although the mean differences were submillimeter, the comparative analysis of mandibular indices between CRP and conventional panorama revealed statistically significant differences in most of the indices measured. The indices, such as AIMC, MI, PMI, MCT, and AI, showed lower values when measured using CRP compared to PAN, indicating potential variances in measurement accuracy or imaging modality characteristics. The GI index did not exhibit significant differences between the two imaging methods, suggesting consistency in this particular index across both modalities. Additionally, the categorical analysis of MCI showed a significant association between CRP and PAN, with CRP noted to provide a more detailed and potentially accurate representation of cortical erosion levels.
The clinical relevance of these findings lies in the potential of CRP to enhance the precision of osteoporosis screening and diagnosis by offering a more detailed evaluation of cortical changes. This underscores the importance of selecting the appropriate imaging modality based on specific diagnostic requirements. While PAN remains widely used in clinical settings due to its accessibility and simplicity, CBCT-derived CRP may offer improved accuracy, particularly in borderline cases where subtle cortical changes need to be assessed more precisely.
These findings also highlight the influence of demographic factors, such as age and gender, on mandibular indices, reinforcing the need to consider these variables when interpreting radiographic data.
Future research should validate these results in larger, more diverse populations and explore the integration of CRP findings with DXA measurements to establish a comprehensive framework for bone health assessment.
As this study focuses on a specific patient population, further research is necessary to confirm its applicability across other demographic groups. Both CRP and PAN remain valuable, but incorporating CBCT may offer a more accurate approach to osteoporosis diagnosis.
STUDY LIMITATIONS
A key limitation of this study is the absence of DXA measurements, the gold standard for assessing bone mineral density, limiting direct correlation with osteoporosis diagnoses.
Another limitation is generalizability, as findings are based on a sample of 96 Palestinian patients. Mandibular indices may vary due to genetic, environmental, and dietary factors, necessitating further research across larger and more diverse populations to refine diagnostic thresholds.
AUTHORS’ CONTRIBUTIONS
The authors confirm their contribution to the paper as follows: K.R.B.: Study conception and design; S.B.: Data collection; M.A.T.: Draft manuscript. All authors reviewed the results and approved the final version of the manuscript.
LIST OF ABBREVIATIONS
| AIMC | = Anteroinferior Mandibular Cortex |
| AI | = Antegonial Index |
| BMD | = Bone Mineral Density |
| CBCT | = Cone-beam Computed Tomography |
| CRP | = CBCT-reformatted Panoramic Radiograph |
| DXA | = Dual-energy X-ray Absorptiometry |
| GI | = Gonial Index |
| MCW | = Mandibular Cortical Width |
| MCI | = Mandibular Cortical Index |
| MI | = Mental Index |
| MCT | = Molar Cortical Thickness |
| PAN | = Conventional Panoramic Radiograph |
| PMI | = Panoramic Mandibular Index |
| QCT | = Quantitative Computed Tomography |
| QUS | = Quantitative Ultrasound |
| PHRC | = Palestinian Health Research Council |
ETHICS APPROVAL AND CONSENT TO PARTICIPATE
Ethical approval was granted by the Palestinian Health Research Council (PHRC), Palestine, under approval number PHRC/HC/1227/22, dated 5/12/2022.
HUMAN AND ANIMAL RIGHTS
All procedures performed in studies involving human participants were in accordance with the ethical standards of institutional and/or research committee and with the 1975 Declaration of Helsinki, as revised in 2013.
CONSENT FOR PUBLICATION
It is not applicable as the provided X-rays are anonymous images that do not identify the individuals directly or indirectly.
AVAILABILITY OF DATA AND MATERIALS
The data supporting the findings of the article will be available from the corresponding author [M.F.A-T] upon reasonable request.
ACKNOWLEDGEMENTS
The authors would like to thank Dr.Wajeeh Sarsoor for his valuable assistance in the statistical analysis.

