All published articles of this journal are available on ScienceDirect.

A Comprehensive Study on Dentogingival Dimensions in the Maxillary Anterior Region with CBCT Imaging
Authors Info & Affiliations
Abstract
Introduction
Cone beam computed tomography (CBCT) is increasingly recognized as a non-invasive diagnostic tool for evaluating the morphological features of dentogingival tissues, especially in the anterior maxilla. Although this technology has only recently been implemented in Vietnam, this study aims to explore its application in assessing dentogingival morphology using CBCT. The findings from this research are expected to contribute to the growing body of knowledge on the use of CBCT in dental diagnostics and improve clinical outcomes in the country. Our study aims to identify differences in gingival thickness and bone thickness in the maxillary anterior region while also analyzing the correlation between them using CBCT imaging.
Materials and Methods
The study involved 360 anterior maxillary teeth, which were selected from the data of 60 patients treated at the Faculty of Odonto-Stomatology, Can Tho University of Medicine and Pharmacy Hospital. To assess bone thickness (BT) and gingival thickness (GT), reference lines were drawn: one central to the long axis of the tooth and a second line perpendicular to the tooth apex. Measurements, including labial bone thickness (LBT), palatal bone thickness (PBT), labial gingival thickness (LGT), and palatal gingival thickness (PGT), were taken at three distinct locations parallel to the second reference line at 2 mm, 4 mm, and 6 mm above the cementoenamel junction (CEJ). The study employed a cross-sectional descriptive design. Statistical analyses were conducted using One-way Analysis of Variance (ANOVA) and Pearson’s correlation coefficient to evaluate the relationship between variables.
Results
Most of the correlations between GT and BT in the anterior maxillary teeth are not statistically significant. Statistically significant correlations were observed for the lateral incisor, which mostly shows a negative correlation, specifically between LGT2 and LBT2; between PGT2 and LBT2, PBT2, LBT4, LBT6; and between PGT6 and PBT2. The only positive correlation with statistical significance was between LGT2 and LBT6 (p = 0.268). For the canine, all of the statistically significant correlations were found to be negative (p < 0.05). Notably, the correlation between PGT2 and LBT2 for the lateral incisor, as well as the correlation between PGT2 and PBT2 for the canine, were statistically significant at the 0.01 level.
Conclusion
Within the scope of this study, we can conclude that the GT and BT on the palatal side were greater than on the labial side, and no clear differences were observed between males and females. On the other hand, most of the correlations between GT and BT in the anterior maxillary teeth were not statistically significant.
1. INTRODUCTION
Understanding periodontal biotype is essential for clinicians, as gingival thickness, width, and alveolar bone morphology influence the periodontium's response to stress and treatments [1]. Gingival biotype (GB) impacts both short- and long-term aesthetic outcomes, particularly in the anterior maxilla, affecting crown length, texture, and color [2]. A direct correlation has been observed between GB and the susceptibility to gingival recession following surgical and restorative procedures. Thus, accurately assessing the thickness of periodontal tissues is of paramount importance. [1]
The width of the labial bone is crucial in determining its resorption pattern, which impacts immediate implant placement outcomes, particularly in aesthetic zones. The width of the buccal bone also serves as a predictive factor for hard tissue changes following immediate implant placement. The anatomical shape of the labial bone above maxillary and mandibular teeth leads to varying bone thicknesses at different distances from the bone crest (BC), with bone thinness being a key predictor of recession [3]. A correlation between gingival thickness (GT) and bone thickness (BT) has been noted, especially for maxillary incisors, though no such relationship exists for mandibular incisors [4].
Patients with a thin GB are at greater risk of experiencing gingival recession and alveolar bone retraction after implantation, which increases the likelihood of aesthetic concerns. However, there is limited information on the relationship between bone thickness (LBT) and labial gingival thickness (LGT), mainly due to the lack of standardized measurement techniques for both hard and soft tissues. This knowledge gap can lead to inadequate surgical planning, complications, and less predictable postsurgical outcomes [5, 6].
Accurate assessment of the dentogingival complex is essential for diagnosis and presurgical planning [5]. Patients with a thin gingival biotype (GB) are more prone to gingival recession and alveolar bone retraction after implantation, increasing aesthetic concerns. However, there is limited understanding of the relationship between labial bone thickness (LBT) and labial gingival thickness (LGT) due to the lack of standardized measurement techniques. This knowledge gap can result in inadequate surgical planning, complications, and less predictable outcomes.
The cementoenamel junction (CEJ) marks the boundary between the anatomical crown, covered by enamel, and the anatomical root, covered by cementum. The CEJ is a critical reference in clinical dentistry for diagnosing periodontal conditions and guiding treatments like scaling, root planing, and surgeries [7]. Many studies measure root length from the CEJ to the root apex, while crown length is measured from the incisal edge to the CEJ [8-11].
Measuring periodontal soft tissue dimensions is crucial for clinical decision-making and aesthetic outcomes, but the reliability of various measurement techniques is still uncertain [7]. Measurement techniques for GT include both invasive approaches, such as direct puncture (which requires local anesthesia), and non-invasive methods, such as ultrasonic measurement. Although traditional radiographs (two-dimensional) are commonly used, they do not provide sufficient information to evaluate gingival and alveolar bone thickness. Anatomical measurements are often grouped to provide average values, which may not always reflect the unique characteristics of individual patients. For accurate clinical decision-making, each tooth site must be assessed individually to improve the precision and predictability of surgical procedures [2].
Elgaddari and Albandar conducted a study to assess the thickness of the palatal bone at the maxillary canines and incisors at three different locations. The results indicated that maxillary canines had significantly greater PBT compared to maxillary incisors. The study by Rodrigues et al., about the relationship between GT and other periodontal phenotypical features, found that GT progressively increased towards the apical direction. Maxillary central incisors and male individuals typically exhibited thicker GT, while females tended to have thinner GT. The study also revealed that narrower tooth crowns and roots in the bucco-lingual dimension were associated with thicker gingiva. Teeth with a thin GB had larger CEJ-BC distances and greater buccolingual tooth width dimensions [12].
Notably, cone beam computed tomography (CBCT) is gaining attention as a noninvasive diagnostic tool for assessing the morphological features of both soft and hard tissues [12]. The introduction of CBCT allows for three-dimensional (3D) evaluation through high-resolution image reconstruction. The images are acquired with a single rotation, offering benefits such as lower cost, reduced radiation dose, and easier operation compared to conventional multislice CT [13]. Its high-quality 3D imaging capabilities, along with its ability to provide both linear and volumetric data, have made it an essential tool for diagnosis and planning. CBCT is considered a relatively reliable method for measuring GT and BT in both anterior and posterior regions when compared with direct probing. The ability to precisely measure the dentogingival unit for individual teeth and sites using 3D imaging can significantly enhance treatment outcomes [5].
The purpose of this study was to determine the measurements of the dentogingival dimensions in the maxillary anterior region using CBCT imaging and compare the BT and the GT at specific landmarks relative to the CEJ.
2. MATERIALS AND METHODS
2.1. Subjects and Eligibility Criteria
The study involved a total of 360 anterior maxillary teeth, which were selected from the data of 60 patients at the Faculty of Odonto-Stomatology, Can Tho University of Medicine and Pharmacy Hospital.
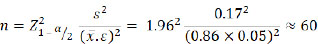
These patients were selected based on the sample size calculation formula for estimating a mean, with the average GT at 4 mm below the CEJ being 0.86 mm and a standard deviation of 0.17 mm, as reported by Wang et al. [2] Specifically, the formula (1) used is as follows:
 |
(1) |
(n = sample size; α = significance level; s = standard deviation; ε = relative error between the sample parameter and the population parameter;
 ̅: mean; ε: relative error between the sample parameter and the population parameter).
All participants voluntarily agreed to take part in the study after being informed about the purpose and procedures involved. The selection process adhered to the ethical guidelines and received approval from The Ethics Committee in Biomedical Research at Can Tho University of Medicine and Pharmacy, as outlined in Decision No. 23.005/PCT-HĐĐĐ. This cross-sectional descriptive study was conducted in accordance with established research protocols.
The study conducted a retrospective analysis of CBCT images from patients who had been examined and treated at Can Tho University of Medicine and Pharmacy Hospital. Patients were referred for CBCT imaging for general dental conditions. Then, the patients were examined and evaluated based on the inclusion criteria: the presence of fully erupted, not suffering from osteosarcoma, non-orthodontics treatment, and non-crowded maxillary anterior teeth in otherwise healthy patients without any dental defects. The exclusion criteria included root fractures, crown restorations, alveolar bone resorption, and severe artifacts on the CBCT images.
2.2. CBCT Scans
The images were obtained using a Sirona Orthophos SL 3D device (Sirona, Germany), with a voxel base size of 0.08 mm, power lines and voltages of 3.0–16.0 mA and 60–90 kV, respectively, a scanning time of 14.9 seconds, and the capacity for cylindrical (field of view) measurements of 40-40 mm, 60-60 mm or 80-80 mm. During CBCT scanning, a plastic lip retractor was used to retract the lips and cheeks, allowing for better visualization of the periodontal soft tissues (Fig. 1). Datasets resulting from the scans were saved in Digital Imaging and Communications in Medicine (DICOM) format. Images were analyzed using specific software (GALILEOS software version 1.8, Sirona, Germany) and reconstructed by using cross-sectional slices in the radial plane, perpendicular to the alveolar ridge at 0.9 mm intervals on Samsung computer screen seri LF27T350FHEXXV, 1920x1080px, and 75Hz. The cross-section of each tooth in the radio plane was viewed in the center of its mid-facial position and evaluated relative to the surrounding soft and hard tissue. Brightness and contrast were adjusted to facilitate visualization of the soft tissue with 1920x1080.
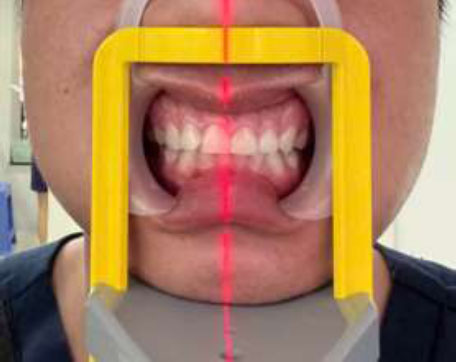
Lips and cheeks were retracted by using a plastic lip retractor during CBCT scanning.
Measurements, including labial bone thickness, palatal bone thickness, labial gingival thickness, and palatal gingival thickness, were taken at three distinct locations parallel to the second reference line at 2 mm (line D1), 4 mm (line D2), and 6 mm (line D3) above the cementoenamel junction (Fig. 2).
2.3. Measurement Error
To avoid errors in drawing and measuring operations on film, all procedures were performed by a researcher. This researcher’s consistency was tested as follows: after the previously estimated total samples were measured, 20 films were randomly selected to be plotted and measured again with the same method by the same person 24 hours later (test-retest method). The data from the second measurement were compared with the first using Pearson’s correlation coefficient.
3. RESULTS
The research involves 60 CBCT images, with 27 images taken from males and 33 from females. All results were expressed as mean ± standard deviation.
On the palatal surface, when considering soft tissue, with a distance of 2 mm from the apex to the CEJ, the lowest corresponding PGT is observed in the maxillary central incisors, while the highest PGT is found in the lateral incisors on both sides. The measurements for each position from the right maxillary canine to the left canine were as follows: 2.07 ± 0.81 mm, 2.48 ± 0.83 mm, 2.39 ± 0.99 mm,
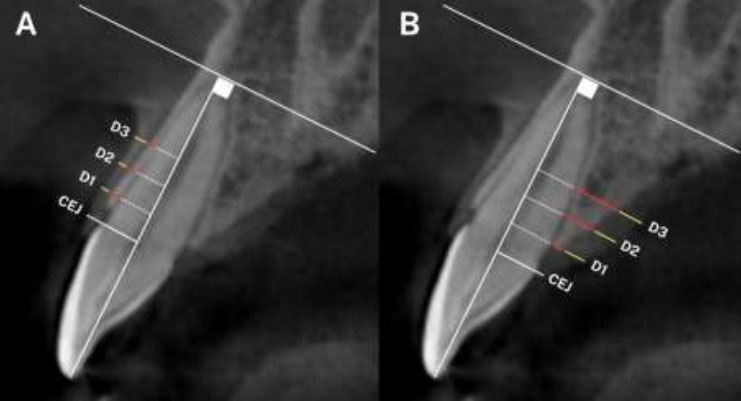
Measurements of labial and palatal sides of the central incisor at 3 positions, D1: 2mm above the CEJ, D2: 4mm above the CEJ, D3: 6mm above the CEJ; Red-line: bone thickness, yellow-line: gingival thickness. A: Labial measurements; B: Palatal measurements.
2.08 ± 0.82 mm, 2.46 ± 0.91 mm, 2.40 ± 0.95 mm. When considering gender differences, it follows the same order as mentioned above. At each corresponding position, the PGT in males was larger than those in females, except for the right maxillary central incisors, with 1.95 ± 0.78 mm for males and 2.16 ± 0.84 mm for females.
When considering the PGT at a distance of 4 mm and 6 mm from the apex to the CEJ, the PGT in both males and females showed the highest values at the maxillary canines and gradually thins to the central incisors. At the 4 mm mark, the results for males and females were as follows: on the right side, 3.02 ± 1.25 mm for males and 2.85 ± 1.12 mm for females (p=0.732), and on the left side, 2.74 ± 0.98 mm for males and 2.93 ± 1.09 mm for females (p=0.757). At 6 mm below the CEJ, the following results were obtained: on the right side, 3.18 ± 1.06 mm for males and 3.28 ± 0.91 mm for females (p=0.732), and on the left side, 3.01 ± 1.05 mm for males and 3.12 ± 1.01 mm for females (p=0.757).
In contrast to the results in PGT, when assessing hard tissue at 2 mm below the CEJ, the PBT values for the maxillary central incisors were the highest for both genders, with 1.22 ± 0.52 mm on the right and 1.23 ± 0.48 mm on the left. The data is also evaluated in the same order, at a distance of 4 mm and 6 mm from the apex to the CEJ. In addition, except for the right lateral incisors at 2 mm below the CEJ, which recorded a result of 0.95 ± 0.44 mm for males and 1.04 ± 0.53 mm for females (p=0.732), all other positions showed that the measurements for males were greater than that for females (Table 1).
When evaluating at the labial side, at 2 mm below the CEJ, the LGT in males is generally smaller than in females for the anterior teeth of the maxilla, except for the right central incisor with 0.91 ± 1.27 for males and 0.89 ± 0.34 for females. Regarding the LBT, the right central incisor (p=0.599), right canine (p=0.299), and left lateral incisor (p=0.204) are thicker in males than in females, while the thickness of the right lateral incisor (p=0.914), left central incisor (p=0.687), and left canine (p=0.328) shows the opposite pattern. However, all differences are not statistically significant. A negative correlation is observed in most regions, except for tooth 12, which shows a positive correlation with a Pearson correlation coefficient of 0.271.
| At 2 mm below the CEJ | |||||||
|---|---|---|---|---|---|---|---|
| Variables | Gender | Tooth | |||||
| 11 | 12 | 13 | 21 | 22 | 23 | ||
| PGT2 (mm) |
Male | 1.95 ± 0.78 | 2.56 ± 0.93 | 2.55 ± 1.12 | 2.10 ± 0.90 | 2.51 ± 0.86 | 2.42 ± 1.09 |
| Female | 2.16 ± 0.84 | 2.42 ± 0.75 | 2.26 ± 0.87 | 2.06 ± 0.76 | 2.42 ± 0.96 | 2.40 ± 0.85 | |
| Total | 2.07 ± 0.81 | 2.48 ± 0.83 | 2.39 ± 0.99 | 2.08 ± 0.82 | 2.46 ± 0.91 | 2.40 ± 0.95 | |
| p-value | 0.881 | 0.517 | 0.270 | 0.923 | 0.767 | 0.779 | |
|
PBT2 (mm) |
Male | 1.25 ± 0.52 | 0.95 ± 0.44 | 1.00 ± 0.39 | 1.27 ± 0.50 | 0.97 ± 0.47 | 1.13 ± 0.56 |
| Female | 1.19 ± 0.53 | 1.04 ± 0.53 | 0.95 ± 0.51 | 1.20 ± 0.48 | 0.96 ± 0.46 | 0.95 ± 0.45 | |
| Total | 1.22 ± 0.52 | 1.00 ± 0.49 | 0.97 ± 0.46 | 1.23 ± 0.48 | 0.96 ± 0.46 | 1.03 ± 0.51 | |
| p-value | 0.374 | 0.732 | 0.689 | 0.574 | 0.697 | 0.181 | |
| Pearson Correlation | 0.150 | 0.274* | 0.031 | 0.286* | 0.046 | 0.165 | |
| At 4 mm below the CEJ | |||||||
|
PGT4 (mm) |
Male | 2.50 ± 0.82 | 2.83 ± 1.05 | 3.02 ± 1.25 | 2.22 ± 0.76 | 2.67 ± 0.88 | 2.74 ± 0.98 |
| Female | 2.39 ± 0.78 | 2.75 ± 0.96 | 2.85 ± 1.12 | 2.37 ± 0.77 | 2.87 ± 0.95 | 2.93 ± 1.09 | |
| Total | 2.44 ± 0.79 | 2.78 ± 1.00 | 2.93 ± 1.17 | 2.30 ± 0.76 | 2.78 ± 0.92 | 2.84 ± 1.04 | |
| p-value | 0.593 | 0.3 | 0.732 | 0.504 | 0.330 | 0.757 | |
|
PBT4 (mm) |
Male | 2.07 ± 0.94 | 1.83 ± 0.88 | 1.92 ± 0.63 | 2.22 ± 0.80 | 1.88 ± 0.93 | 2.06 ± 0.75 |
| Female | 2.00 ± 0.69 | 1.58 ± 0.74 | 1.54 ± 0.52 | 2.07 ± 0.84 | 1.49 ± 0.60 | 1.55 ± 0.55 | |
| Total | 2.03 ± 0.81 | 1.69 ± 0.81 | 1.71 ± 0.60 | 2.14 ± 0.82 | 1.67 ± 0.78 | 1.78 ± 0.69 | |
| p-value | 0.719 | 0.689 | 0.276 | 0.443 | 0.030 | 0.006 | |
| Pearson Correlation | 0.124 | 0.097 | -0.073 | -0.136 | 0.007 | 0.059 | |
| At 6 mm below the CEJ | |||||||
|
PGT6 (mm) |
Male | 2.36 ± 0.67 | 2.84 ± 1.00 | 3.18 ± 1.06 | 2.18 ± 0.64 | 2.65 ± 0.86 | 3.01 ± 1.05 |
| Female | 2.31 ± 0.74 | 2.59 ± 0.74 | 3.28 ± 0.91 | 2.12 ± 0.58 | 2.80 ± 1.13 | 3.12 ± 1.01 | |
| Total | 2.33 ± 0.71 | 2.70 ± 0.87 | 3.23 ± 0.97 | 2.15 ± 0.60 | 2.73 ± 1.01 | 3.07 ± 1.02 | |
| p-value | 0.713 | 0.276 | 0.300 | 0.674 | 0.528 | 0.756 | |
|
PBT6 (mm) |
Male | 3.19 ± 1.57 | 2.82 ± 1.10 | 2.96 ± 0.92 | 3.18 ± 1.15 | 2.79 ± 1.24 | 3.18 ± 1.17 |
| Female | 2.93 ± 0.97 | 2.45 ± 1.22 | 2.32 ± 0.91 | 3.01 ± 1.18 | 2.17 ± 0.93 | 2.35 ± 0.83 | |
| Total | 3.05 ± 1.27 | 2.62 ± 1.17 | 2.61 ± 0.96 | 3.08 ± 1.16 | 2.45 ± 1.12 | 2.73 ± 1.07 | |
| p-value | 0.526 | 0.197 | 0.197 | 0.603 | 0.032 | 0.007 | |
| Pearson Correlation | -0.109 | 0.000 | -0.118 | -0.028 | -0.166 | 0.013 | |
At 4 mm below the CEJ, the LGT in males is thinner than in females in all anterior maxillary teeth. On the other hand, the LBT is thicker in males, except the central incisor on both sides is thinner in males compared to females. The difference in LGT at the left central incisor is statistically significant (p=0.967), while all other differences are not statistically significant. A negative correlation is observed at the canines on both sides, while the remaining regions show a positive correlation.
At 6 mm from the CEJ to the apex, none of the differences are statistically significant, with the LGT being thicker in females than in males. The lowest corresponding LBT is observed in the maxillary lateral incisors, while the highest LBT is found in the canines on both sides. The measurements for each position from the right maxillary canine to the left canine were as follows: 0.62 ± 0.20 mm, 0.52 ± 0.21 mm, 0.67 ± 0.30 mm, 0.70 ± 0.19 mm, 0.60 ± 0.24 mm, 0.76 ± 0.33 mm. When considering gender differences, it follows the same order as mentioned above. The Pearson correlation is similar to that at 4 mm below the CEJ, with most regions showing a positive correlation, except for the canines on both sides (Table 2).
| At 2 mm below the CEJ | |||||||
|---|---|---|---|---|---|---|---|
| Variables | Gender | Tooth | |||||
| 11 | 12 | 13 | 21 | 22 | 23 | ||
|
LGT2 (mm) |
Male | 0.91 ± 1.27 | 0.65 ± 0.32 | 0.68 ± 0.32 | 0.77 ± 0.36 | 0.74 ± 0.32 | 0.76 ± 0.30 |
| Female | 0.89 ± 0.34 | 0.75 ± 0.30 | 0.74 ± 0.28 | 0.85 ± 0.35 | 0.81 ± 0.33 | 0.83 ± 0.34 | |
| Total | 0.9 ± 0.88 | 0.71 ± 0.31 | 0.71 ± 0.3 | 0.81 ± 0.36 | 0.78 ± 0.32 | 0.8 ± 0.32 | |
| p-value | 0.883 | 0.193 | 0.409 | 0.228 | 0.638 | 0.381 | |
|
LBT2 (mm) |
Male | 0.66 ± 0.23 | 0.67 ± 0.28 | 0.71 ± 0.30 | 0.72 ± 0.29 | 0.68 ± 0.22 | 0.65 ± 0.28 |
| Female | 0.61 ± 0.34 | 0.68 ± 0.36 | 0.62 ± 0.35 | 0.73 ± 0.34 | 0.59 ± 0.25 | 0.56 ± 0.31 | |
| Total | 0.64 ± 0.03 | 0.68 ± 0.32 | 0.67 ± 0.33 | 0.72 ± 0.32 | 0.63 ± 0.24 | 0.60 ± 0.30 | |
| p-value | 0.599 | 0.914 | 0.299 | 0.687 | 0.204 | 0.328 | |
| Pearson Correlation | -0.160 | 0.271* | -0.414** | -0.573** | -0.281* | -0.485** | |
| At 4 mm below the CEJ | |||||||
|
LGT4 (mm) |
Male | 0.57 ± 0.22 | 0.56 ± 0.22 | 0.54 ± 0.25 | 0.57 ± 0.22 | 0.59 ± 0.23 | 0.56 ± 0.22 |
| Female | 0.60 ± 0.16 | 0.65 ± 0.22 | 0.58 ± 0.15 | 0.71 ± 0.19 | 0.66 ± 0.24 | 0.64 ± 0.24 | |
| Total | 0.59 ± 0.19 | 0.61 ± 0.23 | 0.56 ± 0.20 | 0.65 ± 0.21 | 0.63 ± 0.23 | 0.60 ± 0.23 | |
| p-value | 0.602 | 0.142 | 0.519 | 0.030 | 0.203 | 0.287 | |
|
LBT4 (mm) |
Male | 0.71 ± 0.27 | 0.71 ± 0.31 | 0.87 ± 0.36 | 0.76 ± 0.25 | 0.78 ± 0.31 | 0.95 ± 0.35 |
| Female | 0.75 ± 0.23 | 0.68 ± 0.28 | 0.75 ± 0.32 | 0.80 ± 0.20 | 0.74 ± 0.29 | 0.84 ± 0.31 | |
| Total | 0.73 ± 0.25 | 0.69 ± 0.29 | 0.81 ± 0.34 | 0.78 ± 0.23 | 0.76 ± 0.29 | 0.89 ± 0.33 | |
| p-value | 0.847 | 0.615 | 0.170 | 0.967 | 0.596 | 0.287 | |
| Pearson Correlation | 0.164 | 0.059 | -0.009 | 0.126 | 0.096 | -0.096 | |
| At 6 mm below the CEJ | |||||||
|
LGT6 (mm) |
Male | 0.56 ± 0.25 | 0.56 ± 0.24 | 0.55 ± 0.19 | 0.61 ± 0.26 | 0.61 ± 0.28 | 0.63 ± 0.29 |
| Female | 0.57 ± 0.18 | 0.69 ± 0.29 | 0.65 ± 0.26 | 0.68 ± 0.20 | 0.69 ± 0.28 | 0.67 ± 0.26 | |
| Total | 0.57 ± 0.21 | 0.63 ± 0.27 | 0.60 ± 0.24 | 0.64 ± 0.23 | 0.66 ± 0.28 | 0.65 ± 0.28 | |
| p-value | 0.877 | 0.091 | 0.116 | 0.563 | 0.274 | 0.496 | |
|
LBT6 (mm) |
Male | 0.61 ± 0.20 | 0.53 ± 0.21 | 0.70 ± 0.29 | 0.70 ± 0.23 | 0.58 ± 0.20 | 0.82 ± 0.32 |
| Female | 0.62 ± 0.20 | 0.51 ± 0.22 | 0.64 ± 0.31 | 0.70 ± 0.17 | 0.62 ± 0.27 | 0.71 ± 0.33 | |
| Total | 0.62 ± 0.20 | 0.52 ± 0.21 | 0.67 ± 0.30 | 0.70 ± 0.19 | 0.60 ± 0.24 | 0.76 ± 0.33 | |
| p-value | 0.954 | 0.436 | 0.431 | 0.625 | 0.769 | 0.118 | |
| Pearson Correlation | 0.167 | 0.021 | -0.123 | 0.264* | 0.118 | -0.025 | |
The results show that the mean crown length (CL), root length (RL), mesiodistal width, labio-lingual width, and BC-CEJ distance of the anterior maxillary teeth are 9.31 ± 1.28 mm, 12.75 ± 2.27 mm, 6.84 ± 0.82 mm, 7.21 ± 2.67 mm, and 1.83 ± 0.62 mm, respectively. All differences are statistically significant, particularly the crown length, root length, and mesiodistal width (p < 0.001) (Table 3).
Most of the correlations between GT and BT in the anterior maxillary teeth are not statistically significant. Statistically significant correlations were observed for the lateral incisor, which mostly showed a negative correlation, specifically between LGT2 and LBT2; between PGT2 and LBT2, PBT2, LBT4, LBT6; and between PGT6 and PBT2. The only positive correlation with statistical significance was between LGT2 and LBT6. For the canine, all of the statistically significant correlations were found to be negative. Notably, the correlation between PGT2 and LBT2 for the lateral incisor, as well as the correlation between PGT2 and PBT2 for the canine, were statistically significant at the 0.01 level (Table 4).
| Variables | Tooth |
Mean (mm) |
Std. Deviation (mm) |
Minimum (mm) |
Maximum (mm) |
p-value |
|---|---|---|---|---|---|---|
|
Crown Length (CL) |
11 | 10.14 | 1.12 | 6.44 | 12.47 | <0.001 |
| 12 | 8.95 | 1.42 | 0.00 | 11.12 | ||
| 13 | 8.91 | 1.12 | 6.59 | 11.37 | ||
| 21 | 10.18 | 1.02 | 7.82 | 12.48 | ||
| 22 | 8.95 | 0.89 | 6.80 | 11.75 | ||
| 23 | 8.75 | 1.19 | 6.27 | 11.96 | ||
| Total | 9.31 | 1.28 | 0.00 | 12.48 | ||
|
Root Length (RL) |
11 | 12.28 | 1.49 | 8.36 | 15.93 | <0.001 |
| 12 | 12.19 | 1.73 | 8.68 | 16.00 | ||
| 13 | 13.87 | 2.59 | 9.46 | 21.50 | ||
| 21 | 12.27 | 1.47 | 8.66 | 15.62 | ||
| 22 | 11.94 | 2.27 | 1.23 | 16.99 | ||
| 23 | 13.95 | 2.82 | 5.50 | 18.73 | ||
| Total | 12.75 | 2.27 | 1.23 | 21.50 | ||
| Mesio-Distal (MD) | 11 | 6.70 | 0.47 | 5.77 | 7.69 | <0.001 |
| 12 | 6.25 | 0.50 | 4.76 | 7.41 | ||
| 13 | 7.63 | 0.73 | 6.04 | 9.41 | ||
| 21 | 6.80 | 0.62 | 4.86 | 8.56 | ||
| 22 | 6.18 | 0.57 | 5.02 | 7.38 | ||
| 23 | 7.50 | 0.73 | 5.63 | 9.59 | ||
| Total | 6.84 | 0.82 | 4.76 | 9.59 | ||
|
Labio-Lingual (LL) |
11 | 7.92 | 0.68 | 5.62 | 9.41 | 0.017 |
| 12 | 7.25 | 6.21 | 3.51 | 53.98 | ||
| 13 | 6.93 | 0.92 | 5.03 | 8.79 | ||
| 21 | 7.73 | 0.73 | 5.55 | 8.75 | ||
| 22 | 6.35 | 0.84 | 3.43 | 8.14 | ||
| 23 | 7.10 | 0.88 | 5.10 | 8.92 | ||
| Total | 7.21 | 2.67 | 3.43 | 53.98 | ||
|
Cementoenamel junction-Bone crest (CEJ-BC) |
11 | 1.87 | 0.85 | 0.83 | 6.76 | 0.016 |
| 12 | 1.73 | 0.52 | 0.69 | 2.75 | ||
| 13 | 1.81 | 0.52 | 0.98 | 2.99 | ||
| 21 | 1.63 | 0.41 | 0.57 | 2.41 | ||
| 22 | 1.95 | 0.59 | 0.70 | 4.19 | ||
| 23 | 1.98 | 0.65 | 0.98 | 4.38 | ||
| Total | 1.83 | 0.62 | 0.57 | 6.76 |
| - | Tooth | LBT2 | PBT2 | LBT4 | PBT4 | LBT6 | PBT6 |
|---|---|---|---|---|---|---|---|
| LGT2 | Central Incisor | 0.150 | -0.232 | 0.105 | -0.012 | 0.077 | 0.180 |
| Lateral Incisor | -0.271* | -0.021 | 0.248 | -0.107 | 0.268* | -0.180 | |
| Canine | 0.031 | -0.126 | 0.005 | 0.084 | 0.177 | 0.099 | |
| PGT2 | Central Incisor | -0.092 | -0.160 | -0.030 | 0.007 | 0.044 | -0.111 |
| Lateral Incisor | -0.355** | -0.271* | -0.318* | 0.063 | -0.261* | 0.053 | |
| Canine | -0.287* | -0.414** | -0.070 | 0.064 | -0.037 | 0.174 | |
| LGT4 | Central Incisor | -0.002 | -0.195 | 0.124 | -0.213 | 0.176 | -0.104 |
| Lateral Incisor | 0.142 | 0.033 | 0.0.097 | -0.048 | 0.158 | -0.104 | |
| Canine | 0.091 | -0.270* | -0.073 | -0.050 | 0.168 | 0.081 | |
| PGT4 | Central Incisor | -0.094 | 0.026 | 0.079 | 0.164 | 0.014 | 0.033 |
| Lateral Incisor | -0.140 | -0.111 | -0.110 | 0.059 | -0.149 | 0.015 | |
| Canine | -0.203 | -0.020 | -0.166 | -0.009 | -0.235 | 0.207 | |
| LGT6 | Central Incisor | 0.083 | -0.127 | -0.004 | -0.005 | -0.109 | 0.077 |
| Lateral Incisor | 0.015 | -0.142 | -0.032 | 0.040 | 0.000 | -0.002 | |
| Canine | 0.108 | -0.275* | -0.087 | -0.169 | -0.118 | 0.086 | |
| PGT6 | Central Incisor | -0.181 | -0.071 | -0.083 | 0.216 | -0.044 | 0.167 |
| Lateral Incisor | -0.199 | -0.309* | -0.215 | -0.139 | -0.073 | 0.021 | |
| Canine | -0.043 | 0.082 | 0.072 | 0.021 | 0.041 | -0.123 |
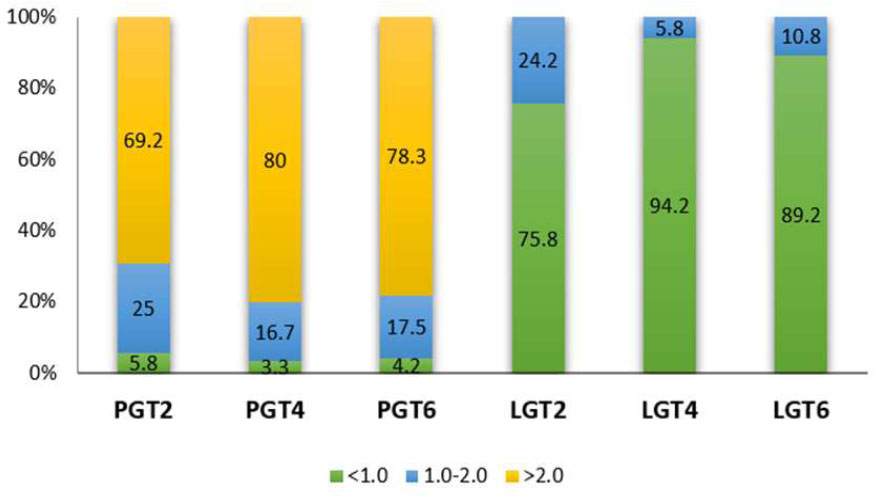
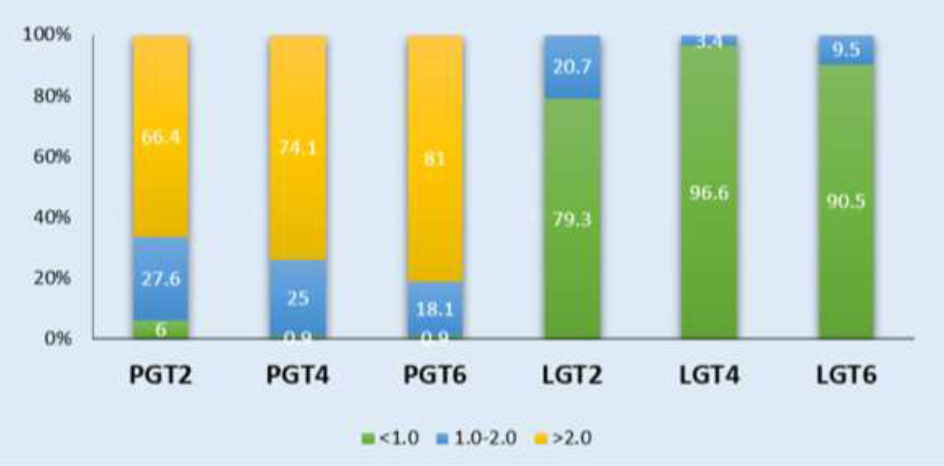
The PGT > 2 mm at the 2 mm, 4 mm, and 6 mm levels below the CEJ accounted for the largest proportion compared to the other thickness groups, with frequencies of 50%, 72.5%, and 65%, respectively. Followed by the thickness range of 1-2 mm, while the least common is < 1 mm. In contrast, for the LGT, the proportion of thickness < 1 mm is almost predominant at LGT2, LGT4, and LGT6. The number of individuals with LGT > 2 mm is found only at PGT2, with a very low percentage of 0.8% (Chart 1). When evaluating the lateral incisors and canines, it follows the same order as mentioned above (Charts 2, 3).
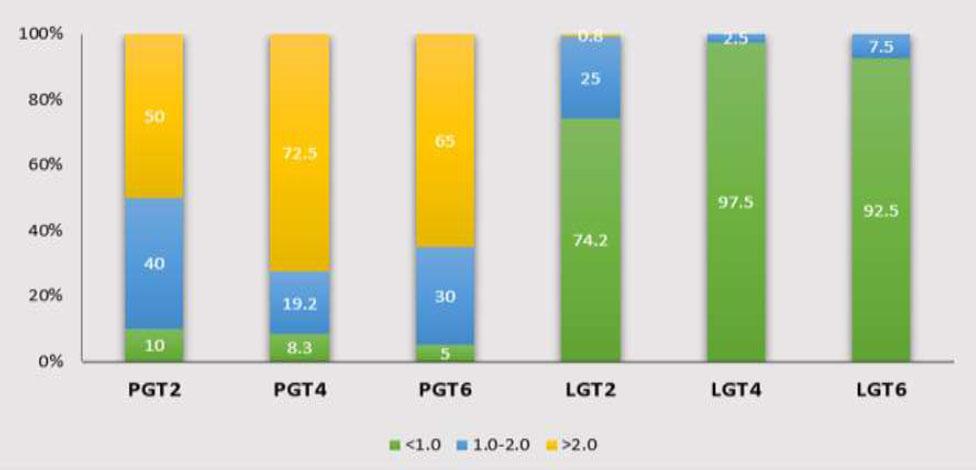
Distribution frequency of Gingival thickness at different sites in the Central incisor region. LGT2: labial gingival thickness at 2mm below the cementoenamel junction; PGT2: palatal gingival thickness at 2mm below the cementoenamel junction; LGT4: labial gingival thickness at 4mm below the cementoenamel junction; PGT4: palatal gingival thickness at 4mm below the cementoenamel junction; LGT6: labial gingival thickness at 6mm below the cementoenamel junction; PGT6: palatal gingival thickness at 6mm below the cementoenamel junction.
Distribution frequency of Gingival thickness at different sites in the Lateral incisor region. LGT2: labial gingival thickness at 2mm below the cementoenamel junction; PGT2: palatal gingival thickness at 2mm below the cementoenamel junction; LGT4: labial gingival thickness at 4mm below the cementoenamel junction; PGT4: palatal gingival thickness at 4mm below the cementoenamel junction; LGT6: labial gingival thickness at 6mm below the cementoenamel junction; PGT6: palatal gingival thickness at 6mm below the cementoenamel junction.
Distribution frequency of Gingival thickness at different sites in the Canine region. LGT2: labial gingival thickness at 2mm below the cementoenamel junction; PGT2: palatal gingival thickness at 2mm below the cementoenamel junction; LGT4: labial gingival thickness at 4mm below the cementoenamel junction; PGT4: palatal gingival thickness at 4mm below the cementoenamel junction; LGT6: labial gingival thickness at 6mm below the cementoenamel junction; PGT6: palatal gingival thickness at 6mm below the cementoenamel junction.
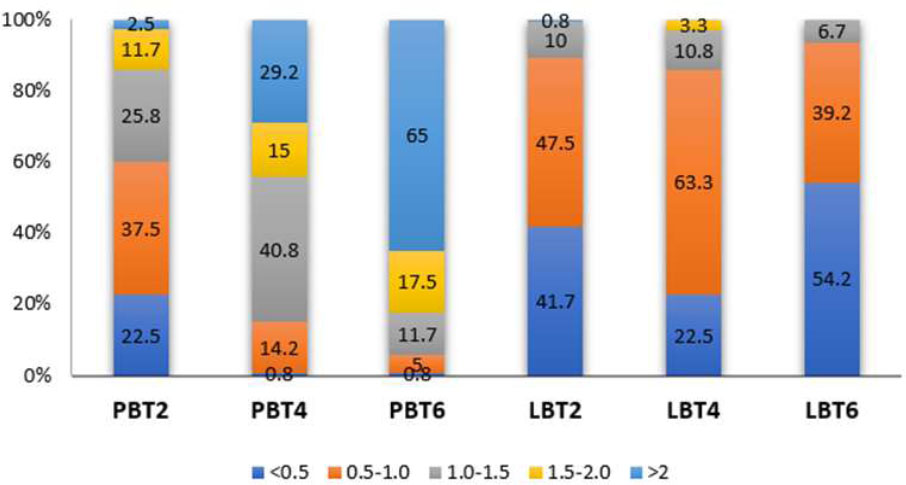
At the position of the maxillary central incisors, the bone thickness at the palatal surface, when measured at 2 mm below the CEJ, showed that the PBT2 distribution was evenly spread across the thickness groups. However, at 4 mm below the CEJ, the ratio of PBT4 > 2 accounted for half of the thickness groups. At 6 mm below the CEJ, the ratio of PBT6 > 2 increased significantly, reaching 84.2%. The proportion of PBT < 0.5 is virtually absent when evaluated at 4 mm and 6 mm below the CEJ. At the labial sides, the bone thickness reached its level of 1.0 - 1.5 mm. The highest ratio was observed in the 0.5 - 1.0 mm group at all measurement points, yielding the following results: 51.7% for 2 mm, 74.2% for 4 mm, and 70% for 6 mm below the CEJ (Chart 4).
Distribution frequency of Bone thickness at different sites in the Central incisor region. LBT2: labial bone thickness at 2mm below the cementoenamel junction; PBT2: palatal bone thickness at 2mm below the cementoenamel junction; LBT4: labial bone thickness at 4mm below the cementoenamel junction; PBT4: palatal bone thickness at 4mm below the cementoenamel junction; LBT6: labial bone thickness at 6mm below the cementoenamel junction; PBT6: palatal bone thickness at 6mm below the cementoenamel junction.
When evaluating PBT in the lateral incisor region, the highest proportions found in PBT2, PBT4, and PBT6 were 0.5-1.0 mm, 1.0-1.5 mm, and > 2 mm, respectively. On the labial sides, the majority of individuals exhibit LBT2 and LBT4 with thicknesses ranging from 0.5 to 1.0 mm. In addition, LBT6 is predominantly greater than 2 mm in thickness (Chart 5).
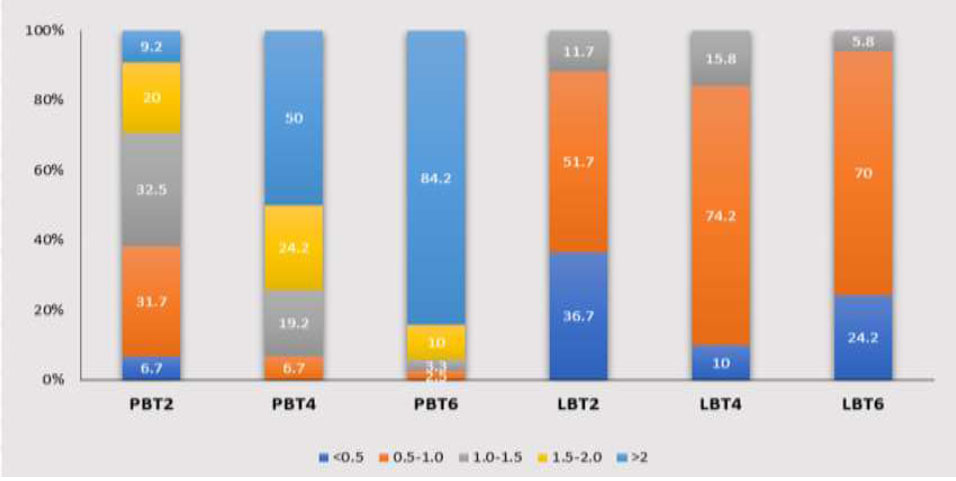
At the maxillary canine, the PBT increases as it progresses from the CEJ towards the apex. The 0.5-1 mm thickness group accounts for the highest proportion at PBT2 with 39.7%. The 1.5-2 mm thickness group constitutes 37.1%, showing the highest frequency at PBT4. At 6 mm below the CEJ, there is a significant increase in PBT, with 70.7% of the group exhibiting a thickness > 2 mm. On the labial sides, the 0.5-1 mm thickness group predominates at both the 4 mm and 6 mm distances, except for the < 0.5 mm thickness group at LBT2, which accounts for 47.8% (Chart 6).
Distribution frequency of Bone thickness at different sites in the Lateral incisor region. LBT2: labial bone thickness at 2mm below the cementoenamel junction; PBT2: palatal bone thickness at 2mm below the cementoenamel junction; LBT4: labial bone thickness at 4mm below the cementoenamel junction; PBT4: palatal bone thickness at 4mm below the cementoenamel junction; LBT6: labial bone thickness at 6mm below the cementoenamel junction; PBT6: palatal bone thickness at 6mm below the cementoenamel junction.
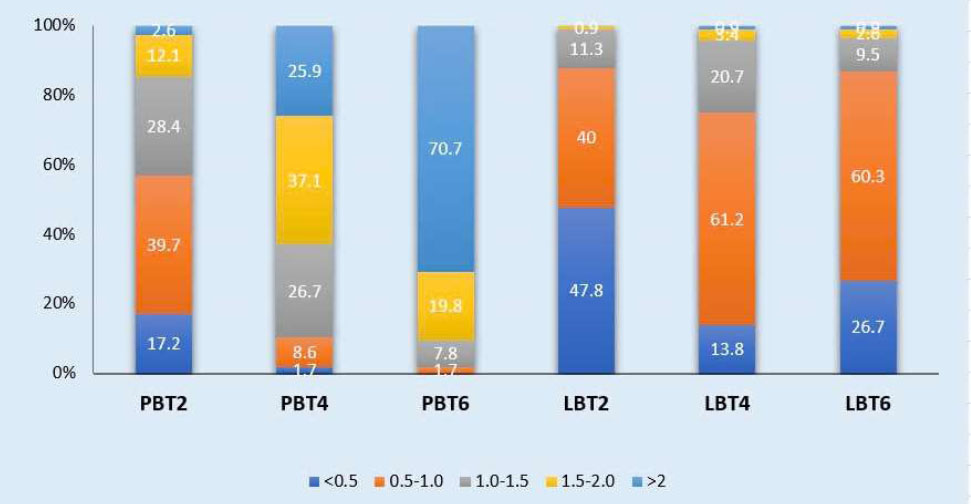
Distribution frequency of Bone thickness at different sites in the Canine region. LBT2: labial bone thickness at 2mm below the cementoenamel junction; PBT2: palatal bone thickness at 2mm below the cementoenamel junction; LBT4: labial bone thickness at 4mm below the cementoenamel junction; PBT4: palatal bone thickness at 4mm below the cementoenamel junction; LBT6: labial bone thickness at 6mm below the cementoenamel junction; PBT6: palatal bone thickness at 6mm below the cementoenamel junction.
4. DISCUSSION
In this study, we employed a method to calculate the parameters using CBCT imaging to visualize, measure, and analyze the relationship between various periodontal and alveolar bone structures. When planning for immediate implant placement, clinicians must assess CBCT images for alveolar socket bone thickness, bone height, the bodily position of the tooth and root, inclination, and the expected buccal gap. The root position and remaining alveolar socket bone will influence the planned location for the initial osteotomy and the 3D positioning of the implant. Additionally, the evaluation of these parameters is also crucial when planning for periodontal treatment, orthodontics, prosthodontics, and dental surgery [14-16].
An appropriate tool is necessary for accurate and convenient assessment. Both hard and soft tissues can be visualized and measured using CBCT. Several authors have observed that CBCT provides highly reliable and accurate measurements of both soft and hard tissues. They note that CBCT imaging can serve as a more objective method for determining the thickness of both hard and soft tissues compared to direct measurements [17-19]. CBCT offers more precise imaging of the teeth, gingiva, and other periodontal structures compared to ultrasound devices and probing techniques. Moreover, the size of a specific tooth can be measured multiple times using the same image obtained by CBCT, a capability not possible with other techniques [19].
Compared to implants with thick GB, those with thin GB have a significantly greater prevalence of peri-implantitis, peri-implant mucositis, and soreness/discomfort during oral hygiene [20]. In addition, GB evaluation should be seriously considered in orthodontic treatment since thin GB has been regarded as a useful predictor for the development of bony dehiscence and gingival recession during orthodontic treatment of labial movement of mandibular incisors [21]. Our study showed that, at the position of the maxillary central incisors, the PBT2 distribution was evenly spread across the thickness groups. However, the ratio of PBT4 > 2 accounted for half of the thickness groups, and the ratio of PBT6 > 2 increased significantly. The proportion of PBT < 0.5 is virtually absent when evaluated at 4 mm and 6 mm below the CEJ. On the labial sides, the highest ratio was observed in the 0.5 - 1.0 mm group at all measurement points. Overall, the average bone thickness of the palatal surface was greater than that of the buccal surface.
Howard Gluckman et al. [15] concluded that most maxillary anterior teeth have thin facial bone walls, which may compromise the benefits of immediate implant placement if the management of these tissues is not adequately planned. The study by Gotam Das et al. [22] demonstrated that the radiographic measurements on CBCT were 1.34 ± 0.17 mm for the right central incisor and 1.28 ± 0.21 mm for the left central incisor. The g in this study was somewhat higher compared to the findings in our research.
Most of the correlations between GT and BT in the anterior maxillary teeth are not statistically significant. Statistically significant correlations were observed for the lateral incisor, which predominantly exhibited a negative correlation, specifically between LGT2 and LBT2; between PGT2 and LBT2, PBT2, LBT4, and LBT6; and between PGT6 and PBT2. The only positive correlation with statistical significance was found between LGT2 and LBT6. For the canine, all statistically significant correlations were negative. Notably, the correlation between PGT2 and LBT2 for the lateral incisor, as well as the correlation between PGT2 and PBT2 for the canine, were statistically significant at the 0.01 level. However, in the study by Linhong Wang et al. [2], a correlation between GT and BT in the anterior maxillary region was evaluated. A significant negative correlation was found between BT and GT at the 2 mm apex relative to the CEJ in all maxillary incisors, while a weak negative correlation was observed at the 4 mm apex relative to the CEJ for the canine. No significant correlations were found at other positions. This finding is also consistent with the results of Cao [23] and Stein [24].
CONCLUSION
Within the scope of this study, we can conclude that the gingival and bone thickness on the palatal side is greater than on the labial side, it provides valuable insights for implantology, particularly in planning procedures for aesthetic outcomes and minimizing complications. Additionally, the finding is that gender does not play a critical role in influencing these measurements of the maxillary anterior teeth. Understanding these parameters and their adjacent structures is crucial for diagnosis and treatment planning. Besides, sample size limitations are a constraint in our study.
AUTHORS’ CONTRIBUTIONS
The authors confirm their contribution to the paper as follows: L.L.L.: Study conception and design; L.T.T.: Data collection; D.T.T.: Methodology; A.T.T.D., T.T.N.N.: Draft manuscript. All authors reviewed the results and approved the final version of the manuscript.
LIST OF ABBREVIATIONS
| GB | = Gingival Biotype |
| LBT | = Bone Thickness |
| LGT | = Labial Gingival Thickness |
| 3D | = Three-dimensional |
| CBCT | = Cone Beam Computed Tomography |
ETHICS APPROVAL AND CONSENT TO PARTICIPATE
The study recieved ethical approval from The Ethics Committee in Biomedical Research at Can Tho University of Medicine and Pharmacy, Can Tho City, Vietnam, with approval no. 23.005/PCT-HĐĐĐ.
HUMAN AND ANIMAL RIGHTS
All procedures involving human participants were performed in accordance with the ethical standards of the institutional and/or research committees and the 1975 Declaration of Helsinki, as revised in 2013.
AVAILABILITY OF DATA AND MATERIALS
The data sets analyzed during the current study are available from the corresponding author [L.N.L.] upon reasonable request.
ACKNOWLEDGEMENTS
The authors gratefully acknowledge for the facilities and support provided by the Faculty of Odonto-Stomatology, Can Tho University of Medicine and Pharmacy, and Can Tho University of Medicine and Pharmacy Hospital, Vietnam.

