All published articles of this journal are available on ScienceDirect.

In Vitro Study Comparing the Effects of Three Different Beverages on the Color Stainability of two Commercially Available Composite Resins
Authors Info & Affiliations
Abstract
Aim
Composite restoration in an oral environment is exposed to various challenges. Several factors impact the color stability of the composite restoration. This study aimed to evaluate and compare the effect of three different types of beverages (coffee, tea, and Pepsi) on the mean color change (ΔE*) of the A2 shade of a Nexcomp Flow-Nanohybrid Flowable Composite Resin and Palfique LX5-Submicron composite resin after different immersion times.
Material and Methods
Sixty-four samples (10 x 10 x 2 mm3) were fabricated from two composite resins. Each group was further subdivided into four subgroups based on staining media: tea, Saudi coffee, Pepsi, and normal saline (control). The baseline color values were measured according to the CIE L*a*b* system using a spectrophotometer. The samples were then immersed in the staining solutions for 1, 7, and 14 days, and the mean color change values (ΔE*) were calculated. Statistical analyses of color differences were conducted using one-way ANOVA and paired Student’s t-test. A value of p < 0.05 was used to determine the significance of the results.
Results
The mean color change (ΔE*) of the resin materials ranged from 0.22 to 1.60 after 14 days of immersion in staining solutions. The type of composite resin and staining beverages significantly affected the color stability of the specimens (p < 0.05). The highest mean ΔE* values were recorded for the Submicron composite in tea (1.60 ± 0.36) and coffee (0.62 ± 0.69), followed by the Nanohybrid composite in tea (1.35 ± 1.56) and coffee (0.55 ± 0.88) (p < 0.05). Pepsi had the lowest ΔE* values for both composites, measuring 0.31 ± 0.66 for nanohybrid and 0.37 ± 0.36 for submicron.
Conclusion
The ΔE*values for both materials were clinically acceptable, with nanohybrid composites showing greater resistance to staining than submicron composites. Tea caused the highest significant ΔE*, followed by Saudi coffee, whereas Pepsi had the least ΔE*values. Color changes increased with longer immersion times.
1. INTRODUCTION
Recent advancements in minimally invasive dentistry have introduced resin-based composite materials as the favored option for esthetic restorations. The wide variety of available color shades has significantly improved the ability to match these composites with the natural color of teeth [1]. Additionally, the development of nanofilled and hybrid composite resins has further improved the translucency and texture of fillings with a more natural appearance [2]. The effectiveness of these resin-composite restorations largely relies on their surface characteristics and color stability [2]. However, discoloration poses a considerable challenge, especially when restorations are subjected to the oral environment over time [3].
Restorative materials' color stability can be negatively affected by consumed beverages. Nanohybrid composite resin are resistant to external coloration compared with Submicron composite resin [4]. The composite restoration in an oral environment is exposed to a variety of challenges [5]. Stability of composite restoration Color is the most important criterion for their selection. However, several factors affect the color stability of composite restoration, and the three most common ones are extrinsic factors, deep adsorption of staining substances, and intrinsic discolorations [6-8].
Color variability attitudes out as one of the principal factors leading to the failure of fillings. Both intrinsic and extrinsic reasons can encourage the staining of tooth-colored resin-based restorations [9]. Intrinsic factors include alterations in the resin matrix and the filler–resin interface, often owing to chemical degradation. Extrinsic factors involve staining from external sources and can be exacerbated by poor oral hygiene and dietary habits [10]. The hydrophilic nature of resin allows the absorption of water and other liquids, leading to further color changes [11]. Critical factors affecting color stability include the size and distribution of filler particles, resin matrix composition, and the photoinitiator system. Additionally, pH levels and water uptake influence degradation rates, with low pH particularly harmful to hydrophilic resins [11].
Recent advancements in filler characteristics, particularly the introduction of nanosized and submicron sized particles, aim to achieve high initial polish and superior gloss retention in composite materials [12]. Smaller filler particles are thought to defend the softer resin phase against wear and decrease surface variations caused by particle loss, which significantly influences surface characteristics, such as smoothness and luster [13]. However, the impacts of nanofillers on the color stability of resin composites are debatable. Although reduced filler size is believed to enhance resistance to discoloration [13], research indicates that filler size does not significantly affect color stability [14]. Other studies demonstrate that the type of dental composite resin, such as nanohybrid, micro hybrid, and hybrid, significantly influences color stability, with hybrid resin composites demonstrating better color stability [15, 16].
Various studies on composite resins with different filler contents and staining solutions have reported varying degrees of discoloration [3, 17]. Some indicate that unprotected variations lack stability improvements despite protective gels [18]. One study finds that a specific natural dye causes the most discoloration, whereas others have minimal effects. Another investigation reveals that certain materials had better color stability against common stains, whereas others exhibited significant color changes [19]. Furthermore, some composites are more stable after immersion, with specific beverages causing the most discoloration [4]. Nanohybrid variations demonstrate better color stability than others, especially with prolonged exposure to staining substances [20].
Devices such as spectrophotometers and colorimeters provide objective measurements of color parameters free from subjective bias [21]. These tools facilitate the study of composite color stability through mean color change (ΔE), which quantifies differences between L*a*b* coordinates across specimens. The Commission Internationale de l’Éclairage (CIE) L*a*b* color system defines the color perception of the human eye in three coordinates: lightness (L*), red-green (a*), and yellow-blue (b*). A ΔE*value between 0 and 2 suggests negligible differences, although trained observers may perceive differences even as low as 0.4 [22]. A ΔE*value 3.7 or lower is deemed clinically acceptable, whereas values above 5 indicate that restoration replacement is necessary [23-25]. Spectrophotometer devices are preferred to measure the color parameters owing to their accuracy in measuring color by evaluating the wavelengths reflected or transmitted, unlike colorimeters, which provide overall measurements influenced by subjective factors [26].
To accomplish a longer aesthetic presence of the dental restoration, a resin filling material less susceptible to staining must be identified. This study aimed to evaluate and compare the effect of three different types of beverages (tea, Saudi coffee, and Pepsi) on the color stainability of two different categories of composite restorations, namely, Nexcomp Flow -Nanohybrid Flowable Composite Resin and Palfique LX5-Submicron composite restoration. The null hypothesis is that no significant differences exist among three different types of beverages on the mean color change (ΔE*) values of the two materials at different time points.
2. MATERIALS AND METHODS
2.1. Study Design and Sample Size Calculation
The present study aimed to evaluate and compare the effect of tea, Saudi coffee, and Pepsi on the mean color changes of two different types of composite materials (Nexcomp Flow -Nanohybrid Flowable and Palfique LX5-Submicron) at different time intervals. The required specimen size was calculated using the equation of G*. Power software version 3.1.9.2 was used with a 5% significance level (α-error), 95% study power (β-error), and a two-tailed test. The calculated sample size was 64 specimens divided into two groups [15, 16, 21].
2.2. Sample Preparations, Grouping, and Polishing
A total of 64 samples with 10×10×2 ±0.2 mm in dimension were fabricated from the tested materials using a silicone mold for both composites. The total samples were divided into two groups, in which 32 were prepared from visible light-cured, Nanohybrid Flowable Composite Resin (A2 shade, Nexcomp Flow, Meta Blomea, Korea), and the other 32 were constructed from the Submicron composite restoration (A2 shade, Tokuyama Palfique LX5, Japan). Each group was additionally separated into four groups according to the staining materials, which were tea, Saudi coffee, Pepsi, and normal saline as a control group. Fig. (1) represents the study steps in relation to the samples, composite material use, immersion materials, and color-parameter measurements. Meanwhile, Fig. (2) shows the composite and beverage materials.
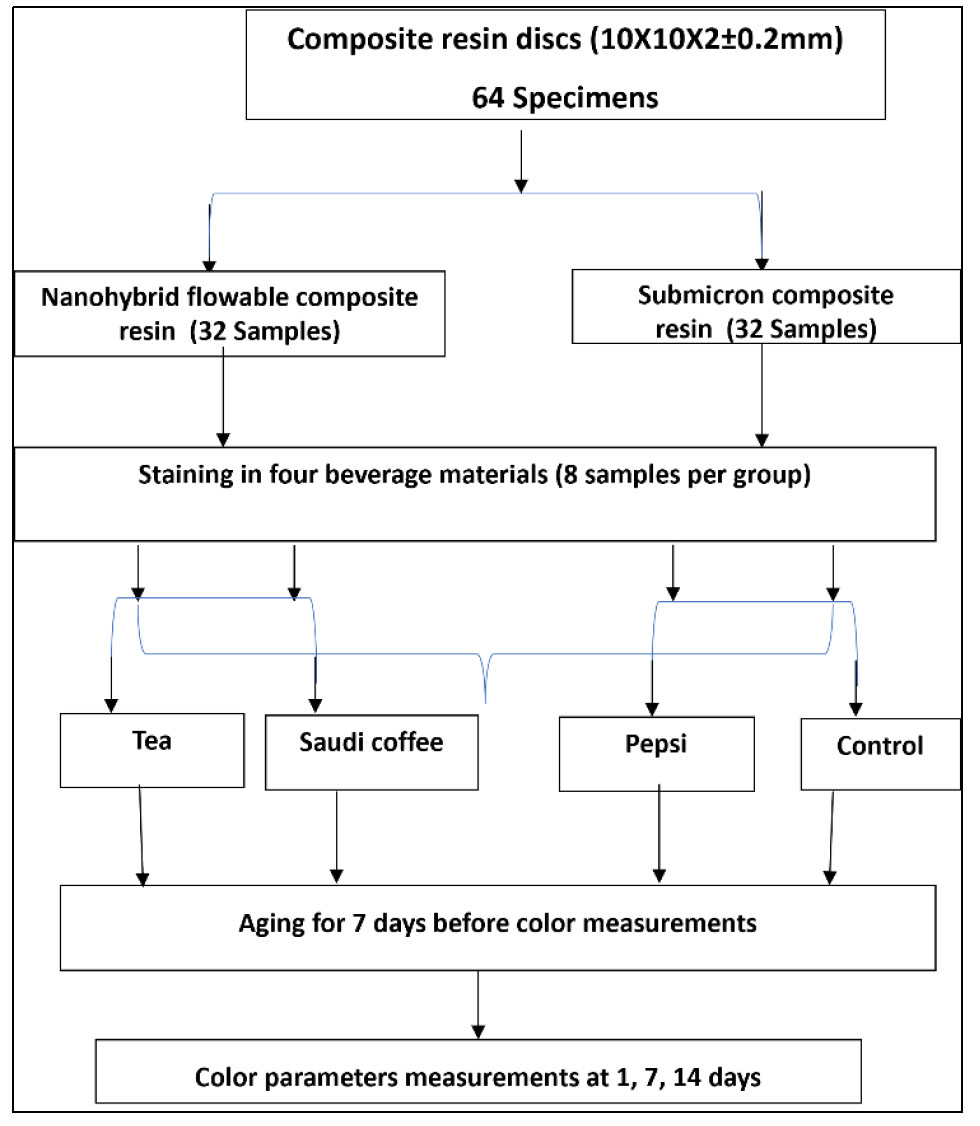
Flowchart of the study design.

Composite and beverage materials.
The prepared specimens were detached from the silicon mold. They were polished through an OptraFine polishing set (Ivoclar, Vivadent, Germany) per the manufacturer’s directions under persistent load (2±0.25 kg) by using an equal number of grinders in a single direction and similar time [27].
2.3. Composite Resin Color Parameters Measurements
One trained operator (S.S.) performed all the measurements under the same standardized testing conditions using the same device. An A2 shade served as the standard shade for all composite resin samples. After polishing and crystallization, the samples were cleaned in an ultrasonic bath of isopropyl alcohol for 5 min before proceeding with the measurements. A spectrophotometer (Spectroshade micro II, MHT, USA) with a calibration plate was used to record the CIELAB coordinates (L, a, and b) of the center of each composite sample at wavelengths between 380 and 780 nm, with the greatest sensitivity at 555 nm. This wavelength was selected based on the CIE definition [28]. The spectrophotometer probe tip was held at a 90° angle to the composite disks during the calibration and after each measurement as recommended by the manufacturer [29-32].
The values for the assessed composite-resin disks were measured on the center of each disk three times with the device, and then the averages were recorded. For each group, the composite disks were placed over a white background, and the measurements were carried. Then the first readings of color parameters (baseline values) were recorded and documented as L1, a1, and b1. Meanwhile, L2, a2, and b2 were for the color parameters after 1, 7, and 14 days of immersion and staining with the different staining materials. As shown in Fig. (3), the screen of the spectrophotometer during the measurement of color parameters (L, a, b) for nonhybrid and for nanohybrid.
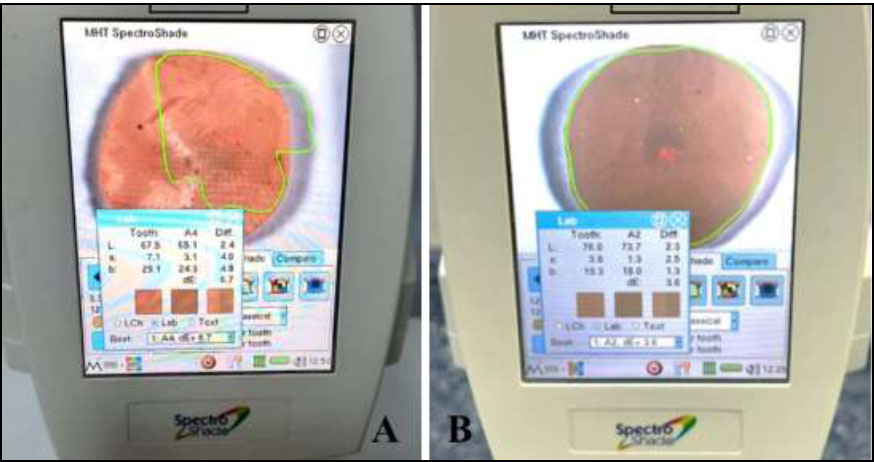
The values of color parameters (L,a,b) for Submicron (A), Nanohybrid composite (B).
The recorded values were used to calculate the color parameters as follows:
The ΔE* is defined as the difference between two colors in a L*a*b* color space. Its value is evaluated by calculating the difference in color measurements of the samples before and after 1, 7, and 14 days of staining and immersion by using the following formula:
ΔE* = [(L2*-L1*)2 + (a2*-a1*)2 + (b2*-b1*)2]1/2
where ΔL* is the differences between L1 before and L2 after the immersion, Δa* is the differences in a1 before and a2 after the staining, and Δb* is the differences in b1 before and b2 after the staining.
2.4. Immersion of Composite Discs in the Different Staining Materials
Following the baseline color assessments, 16 composite disks were immersed in tea staining solutions, which were prepared by adding 15 g to 250 mL of boiled distilled water. Then, boiled water was added after 10 min to each tea bag, and the materials were changed every 12 h daily [11, 15, 16, 21]. The other 16 composite disks were stained in Saudi Coffee (Baja Food Industrial Co., Jeddah, Saudi Arabia) during the aging period. Instant hot Saudi Arabian coffee derived in a nitrogen-flushed container for a single practice. The discoloration solution organized from a separate packet (30 g) was assorted with 0.5 L of boiled water at 100 °C, which was kept boiling for less than 15 s. The coffee immersion solutions were altered every 12 h [29, 31-33]. For the Pepsi group, a cup of Pepsi solution (2 g) was used for the immersion of composite disks in the prepared solutions completely in a vertical position. Pepsi was ready to be used and changed every 12 h [29, 30]. The same procedures were repeated with the normal saline [34]. The same procedures for composite-material disks immersed in the staining beverages were repeated after 1, 7, and 14 days by using the same device and measurement setting.
All staining solutions were shaken well and used. All composite disks were stored in an incubator at 37 °C. A 12 h refreshment of solutions was made. Adherence to preparation protocols was strict. Each group was stained in a separate container and stored inside an incubator during staining. Following aging, all composite disks were dipped 10 times in distilled water following removal from the liquid’s beverage media. Composite disks were wiped dry with tissue paper and left in place for complete dryness. Table 1 and Fig. (1) show the details of the material, beverages, and spectrophotometer used.
2.5. Statistical Analysis
Mean and standard deviation (SD) of the color parameter (L, a, b), and mean color change ΔE* of composite resin disks were documented before and after immersion in the three commonly consumed beverages and during aging. SPSS version 24.0 (SPSS Inc., Chicago IL, USA) was used to input and analyze the data. One-way ANOVA and paired student’s t-test were used to compare the values of ΔE* between different groups, as well as amongst staining materials. Color variations of each group to 50%:50% perceptibility and acceptability edges were also compared to assess if such color changes were clinically acceptable. p > 0.05 was set as the significant level. Then, recorded ΔE* were connected and associated with the suggested clinically tolerable threshold of 1.8 to 4.2 units, as mentioned in a previous study [23].
3. RESULTS
Table 2 shows the mean values of color parameters before and after 14 days of staining in different beverages. Values of the color parameters L, a, and b slightly increased after immersion. These values were higher for tea staining solution in all the color parameters values of L, a, b. Also, values were higher in submicron composite resin than nanohybrid composite resin.
| Material/Device Type |
Type (Brand Name) |
Composition | Manufacturers/ Lot # | Color/Application Per Day |
|---|---|---|---|---|
| Nanohybrid flowable composite resin | (Nexcomp flow) | Bis- GMA, Bis-EMA, urethane dimethacrylate, triethylene glycol dimethacrylate | META BIOMED Co., Ltd. Colour range. | A2 |
| Submicron composite resin | Palfique LX5 | Bis-GMA and Triethylene glycol dimethacrylate | Tokuyama Palfique LX5, Japan) |
A2 |
| Pepsi | Affected by subjective interferences | Sugar, caramel, caffeine, orthophosphoric acid, water |
PepsiCo, Inc USA | Black/2 |
| Saudi Coffee Mix | Baja | Instant Saudi Coffee, Cardamom, Cloves, Nondaily Coffee Creamer, and Saffron, used as Hot Coffee | (Baja Food Industrial Co., Jeddah, Saudi Arabia)/ 6281105795433 Product-Date16/Jan/2023, Exp 16/10/2025 |
Yellowish/2 |
| Tea | AlRabei | Saffron, used as | Al Rabie Saudi Foods Co. | Saffron, used as |
| Spectrophotometer | Spectroshade | Machine used to assess wavelength diffused from one object at a time, without being affected by subjective interferences of color | Spectroshade micro II, MHT, USA) | - |
| Composite Type | Staining Media | L Before | L After | a Before | a After | b Before | b After |
|---|---|---|---|---|---|---|---|
| Nanohybrid Composite Resin | Tea | 67.5 | 68.0 | 7.1 | 7.3 | 29.1 | 31.1 |
| Saudi coffee | 64.7 | 66.5 | 4.2 | 4.4 | 20.0 | 22.2 | |
| Pepsi | 60.3 | 61.2 | 2.9 | 3.1 | 18.9 | 19.9 | |
| Control | 52.8 | 52.6 | 1.4 | 1.6 | 16.1 | 16.4 | |
| Submicron Composite Resin | Tea | 76.0 | 77.4 | 3.0 | 3.2 | 19.3 | 20.1 |
| Saudi coffee | 72.3 | 74.9 | 2.8 | 3.1 | 18.6 | 19.2 | |
| Pepsi | 64.3 | 65.1 | 2.7 | 2.9 | 16.2 | 16.8 | |
| Control | 53.1 | 53.3 | 1.4 | 1.5 | 11.2 | 11.4 |
| Composite Resin Type | Staining Media | After 1 Day | After 7 Days | After 14 Days | p-values |
|---|---|---|---|---|---|
| Nanohybrid Composite Resin | Tea | 0.92±0.017 | 1.53±0.025 | 1.60±0.011 | 0.043* |
| Saudi coffee | 0.46±0.048 | 0.60±0.042 | 0.62±0.043 | ||
| Pepsi | 0.22±0.004 | 0.34±0.160 | 0.36±0.046 | ||
| Control | 0.17±0.008 | 0.19±0.700 | 0.23±0.012 | ||
| Submicron Composite Resin | Tea | 0.98±0.085 | 1.58±0.012 | 1.74±0.057 | 0.026* |
| Saudi coffee | 0.54±0.023 | 0.69±0.046 | 0.80±0.014 | ||
| Pepsi | 0.34±0.025 | 0.39±0.040 | 0.40±0.016 | ||
| Control | 0.18±0.060 | 0.21±0.007 | 0.23±0.001 |
| Composite Resin Type | Tea | Saudi Coffee | Pepsi | p-value |
|---|---|---|---|---|
| Nanohybrid Composite Resin (Nexcomp flow) | 1.35±1.56 | 0.55±0.88 | 0.31±0.66 | 0.050* |
| Submicron (Palfique LX5) | 1.43±0.71 | 0.66±1.23 | 0.37±0.36 | - |
In relation to the nanohybrid composite, the highest mean of ΔE* for one day was among tea groups, followed by coffee and Pepsi with 0.92, 0.46, and 0.22, respectively, whereas ΔE* for the submicron composite was slightly higher at 0.98, 0.54, and 0.34, respectively. For 7 and 14 days, the values of ΔE* increased with increased staining period and were recorded as 1.53, 0.60, and 0.34 for 7 days and 1.60, 0.62, and 0.36 for 14 days, respectively. The ΔE* values of the Submicron composite were 0.98, 0.54, 0.34, 1.58, 0.69, 0.39, and 174, 0.80, 0.40 for tea, coffee, and Pepsi groups at 1, 7, and 14 days, respectively. A significant difference existed between the type of composite resin and the time of immersion days, with p-values 0.043 and 0.026 for Nanohybrid and Submicron composite resin as discussed in Table 3.
Tea recorded the highest ΔE* and SD values in both tested materials, with 1.35±1.56 and 1.43±0.71 for Nanohybrid and Submicron composite resin, followed by Saudi coffee with 0.55±0.88 and 0.66±1.23, respectively. Conversely, Pepsi exhibited the least ΔE* value of 0.31±0.66 for the nanohybrid group and 0.37±0.36 for the submicron composite resin. One-way ANOVA test showed that a significant difference existed between groups and within groups, with p <0.05 (Table 4).
4. DISCUSSION
Color stability is essential in restorative dentistry for the long-term success of esthetic restorations. Changes in the color of dental materials can affect their appearance, leading to patient dissatisfaction and potential retreatment [3]. Composite resins are reportedly susceptible to staining from daily consumption of beverages or habits [9, 15, 16]. Thus, evaluating their color stability in clinical settings is essential for ensuring patient satisfaction and restoration durability. This study aimed to evaluate and compare the color-stain ability of two types of composite restorations after immersion in three commonly consumed beverages, namely, tea, Saudi coffee, and Pepsi.
The ΔE value quantified perceptible color changes in materials after immersion or over time. Values exceeding 3.3 or 3.7 were considered unacceptable in research, indicating color differences that were clinically distinguishable in the oral environment [11, 21, 22]. Other studies suggest that a ΔE of 2.6 is noticeable to 50% of dentists examining a patient [35]. According to a study using the TSK Fuzzy Approximation method, the perceptibility threshold at a 50%:50% level is ΔE = 1.74, whereas the threshold for acceptability is ΔE = 3.48 [24, 25]. The color differences based on human perception, where 0.0–0.50 represents a tiny difference, 0.50–1.00 a slight difference, 1.00–2.00 a noticeable difference, 2.00–4.00 an appreciable difference, and 4.00–6.00 a much larger difference [36].
The in vitro two-week staining period corresponds with about more than 14 months in vivo [29, 33]. The tea group showed higher ΔE* values after over 1, 7, and 14 days than other beverages, leading to rejecting the null hypothesis, marking these changes as noticeable according to NBS standards [36]. This aligned with previous research, such as that of Nasim et al. They reported the highest ΔE* value in nanocomposites exposed to tea at 7 and 30 days, among other tested solutions [37]. Faris et al. found that a tea–milk solution affects the color stability of all restorative materials more than other beverages after one month [15]. However, Qaraghuli et al. noted significant color changes in different restorative materials but no significant differences (p > 0.05) among the various beverages [21].
However, the most notable ΔE changes are in red wine, followed by tea and coffee, although no significant differences are identified between them. Another study has introduced no significant difference in ΔE* values amid the types of composite resins assessed (p > 0.05). Additionally, differences among the solutions for both composite materials are also not significant (p > 0.05) for nanofilled (Premise) and flowable composite resin (Premise Flowable) [38]. This result can be clarified by the variance in the form of composite resins tested, the time of exposure to the several staining solutions, and the type of staining solution used in every study.
The ΔE* values recorded for both specimens were similar to those reported by Fathima et al. [19], although Assaf et al. [3] found that G-aenial experiences the greatest color change after immersion in coffee (ΔE=8.674) and tomato sauce (ΔE=7.737). Additionally, Bhat et al. evaluated the color stability of composite resins when exposed to popular Kashmiri beverages, including Kashmiri tea, Saffron Kahwa, and a turmeric solution [18]. They found that turmeric causes the most considerable discoloration among all composite resins tested, with ΔE values exceeding 8.25, indicating severe color change. Some samples of Kashmiri tea and Saffron kehwa exhibit clinically unacceptable discoloration (ΔE > 3.3). Uğurlu et al. assessed how surface sealants with varying filler contents affect the color stability of two composite resins, finding significant color changes after immersion in red wine, with ΔE values exceeding the clinically acceptable threshold of 3.3 [2]. The discrepancies in results across various studies may be due to factors such as material composition, testing methods, and type of staining agents used.
The yellow colorants in coffee have low polarity, leading to discoloration through adsorption and absorption. These colorants penetrate the organic phase of the composite resin owing to compatibility with its polymer structure [39]. Coffee also contains tannins, polyphenols that dissolve in water and contribute to unwanted yellowish staining on teeth, and just one cup of coffee a day can cause discoloration [16]. This study found that Saudi coffee can affect the color stability of composite resins, evidenced by the greater ΔE* of the Nanohybrid and Submicron composite resins after 7 and 14 days of immersion compared with 24 h of immersion. However, they caused less staining than tea. This finding was in contrast with that of Ertaş et al., who reported that coffee induces a more intense color change than tea when nanohybrid and microhybrid composites are exposed to different beverages [40]. Korać et al. noted that the tested resin composites exhibit color changes exceeding the acceptability threshold (ΔE* > 3.48) after immersion in coffee and tea, with significant discoloration in coffee after 30 days (p < 0.05) [11]. Uctasli et al. found that the mean ΔE* values of specimens immersed in coffee and wine are significantly higher than those of other beverages [39]. Fazlıoğlu et al. further revealed that coffee has the highest ΔE* values among other tested beverages for all resin composites [10].
Young adults and children commonly consume energy drinks like cola. Their acidity, caused by phosphoric and citric acids with a pH of 2.5–3.5, may harm the properties of restorative resins [39]. Previous research links composite discoloration to the low pH of beverages, which can cause roughening and surface erosion [20]. An acidic environment can facilitate the loss of structural ions, enabling pigments to penetrate the softened surface [41]. However, specimens stored in Pepsi groups are associated with the least ΔE*, compared with samples in coffee and tea, consistent with earlier studies [10, 11, 39, 40]. The acidity in Pepsi media can promote surface dissolution and polymer softening. However, the lower degree of discoloration was likely due to the presence of sulfite ammonia caramel and the absence of yellow colorants in this beverage [11]. However, this was inconsistent with other studies where cola has the most significant effect on composites, followed by tea [21, 41]. The differences may be attributed to variations in immersion times, staining-solution concentrations, and environmental factors that can lead to varied discoloration results.
The finding of this study showed that ΔE* values increased with longer staining times and durations for both composite materials. Submicron composite resin exhibited more significant color changes than Nanohybrid. Both composite specimens had color-change differences that were considered clinically acceptable after immersion in different staining solutions and well below the perceptibility threshold of ΔE <1.74 and the acceptability threshold of ΔE <3.7 [25, 26]. This result was supported by other studies suggesting that the color stability of these resins is unpredictable over extended periods and is influenced by the type of composite used and the duration of storage, with many resins exhibiting unacceptable color changes over time [42-44].
Instrumental techniques such as colorimetry and spectrophotometry are extensively adopted in the study of dental materials owing to their reliability and accuracy [26]. A spectrophotometer device with it has different color parameters L, a, and b, can be used to measure most dental materials used in the restorative and prosthetic fields. Thus, this device is commonly recommended for use as a reference device in numerous studies on color-change measurements [45]. Many researchers have recorded the ΔE* and obtained accurate values for testing the stainability of different beverages on various dental materials [24, 30-33].
Nowadays, patients seek better color-matching restorations, and composite resins are the choice of restorative material to satisfy this requirement. People consume tea, coffee, and Pepsi regularly as a part of their daily routine. Previous studies have demonstrated that esthetic restorative materials undergo visually perceptible color changes, and one of the factors affecting restoration quality is the consumption of certain beverages. Therefore, the drinking habits of the patients must be considered when choosing restorative resin-based materials. The results of this study will allow us to choose the restorative material, especially in the esthetic zone of the mouth.
One of the limitations of the current study was the specimens used had flat surfaces. Such surfaces do not accurately represent the anatomical features of real teeth, such as grooves and pits, which can influence the polishing process and discoloration patterns. The concentrations of solutions used as daily beverages also varied extensively based on individual preferences, resulting in general rather than precise estimates. Additionally, comparisons between Saudi coffee and other coffee types were not performed because factors like coffee type, roasting level, and sugar content need further investigation. The evaluation was limited to just one shade of composite, restricting the applicability of our findings. Lastly, we aimed to simulate long-term effects over only a brief 14-day period. Thus, the effect on discoloration may be substantially more than what was observed in this research because of factors such as heat from food and drinks, saliva, and mechanical wear from chewing.
CONCLUSION
Within the limitations of this study, the following conclusions can be drawn.
The recorded ΔE* values were within the clinically acceptable ranges for the two tested materials, with no respect to the staining materials.
The ΔE* values were higher after immersion in tea, followed by Saudi coffee, whereas Pepsi counted the lowest ΔE*.
The Nanohybrid composite resins were resistant to external coloration more than Submicron type.
The ΔE* values increased with increased time of the staining period.
Composite resins behaved in a significantly different way when soaked in various staining solutions.
AUTHORS’ CONTRIBUTIONS
The authors confirm their contribution to the paper: G.A.S., M.G.A., R.A.A., O.F.A., M.M.A.: Study conception and design; M.G.A., R.A.A., O.F.A.: Data collection; N.N.A., N.A.A., S.A.A., F.H.A.: Analysis and interpretation of results; N.A.A. S.A.A., F.H.A., M.M.A. M.M.A., G.A.S. G.A.S., M.M.A. Z.Z.: Draft manuscript. All authors reviewed the results and approved the final version of the manuscript.
LIST OF ABBREVIATIONS
| CIE | = Commission Internationale de l’Éclairage |
| SD | = Standard deviation |
AVAILABILITY OF DATA AND MATERIALS
The data and supportive information are available within the article.
ACKNOWLEDGEMENTS
Declared none.

