All published articles of this journal are available on ScienceDirect.

Correlation of Upper Airway Volume Assessed by Cone-beam Computed Tomography with Salivary Cortisol and Salivary α-Amylase
Authors Info & Affiliations
Abstract
Background
The Indonesian National Armed Forces have the largest military personnel in Southeast Asia. Physical fitness is important for the overall health of these personnel. Cone-beam Computed Tomography (CBCT) enables clinicians to accurately evaluate the upper airway volume.
Objective
This study aimed to investigate the correlation between the upper airway volume and salivary biomarkers, namely cortisol and salivary α-amylase (sAA), to introduce novel findings and aid the National Armed Forces in evaluating military personnel during recruitment and annual checkups.
Methods
This observational study included 30 Indonesian male marines aged 21–29 years. CBCT scans were previously performed using a standardized protocol. Head orientation was analyzed using Frankfort's horizontal, midsagittal, and transporionic planes. Participants were randomly assigned to three exercise intensity groups: Group 1 (intense exercise group) had to run for 12 min and do pull-ups, sit-ups, and push-ups (1 min each); group 2 (moderate exercise group) had to run for 12 min and do pull-ups and sit-ups (1 min each); and group 3 (mild exercise group) had to run for 12 min and do pull-ups (1 min). Saliva samples were collected pre- and post-exercise, with sAA levels analyzed via enzyme-linked immunosorbent assay and cortisol levels analyzed using reversed-phase chromatography.
Results
The correlation between upper airway volume and cortisol was very weak in groups 1 (r=0.066) and 3 (r=0.168) and moderate in group 2 (r=0.680). The correlation between upper airway volume and sAA was moderate in group 1 (r=0.452), weak in group 2 (r=0.232), and moderately negative in group 3 (r=-0.607).
Conclusion
There is no clear correlation between upper airway volume and salivary biomarkers, including cortisol or sAA. Upper airway volume is the only factor that determines physical fitness. Overall dynamics, including airway pressure, velocity, aerodynamic forces, and flow resistance, must also be evaluated in future studies.
1. INTRODUCTION
The duties of the National Armed Forces include upholding state sovereignty, defending territorial integrity, and ensuring the safety of the nation. These responsibilities require high levels of fitness among personnel. Good physical health and fitness boost mental and physical productivity, manage stress levels, improve quality of life, and build teamwork as a unit [1-3]. Successful military operations depend on physical fitness and optimal body composition. A fitter soldier is more resilient to operational stressors [4].
In the medical field, studies have been conducted to evaluate the association between the upper pharyngeal airway anatomy and the quality of life, chronic obstructive pulmonary disease, obstructive sleep apnea, and other diseases [5-7]. A normal upper airway has a significant effect on overall health. Slight obstruction of the upper pharyngeal airway leads to reduced quality of life, increased risk of mouth breathing, and increased risk of diseases in the short-to-long term [6]. Mouth breathing increases the risk of enlarged tonsils and adenoids, gingival inflammation, and improper dentofacial development [8]. In dentistry, orthodontists and dentists focusing on dental sleep medicine are often keen to analyze the upper airways [9]. Cone-beam Computed Tomography (CBCT) is a radiographic tool used to screen for the risk of obstructive sleep apnea and determine the presence of an obstructed airway. The accuracy and reliability of CBCT for evaluating the upper airways have been validated, establishing CBCT as an accurate diagnostic tool for three-dimensional (3D) analysis of the upper airways [10-12]. With the availability of CBCT to analyze the airway, it could become a tool to help evaluate and diagnose the upper airways of military personnel during their recruitment process and annual checkups.
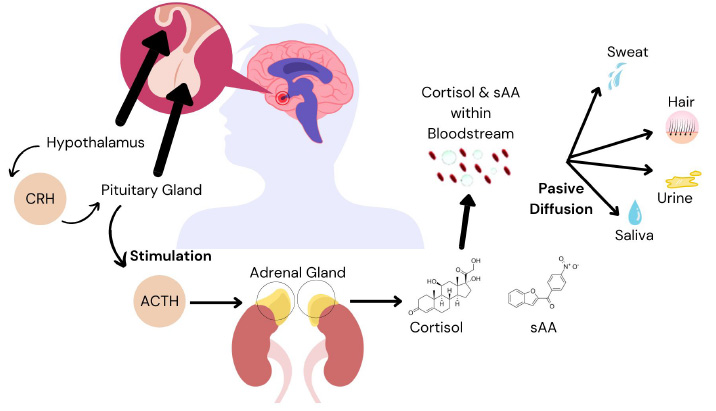
Mechanism of passive diffusion of cortisol and salivary α-amylase from the bloodstream to the saliva, urine, hair, and sweat.
Biomarkers can be obtained from urine, blood, and salivary samples. Saliva samples are preferred for their noninvasive nature and cost-effectiveness compared to urine and blood samples [13, 14]. The human body produces 500–1500 mL of saliva per day [15]. The unstimulated saliva flow rate is 0.3–0.4 mL per minute and increases to 4.0–5.0 mL per minute during stimulated activities, such as physical exercise. The tonicity of saliva increases as the salivary flow rate increases. Salivary α-amylase (sAA) and cortisol are the two most common salivary components. sAA accounts for 40–50% of the total protein content in the saliva, with the majority produced in the parotid gland [16]. Physical exercise and psychological stress are two factors that may increase sAA levels. Salivary cortisol is a commonly used stress biomarker. Cortisol is produced in the hypothalamic pituitary adrenal axis of the adrenal cortex (Fig. 1). Several factors affect cortisol secretion, including stress, nutrition, health, and obesity.
The correlation between the upper airway volume and fitness level based on the biomarkers sAA and cortisol remains unclear. Therefore, in this study, we aimed to examine the relationship between upper airway volume based on CBCT and the fitness level of military personnel. Additionally, the study sought to introduce novel findings and provide a new method for examining the upper airway volume and fitness levels of the military personnel of the National Armed Forces during their initial and routine examinations.
This study was approved by the Research Ethics Committee of Padjadjaran University, Indonesia (approval no.: 861/UN6.KEP/EC/2023) in July, 2023.
2. MATERIALS AND METHODS
2.1. Subjects
This cross-sectional study included 30 male Indonesian marines. The sample was calculated using the formula n = [(Z α/2 + Z β)2 x {(p1 (1-p1) + (p2 (1-p2))}] / (p1 – p2)2, where n is the total number of subjects, p1 and p2 are the proportions of the groups, Z𝛼/2 is the significance level, and Zβ is the power level. CBCT images of participants previously scanned for their routine dental checkups using a standardized protocol were obtained and de-identified for the purpose of the research. Participants were aged 21–29 years, healthy, had no systemic diseases, had Class I malocclusion with normal overjet and overbite (1-3 mm), none-to-mild crowding (<4 mm), no symptomatic craniofacial deformities (cleft lip/palate), had no upper airway pathologies, no history of orthognathic or upper airway/nasal cavity surgery, and no history of head or facial trauma. The 30 marines were randomly divided into three different groups (10 participants each) and were assigned different exercise intensities: mild, moderate, and intense exercise.
2.2. CBCT Scans
CBCT scans were previously performed for all participants as part of their routine dental checkups using a standardized protocol. The image was taken using Dentsply Sirona Orthophos S 3D (Charlotte, North Carolina, USA) with the ‘3D’ setting. Volume scan was 11 x 10 cm, voxel size was 0.3 mm, scan time was 14.4 s, and peak kilovoltage was 85 kV. This protocol was followed to ensure that the Frankfort horizontal (FH) plane (orbitale to porion) of the patient was parallel to the floor [11]. Patients were asked to place their tongue in the most anterior superior position (touching the lingual side of the maxillary front teeth) and bite at maximum intercuspation. They were instructed to swallow, take a deep breath, exhale, and hold their breath during the CBCT. This protocol ensures consistent imaging of the upper airway and reduces variations during the respiratory cycle [17].
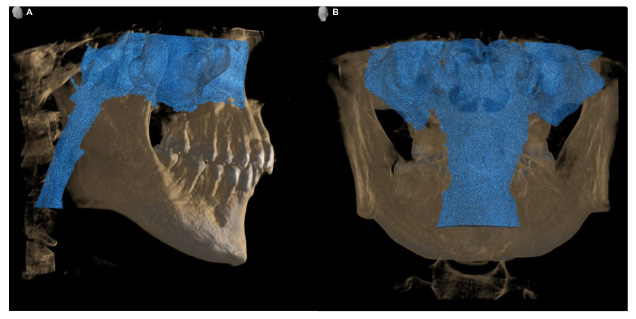
Illustration of upper airway volume (including nasal cavity): (A) lateral view and (B) posterior view.
2.3. 3D Analysis of Upper Airway and Nasal Cavity
The Digital Imaging and Communications in Medicine (DICOM) file of the participants was imported into the 3D analysis software SimPlant 17 Pro (Materialize Dental, Leuven, Belgium). Head orientation was analyzed in three different planes: the FH plane (plane through the left and right porions and orbitale), midsagittal plane (plane through the posterior nasal spine and parallel to the FH plane), and trans-porionic plane (plane through the porion and perpendicular to the FH plane). The nasal cavity was also included in the total volume of the upper airway in this study. The total upper airway volume can be observed from the epiglottis (Et) to the nasal cavity (Fig. 2).
2.4. Physical Exercise and Salivary Collection
The three groups were randomly assigned to one of three different physical exercises and were scored based on the Indonesian National Armed Forces scoring system to ensure that each subject exerted maximum effort. Group 1 (intense exercise group) had to run for 12 min and do pull-ups, sit-ups, and push-ups (1 min each); group 2 (moderate exercise group) had to run for 12 min and do pull-ups and sit-ups (1 min each); and group 3 (mild exercise group) had to run for 12 min and do pull-ups (1 min). All four exercises are part of the Indonesian National Armed Forces’ routine exercises.
Prior to the exercise, each participant’s saliva was collected in a collection tube, and their height (cm), weight (kg), oxygen saturation (% SpO2), heart rate (BPM), and blood pressure (mmHg) were recorded. The exercise began at 8 am sharp for all three groups at the marine base in South Jakarta. Post exercise saliva was collected along with the participant’s % SpO2, heart rate (BPM), and blood pressure (mmHg). A minimum of 2 mL of saliva was collected using the passive droplet method. Participants were not allowed to eat, drink, smoke, or brush their teeth for a minimum of 30 min prior to saliva collection. No dental work was performed 72 h prior to saliva collection.
2.5. Salivary Biomarkers: sAA and Cortisol
The collected saliva was sent to the laboratory (Prodia Clinical Laboratory) for analysis of biomarkers sAA and cortisol. sAA was analyzed using the enzyme linked immunosorbent assay technique and Salimetrics® kinetic enzyme assay kit (State College, PA, USA). Cortisol levels were analyzed using reversed-phase chromatography.
2.6. Statistical Analysis
SPSS version 28 (IBM Corporation, Armonk, New York, USA) was used to analyze the data. Normality tests were performed using the Kolmogorov Smirnov test. A t-test was used to determine whether the samples were different from each other pre and post exercise. Pearson’s correlation was used to determine the strength and direction of two variables. Pearson correlation was found between -1 to 1. A correlation coefficient value (r) of -1 indicates a perfectly negative correlation, 0 indicates no association, and +1 indicates a perfectly positive correlation.
3. RESULTS
Group 1 (mean age, 25.50 ± 3.24 years; mean height, 171.3 ± 4.57 cm; mean weight, 74 ± 9.24 kg) ran approximately 2,560 ± 171.27 m in 12 min and did 11 ± 1.91 pull-ups in 1 min, 38 ± 29.98 sit-ups in 1 min, and 38 ± 3.56 push-ups in 1 min. Group 2 (mean age, 24.80 ± 2.66 years; mean height, 171.1 ± 2.51 cm; mean weight, 66.7 ± 5.93 kg) ran approximately 2,580 ± 168.65 m in 12 min and did 12.3 ± 2.75 pull-ups in 1 min and 39.4 ± 2.41 sit-ups in 1 min. Group 3 (mean age, 24.40 ± 2.50 years; mean weight, 170.4 ± 4.58 cm; mean weight, 68.2 ± 8.39 kg) ran approximately 2,590 ± 73.79 m in 12 min and did 13 ± 2.15 pull-ups in 1 min. Fig. (3) shows the changes in salivary cortisol and α-amylase for each group. Table 1 provides the descriptive statistics on cortisol and sAA levels of groups 1, 2, and 3.
| Variable | Group 1 | Group 2 | Group 3 | |||||||||
|---|---|---|---|---|---|---|---|---|---|---|---|---|
| Cortisol (µg/dL) |
Salivary α-Amylase (U/mL) |
Cortisol (µg/dL) |
Salivary α -Amylase (U/mL) |
Cortisol (µg/dL) |
Salivary α -Amylase (U/mL) |
|||||||
| Pre | Post | Pre | Post | Pre | Post | Pre | Post | Pre | Post | Pre | Post | |
| Mean | 0.331 | 0.386 | 98.200 | 200.600 | 0.181 | 0.285 | 108.10 | 165.10 | 0.359 | 0.306 | 102.50 | 179.40 |
| SEMean | 0.073 | 0.074 | 15.400 | 30.600 | 0.045 | 0.059 | 25.20 | 27.90 | 0.076 | 0.069 | 19.20 | 38.30 |
| TrMean | 0.285 | 0.369 | 96.500 | 199.300 | 0.168 | 0.269 | 99.20 | 158.50 | 0.330 | 0.286 | 96.20 | 181.90 |
| StDev | 0.232 | 0.233 | 48.600 | 96.700 | 0.142 | 0.188 | 79.70 | 88.40 | 0.241 | 0.217 | 60.80 | 121.00 |
| Variance | 0.054 | 0.054 | 2,359.400 | 9,347.400 | 0.020 | 0.035 | 6349.30 | 7811.50 | 0.058 | 0.047 | 3700.70 | 14633.80 |
| CoefVar | 69.980 | 60.440 | 49.460 | 48.190 | 78.590 | 65.960 | 73.73 | 53.52 | 67.140 | 70.780 | 59.32 | 67.44 |
| Minimum | 0.120 | 0.160 | 31.800 | 61.300 | 0.020 | 0.020 | 35.40 | 64.60 | 0.070 | 0.070 | 31.60 | 15.70 |
| Q1 | 0.168 | 0.190 | 55.900 | 85.100 | 0.078 | 0.130 | 39.10 | 84.50 | 0.190 | 0.135 | 43.50 | 59.70 |
| Median | 0.275 | 0.280 | 92.300 | 218.400 | 0.125 | 0.285 | 95.40 | 158.30 | 0.285 | 0.225 | 102.30 | 198.60 |
| Q3 | 0.398 | 0.683 | 133.400 | 265.400 | 0.278 | 0.385 | 164.30 | 233.90 | 0.500 | 0.530 | 145.80 | 308.30 |
| Maximum | 0.910 | 0.750 | 178.100 | 351.000 | 0.450 | 0.680 | 251.60 | 319.10 | 0.880 | 0.700 | 224.30 | 323.10 |
Group 2 – moderate exercise : Run (12 minutes), pull up (1 minute), sit up (1 minute).
Group 3 – mild exercise : Run (12 minutes), pull up (1 minute).
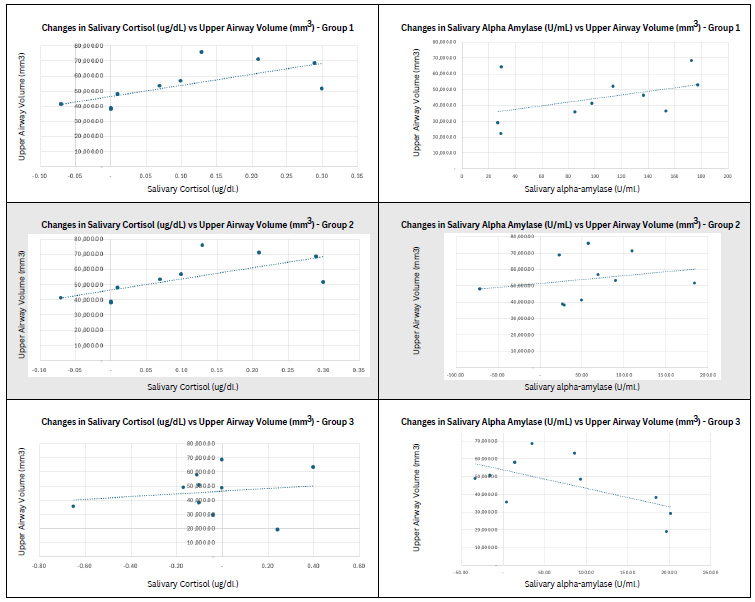
Scatter plot of changes in salivary cortisol and α-amylase against upper airway volume for each group.
Table 2 presents inferential statistics to determine significant differences in physical fitness pre- and post-exercise based on cortisol and sAA levels. Based on the result, the only variable with significance (p-value = 0.01) was sAA when participants performed intense exercise or full exercise (running for 12 min and 1 min each of pull-ups, sit-ups, and push-ups). Cortisol levels were not significantly different for all three groups with different exercises (p-value = 0.530, 0.182, 0.612). sAA for group 2 had a p-value of 0.148, and group 3 had a p-value of 0.096. Table 3 describes the correlation between the upper airway volume and cortisol and sAA levels. In terms of the correlation between cortisol and upper airway volume, group 1 showed a very weak correlation (r = 0.066), group 2 showed a moderate correlation (r = 0.680), and group 3 showed a very weak correlation (r = 0.168). For the correlation between sAA and upper airway volume, group 1 showed a moderate correlation (r = 0.452), group 2 showed a weak correlation (r = 0.232), and group 3 showed a moderate negative correlation (r = -0.607).
4. DISCUSSION
The objective of this study was to evaluate the correlation between upper airway volume and salivary biomarkers, cortisol and sAA, with the aim of identifying novel biomarkers related to the fitness level of military personnel and their upper airway volume, which could enable the National Armed Forces to update their initial and routine checks, particularly focusing on the upper airways of military personnel.
The upper airway is of interest to many dental specialists, including those focusing on dental sleep medicine, oral and maxillofacial surgeons, and ortho- dontists. Since the introduction of CBCT in dentistry in 1998, its use has significantly increased. In the early days, CBCT images were not of high quality, and the technology was very expensive. However, over the years, the quality of the images has significantly improved, and the level of radiation has decreased [18]. CBCT is now widely used because it provides high quality images and a lower radiation dosage, and it is cheaper than standard medical CT [19]. Additionally, with the availability of 3D imaging software, analysis has become easy and accurate.
| Group | Variable | Mean | p-Value | - | |
|---|---|---|---|---|---|
| Pre | Post | ||||
| 1 | Cortisol (µg/dL) | 0.331 | 0.386 | 0.530 | - |
| Salivary α -Amylase (U/mL) | 98.2 | 200.6 | 0.010 | * | |
| 2 | Cortisol (µg/dL) | 0.181 | 0.285 | 0.182 | - |
| Salivary α -Amylase (U/mL) | 108.1 | 165.1 | 0.148 | - | |
| 3 | Cortisol (µg/dL) | 0.359 | 0.306 | 0.612 | - |
| Salivary α -Amylase (U/mL) | 102.5 | 179 | 0.096 | - | |
* Significant (p-value < α = 0.05).
Group 1 – heavy exercise : Run (12 minutes), pull up (1 minute), sit up (1 minute), push up (1 minute).
Group 2 – moderate exercise : Run (12 minutes), pull up (1 minute), sit up (1 minute) .
Group 3 – mild exercise : Run (12 minutes), pull up (1 minute).
| Variable | Group | Statistic | Cortisol (µg/dL) | Statistic | Salivary α-Amylase (U/mL) |
|---|---|---|---|---|---|
| Upper Airway Volume | 1 | r | 0.066 | r | 0.452 |
| p-value | 0.856 | p-value | 0.190 | ||
| 2 | r | 0.680 | r | 0.232 | |
| p-value | 0.031 | p-value | 0.519 | ||
| 3 | r | 0.168 | r | -0.607 | |
| p-value | 0.644 | p-value | 0.063 |
Group 2 – moderate exercise : Run (12 minutes), pull up (1 minute), sit up (1 minute).
Group 3 – mild exercise : Run (12 minutes), pull up (1 minute).
The application of CBCT in dentistry has been extensively studied. CBCT is used to analyze and study the upper airway and nasal cavity. Studies have reported its moderate to excellent reliability [11, 12]. The volume has a higher reliability than the minimum cross-sectional area. Reliability increases if CBCT is performed using a standardized protocol. Minor changes in the head and tongue positions can significantly affect the volume and cross-sectional reading [11, 17]. This study used a standardized protocol previously published for its high inter- and intra-rater reliability.
Currently, the military does not routinely evaluate the upper airways of their personnel. Airway disorders involving the lungs and pulmonary diseases are routinely assessed. However, upper airway volume is usually not evaluated. One reason for this is the lack of access to CBCT. In recent years, more public hospitals have installed CBCT systems, and access to dental radiographs has slowly increased. The upper airway has been analyzed by many dental specialists, particularly orthodontists and dental sleep medicine physicians, with a focus on obstructive sleep apnea [20]. Since dentists focus on the overall health of the patient, they have additional training in checking the upper airway and are able to diagnose potential pathologies and/or issues with the upper airway.
The upper airways include the nasopharynx, oropharynx, and hypopharynx [21]. The upper airway is important for health because it helps people inhale oxygen and exhale carbon dioxide while filtering dangerous germs and bacteria [22]. A healthy upper airway helps stabilize the acidic levels of the body. In addition, a good upper airway improves a person’s quality of life. With an obstructed upper airway, one will have worse sleep quality, which may lead to sleepiness and drowsiness during the day, resulting in other health issues [7, 23-25]. Studies have shown that approximately 14% of young military personnel have asymptomatic obstructive upper airways, which leads to a reduction in their overall daily performance [26]. This demonstrates the importance of diagnosing and evaluating the upper airways in military personnel.
Thirty military personnel were scored while performing physical exercises to ensure that they made their full effort to complete the study. The scoring system of the Indonesian National Armed Forces is used for the military and police academies. The same scoring system is used for entrance and routine examinations. The reason for choosing this score in our study was to ensure that each of the 30 military personnel met the usual criteria. Pre- and post-exercise % SpO2, heart rate (BPM), and blood pressure (mmHg) were also recorded. The readings confirmed that the participants completed their exercises with determination.
The two biomarkers were selected because they are the most common salivary biomarkers and are affected by physical exercise. Biomarkers can be used to assess the effects of acute and chronic exercises. Factors that affect biomarker levels include the type, duration, and importance of exercise. Salivary biomarkers enter the saliva through synthesis, passive diffusion, or ultra- filtration from the bloodstream [27-29]. All salivary glands are located very close to the vascular system, which carries blood and lymph fluid [30, 31]. sAA was discovered in 1831 by Leuchs and is formed by two families of isoenzymes: one is glycosylated, and the other does not contain carbohydrates [32, 33]. The release of sAA occurs due to the activation of the autonomic nervous system and mostly during psychological stress and high autonomic activation. Physical exercise is one reason for the activation of the sympathetic nervous system, leading to an increase in sAA levels [34, 35]. The sAA AMY1 gene is the most common α-amylase gene in saliva. Low expression of sAA AMY1 may lead to a low taste bud count, diabetes, obesity, impaired insulin secretion, and insulin resistance [29].
Cortisol levels also change during physical exercise. Fifteen minutes of extreme physical exercise or 30 minutes of fast-paced walking leads to an increase in cortisol levels [36]. An increase in cortisol levels is caused by an increase in blood cell concentration owing to the loss of plasma and water from the bloodstream, hemoconcentration, and stimulation of the hypothalamus-hypophysis-adrenal axis [37, 38]. Low intensity exercise may or may not increase cortisol levels. However, the increase is not significant. There are times when low-intensity exercise leads to a decrease in cortisol [39-41]. Cortisol levels are often associated with maximum oxygen uptake (VO2max). VO2max of 50–60% is the threshold for an increase in cortisol [42]. Cortisol is usually required during fight or flight responses of the autonomic nervous system. Irregularities in cortisol levels may be indicative of health issues.
In terms of the correlation between the upper airway volume and salivary biomarkers, data varied for both cortisol and sAA levels. Group 1 showed a very weak correlation (r = 0.066), group 2 showed a moderate correlation (r = 0.680), and group 3 showed a very weak correlation (r = 0.168). For sAA, group 1 showed a moderate correlation (r = 0.452), group 2 showed a weak correlation (r = 0.232), and group 3 showed a moderate negative correlation (r = -0.607). With this wide variation, no clear correlation was found between the upper airway volume and salivary biomarkers, cortisol and sAA.
Further studies on the upper airway have shown that upper airway volume is an indicator and a factor of health. Many studies have examined the relationship between the upper airway volume and its relationship to obstructive sleep apnea. There are many different theories for this concept. Some researchers believe that a small upper airway volume increases the likelihood of obstructive sleep apnea; however, other studies have shown that this is not the case. Nevertheless, a recent study mentioned that the upper airway volume is the only factor determining a person’s health [43, 44]. Other factors include airway pressure, velocity, aerodynamic forces, and flow resistance [43]. These factors are known as upper airway flow dynamics. Pressure drop may be caused by the narrowing of the oropharynx region and by pathologies, such as adenoids and tonsils, whereas flow resistance is usually compared to the patient’s breathing effort and is usually caused by narrowing of areas, such as the oropharynx [45, 46]. Non-anatomical factors, such as muscles, also play an important role in physical fitness. For example, the Genioglossus muscle plays an important role in the prevention of airway collapse [47-49].
Analysis of the upper airway volume using CBCT will be a good addition to the National Armed Forces checklist. Salivary biomarkers, sAA and cortisol, showed changes during physical exercise. However, there was no clear correlation between upper airway volume and the fitness level of soldiers based on these biomarkers. Therefore, further studies must be conducted to determine the correlation between the upper airway volume and the fitness level of soldiers. Other salivary biomarkers need to be evaluated. To increase the validity of this study, the overall airway dynamics (pressure, airflow resistance, velocity, aerodynamic forces, and volume) should have been evaluated, not just the airway volume. Comparing the military personnel with laypeople will also increase the validation of the study.
CONCLUSION
The upper airway volume can be evaluated using CBCT. There is no clear correlation between the upper airway volume and salivary biomarkers, cortisol and sAA. Upper airway volume is a factor that determines one’s physical fitness. Overall upper airway dynamics, including airway pressure, velocity, aerodynamic forces, and flow resistance, must also be evaluated.
AUTHORS’ CONTRIBUTION
AM, GW, and EM contributed to the conception and design of the study. MZ carried out data collection. OZ, SW, and HH took part in data analysis and interpretation of results. IH was involved in writing the manuscript. All authors reviewed the results and approved the final version of the manuscript.
LIST OF ABBREVIATIONS
| % SpO2 | = Oxygen Saturation |
| 3D | = Three-Dimensional |
| CBCT | = Cone-beam Computed Tomography |
| DICOM | = Digital Imaging and Communications in Medicine |
| FH | = Frankfort Horizontal |
| sAA | = Salivary α-Amylase |
| VO2max | = Maximum Oxygen Uptake |
ETHICS APPROVAL AND CONSENT TO PARTICIPATE
The study design was approved by the Research Ethics Committee of Padjadjaran University, Indonesia (approval no. 861/UN6. KEP/EC/2023) in July, 2023.
HUMAN AND ANIMAL RIGHTS
All procedures involving human participants were performed in accordance with the ethical standards of the institutional and/or research committees and the 1975 Declaration of Helsinki, as revised in 2013.
AVAILABILITY OF DATA AND MATERIALS
The data sets analyzed during the current study are available from the corresponding author [I.A.H.] upon reasonable request.
ACKNOWLEDGEMENTS
The authors would like to thank the Center Study for Military Dentistry, Faculty of Dentistry, Padjadjaran University, Bandung, for providing resources. The authors would also like to thank P.T. Prodia Widyahusada TBK (Prodia Laboratory) for guidance with biomarker data analysis, and Mr. Krisna Fery Rahmantya, S.Si, and M.Si for providing help with the statistical analysis.

