All published articles of this journal are available on ScienceDirect.
Assessment of Trabecular Bone During Dental Implant Planning using Cone-beam Computed Tomography with High-resolution Parameters
Abstract
Background:
Cone-Beam Computed Tomography (CBCT) with high-resolution parameters may provide an acceptable resolution for bone assessment.
Objectives:
The purpose of this study is to assess trabecular bone using two cone-beam computed tomography (CBCT) devices with high-resolution parameters in comparison to micro-computed tomography (µCT).
Methods:
Bone samples (n=8) were acquired from dry mandibles and scanned by two CBCT devices: 1) VV (Veraview R100, Morita; FOV 4x4, 75kV, 9mA, voxel size 0.125µm); and PR (Prexion 3D, Prexion; FOV 5x5, 90kV, 4mA, 37s, voxel size 108µm). Gold-standard images were acquired using µCT (SkyScan 1272; Bruker; 80kV, 125mA, voxel size 16µm). Morphometric parameters (BvTv- Bone Volume Fraction, BsBv- Trabecular specific surface, TbTh- Trabecular thickness and TbSp- Trabecular separation) were measured. Statistical analysis was performed within ANOVA, Spearman Correlation test and Bland-Altmann plots with a statistical significance level at p=0.05.
Results:
CBCT devices showed similar BvTv values in comparison to µCT. No statistical difference was found for BvTv parameters assessed by CBCT devices and µCT. BsBv values were underestimated by CBCT devices (p<0.01), whereas TbTh and TbSp values were overestimated by them (p<0.01). Positive correlations were found between VV and µCT measurements for BvTv (r2= 0.65, p=0.00), such as between PR and µCT measurements for TbSp (r2= 0.50, p=0.04). For BsBv measurements, PR was negatively correlated with µCT (r2= -0.643, p=0.01).
Conclusion:
The evaluated CBCT device was able to assess trabecular bone. However, bone parameters were under or overestimated in comparison to µCT.
1. INTRODUCTION
One important factor for successful dental implant treatment is the choice of an optimal site for the planned prosthetic and surgical reconstruction [1-5]. In this respect, not only the position of the implant-supported restoration but also the bone features should be taken into consideration [6]. Recent studies have shown that trabecular bone micro- architecture may influence the primary stability of dental implants [7, 8]. Hence, assessment of trabecular bone has also been gaining special attention [3, 9, 10].
Clinically, Cone-beam Computed Tomography (CBCT) is the method of choice to evaluate bone [10-12]. Whereas cortical bone measurements can be precisely determined by CBCT [13]; limitations of the technique, as excessive noise and hardening beam artifacts, may hamper the assessment of trabecular bone [14, 15].
Despite the limitations related to the technique, a recent study reported an acceptable accuracy for the assessment of trabecular bone. Due to the range of available resolution parameters, these findings may not be extended to all CBCT devices. However, it is expected that high-resolution parameters may provide higher accuracy for bone assessment.
Due to the capability of the technique of providing images with a spatial resolution up to 2 μm, microcomputed tomography (µCT) is considered the gold-standard technique to evaluate jaw bone in laboratory research works . The technique allows determining both bone volume and trabecular morphology [16]. This study proposed to compare the trabecular bone assessment by two CBCT devices in regard to the µCT. The null hypothesis is that there is no difference in trabecular bone parameters acquired from µCT and CBCT devices.
2. MATERIALS AND METHODS
2.1. Study Design
The present study was performed after approval of the Ethics Committee of School of Dentistry, University of São Paulo (Protocol number 2.253.943). Trabecular bone was assessed using two CBCT scanners. Two types of bone were considered: Group 1 (G1) consisted of non-prepared bone, whereas group 2 (G2) consisted of decalcified bone, representing a bone loss situation.
Measurements were compared with gold standard measurements provided by micro-computed tomography (µCT). The following bone morphological parameters were assessed [17]:
- Trabecular volume fraction (BvTv): the ratio (%) of segmented trabecular bone volume (BV) to the total volume;
- Bone specific surface (BsBv): Ratio (1/cm) of segmented trabecular bone surface (BS) to the trabecular bone volume (BV);
- Trabecular thickness (TbTh): Mean thickness of trabecular bone (cm)
- Trabecular separation (TbSp): Mean distance between trabeculae (cm)
The sample size was determined based on BvTv and TbTh, since these were considered the main parameters for bone assessment. A pilot study (n=3) was performed and the number of required samples was calculated using G*Power app (Dusseldorf). According to the test, at least eight samples were required to identify a mean difference of 15±4.27% of BvTv and 0.02cm of TbTh with a significance of 0.05 and α= 80%.
2.2. Samples Acquisition
Four human dry mandibles were provided by the Department of Anatomy, Biomedical Sciences Institute of the University of São Paulo. These were sectioned in bone samples measuring 3 cm in length using a diamond disc. Four bone samples were extracted from each mandible, two from the anterior mandible and two from the posterior mandible.
Bone samples were divided into two groups (n=8) according to the bone type: G1 contained bone samples acquired from the anterior mandible, which consists of a more dense bone. G2 represented a bone loss situation; thus, bone samples were acquired from the posterior mandible and decalcified according to the protocol described by Hua et al. (2009) [18]. In summary, samples were immersed in hydrocloridric acid (HCl) solution (Decal, Serva, Heidelberg, Germany) twice, for ten minutes each time. After each interval, samples were rinsed with distilled water and dried.
The difference between bone parameters of groups G1 and G2 was first controlled by scanning the samples with a microcomputed tomography Skyscan 1272 (Bruker, Kontich, Belgium). The following parameters were used: 80kV, 125mA and voxel size 16µm [19]. Bone parameters were calculated and the difference between the groups was confirmed by Student`s t test (Appendix 1). The same parameters were used as control (gold-standard).
2.3. Cone-beam Computed Tomography
CBCT images were acquired with two high-resolution CBCT scanners:
VV- Veraviewpocs R100 (Morita), with a field of view (FOV) 4x4, 75kV, 9mA, voxel size of 0.125 µm; and PR- Prexion 3D (Prexion), with a field of view (FOV) of 5x5, 90kV, 4mA, 37s, and a voxel size of 108 µm.
2.4. Image Processing
Images were processed using the software Imalytics Preclinical (Gremse-IT GmbH, Aachen, Germany) [20]. Bone structures were matched using common points as reference. Regions were defined using a combination of manual and automated segmentation. First, cortical bone, trabecular bone, and marrow spaces were segmented and classified into different categories according to different threshold values.
Due to the high contrast among tissues in µCT images, it was possible to segment bone using a mean threshold value determined by the software. For CBCT groups, as the contrast was lower, this mean threshold value was not representative. In other words, since the tissue borders might not be well-delimited in CBCT images, a fixed threshold value could exceed the trabecular dimensions. Thus, for those cases, the threshold value was individually calculated for each image based on the grey values of bone and air. The segmentation was then visually inspected. When required, it was refined based on morphological parameters using distance mapping.
2.5. Trabecular Bone Assessment
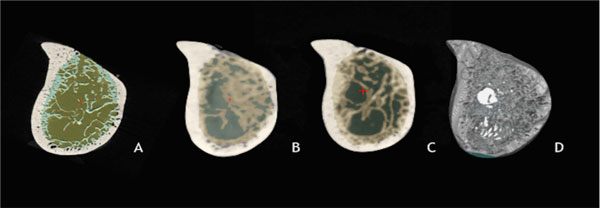
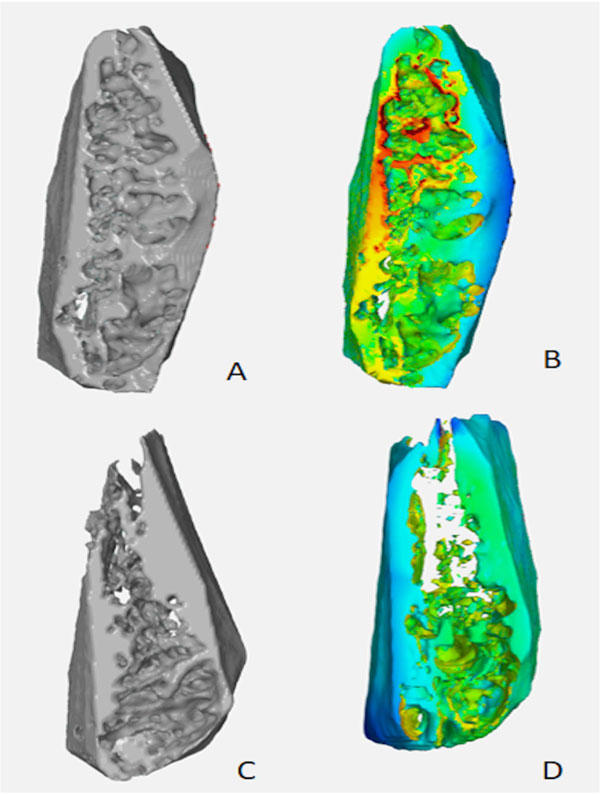
A Volume Of Interest (VOI) comprising only trabecular bone was manually determined. Bone parameters cited above (BvTv, BsBv, TbTh, TbSp) were automatically calculated by the software Imalytics (Fig. 1a-d). In addition, Standard Tesselation Language (STL) tridimensional (3D) models representing the selected VOI were created and exported to the software GOM Inspect. A representative visual analysis was performed using a color-coded map to compare the experimental groups with the gold-standard (Fig. 2a-d).

2.6. Statistical Analysis
Descriptive data were described as mean ± standard deviation and 95% confidence interval (95% CI). Shapiro-Wilk was used to assess the adherence to the normal curve. In addition, the adherence to the Mauchly sphericity was assessed. Within-ANOVA and post-hoc tests were used to assess the statistical difference among scanners according to the bone type (G1 and G2).
The general accuracy of CBTs was evaluated by pooling groups G1 and G2 together. Bland-Altman plots were made to evaluate the general accuracy of CBCT scanners. The correlation of measurements obtained by each scanner to µCT was assessed using the non-parametric Spearman correlation test.
3. RESULTS
Table 1 describes data and statistical analysis of bone values assessed by CBCT according to each bone type. A significant interaction was shown between scanners and bone type for BvTv, BsBv and TbTh values (Appendix 1).
Bone parameters assessed by CBCT and µCT are represented in Fig. (3). Measurements of BvTv and BsBv were underestimated by CBCT. However, for BvTv, this difference was not statistically significant (VV: p=0.13; PR: p=0.06). For BsBv, both scanners differed statistically from µCT (VV p= 0.00; PR p=0.01). Conversely, TbTh and TbSp were overestimated by both scanners (p<0.01).

| uCT | VV | PR | ||||||||
|---|---|---|---|---|---|---|---|---|---|---|
| Mean±SD | 95%CI | Mean±SD | 95%CI | Mean±SD | 95%CI | |||||
| Inferior | Superior | Inferior | Superior | Inferior | Superior | |||||
| BV.TV | ||||||||||
| G1 | 53.17±12.57* | 46.13 | 60.21 | 45.37±10.87* | 38.91 | 51.84 | 37.86±9.13¶ | 32.45 | 43.27 | |
| G2 | 33.51±3.78 | 26.47 | 40.54 | 32.57±5.20 | 26.10 | 39.03 | 36.55±4.29 | 31.14 | 41.96 | |
| BS.BV | ||||||||||
| G1 | 52.98±12.42* | 43.19 | 62.78 | 20.05±3.77¶ | 16.32 | 23.78 | 34.65±5.78† | 30.02 | 39.28 | |
| G2 | 72.03±11.61* | 62.87 | 81.19 | 27.25±5.15¶ | 23.76 | 30.74 | 27.44±5.56¶ | 23.11 | 31.77 | |
| TbTh | ||||||||||
| G1 | 0.06±0.01* | 0.05 | 0.07 | 0.24±0.03¶ | 0.22 | 0.26 | 0.15±0.01† | 0.13 | 0.17 | |
| G2 | 0.05±0.01* | 0.04 | 0.06 | 0.19±0.01¶ | 0.17 | 0.21 | 0.18±0.02¶ | 0.17 | 0.20 | |
| TbSp | ||||||||||
| G1 | 0.08±0.02* | 0.06 | 0.10 | 0.27±0.08¶ | 0.21 | 0.33 | 0.19±0.06¶ | 0.14 | 0.24 | |
| G2 | 0.12±0.02* | 0.11 | 0.14 | 0.29±0.06¶ | 0.24 | 0.35 | 0.28±0.07¶ | 0.23 | 0.33 | |

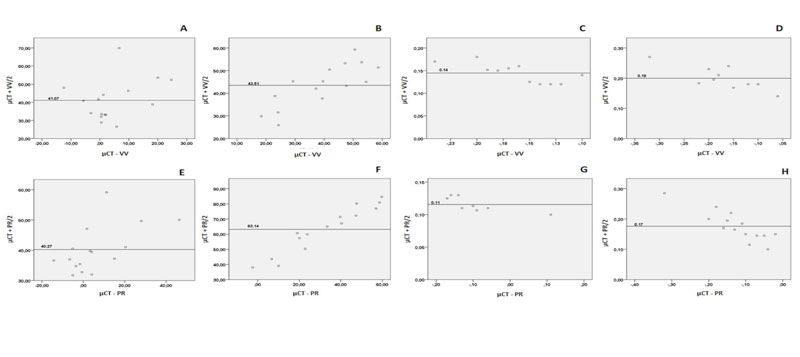
Bland-Altman plots show the relationship between the arithmetic mean of CBCT and µCT measurements with the measurement error (µCT - CBCT measurements). Overestimated values by CBCT are shown as negative values (Fig. 4a-h). The results suggested that for BsBv, the higher the mean values, the higher the underestimation by CBCT. Conversely, for TbSp, higher means are related to higher overestimated measurements.

There was a weak to moderate correlation between CBCT devices and µCT. A positive statistically significant correlation was found between VV and µCT (rs=0.65, p=0.00) for BvTv, such as between PR and µCT measurements (rs= 0.50, p=0.04) for TbSp values. For BsBv measurements, PR was negatively correlated with µCT (rs= -0.643, p=0.01).
4. DISCUSSION
The present study aimed to determine whether bone architecture values provided CBCT could be comparable with the gold-standard µCT. The clinical relevance relies on providing data regarding the accuracy of CBCT to determine bone microarchitecture, which could improve dental implant planning. However, null hypotheses were rejected since bone values were under or overestimated by CBCT.
The trabecular bone assessment has gained special attention during implant planning. Studies reported that not only a high bone density but also the vascularization of bone marrow are important factors when considering the osteointegration of dental implants [8]. In this study, the main morphometric parameters were assessed to determine trabecular bone: trabecular volume fraction, bone-specific surface, trabecular thickness, and trabecular separation [16].
Jaw bone with well-structured trabeculae tends to present high bone volume fraction and trabecular thickness, associated with a low bone surface density and trabecular separation. According to Van Dessel et al., (2016) [15], this is the ideal condition for osteointegration of dental implants. In order to simulate different clinical situations, two types of bone were considered in this study. The first one represented a more dense intact bone, whereas the second one simulated a bone loss, on which trabeculae tended to be thinner.
According to the findings of this study, CBCT tended to underestimate BvTv and BsBv parameters, but overestimating TbTh and TbSp values. These results are in agreement with previous studies, which show measurement errors for different CBCT devices [2, 3, 21, 22].
From all measurements performed by CBCT scanners, bone volume fraction was the most reliable one, regardless of the evaluated bone type. The underestimation of BsBv was related to the limitations of CBCT in determining the complexity of trabeculae. Conversely, the trabecular thickness was overestimated by CBCT scans. This may be explained by the partial volume effect produced by CBCT scans. As the voxel size is greater than the spatial resolution, boundaries may not show an optimal delimitation. That leads to a distortion of boundaries and, subsequently, measurement errors from trabecular thickness [14, 20].
Likewise, the partial volume effect can explain why trabecular separation was overestimated. Since trabeculae smaller than the voxel size does not appear on the final image, this was set as marrow space, increasing the values of trabecular spaces [14, 20]. Additionally, a limitation of this technique that may have affected the final image is the manual selection of threshold parameters, which only enabled visual inspection [23].
The image resolution is determined by voxel size, which can vary between 90um to 400um [14]. For situations where a reduced Field of View (FOV) is sufficient, clinicians can benefit from a balance between high-resolution mode and reduced radiation [24, 25]. Nonetheless, even high-resolution CBCT is limited to measure trabecular bone parameters [26].
CONCLUSION
In order to facilitate the visualization of bone structure, 3D-models were rendered and compared based on visual analysis. 3D rendering is a simple way to visualize trabecular bone architecture and determine the ideal implant site. The use of STL 3D-models in combination with morphometric analysis was previously recommended to assist clinicians in choosing the ideal implant placement site [3, 15].
The main limitation of this study is the inability to represent a clinical situation. Since dry mandibles were used, the influence of soft tissue was not considered. Furthermore, the segmentation method based on a threshold value is still limited due to the low contrast of anatomical structures in CBCT images. The methodology used for bone assessment requires a precise determination of VOI and may not be reliable for the clinical practice.
AUTHOR´S CONTRIBUTIONS
L.B. and P.T. made contributions to the study conception; L.B., F.G., and IC. acquired and analysed data; J.K., L.B., and M.H. interpreted data and drafted the work. All authors approved the submitted version.
ETHICS APPROVAL AND CONSENT TO PARTICIPATE
The present study was approved by the Ethics Committee of School of Dentistry, University of São Paulo, Brazil (Protocol number 2.253.943).
HUMAN AND ANIMAL RIGHTS
All procedures followed were in accordance with the ethical standards of the responsible committee on human experimentation (institutional and national) and with the Helsinki Declaration of 1975, as revised in 2008.
CONSENT FOR PUBLICATION
Not applicable
AVAILABILITY OF DATA AND MATERIALS
The datasets used during the current study can be made available upon reasonable request to the corresponding author [L.B].
FUNDING
None.
CONFLICT OF INTEREST
The author declares no conflict of interest, financial or otherwise.
ACKNOWLEDGEMENTS
Not applicable.
APPENDIX
| Sum of Squares | df | Mean square | F | p-value | |
|---|---|---|---|---|---|
| BvTv | |||||
| Scanner | 319.027 | 2 | 159.51 | 2.23 | 0.12 |
| Scanner*Bone | 688.21 | 2 | 344.10 | 4.81 | 0.01 |
| BsBv | |||||
| Scanner | 12713.63 | 1.31 | 9693.20 | 93.14 | 0.00 |
| Scanner* Bone | 1290.74 | 1.31 | 984.09 | 9.45 | 0.00 |
| TbTh | |||||
| Scanner | 0.222 | 2 | 0.111 | 234.17 | 0.00 |
| Scanner* Bone | 0.012 | 2 | 0.006 | 13.11 | 0.00 |
| TbSp | |||||
| Scanner | 0.272 | 2 | 0.136 | 41.61 | 0.00 |
| Scanner* Bone | 0.010 | 2 | 0.005 | 1.48 | 0.24 |


