All published articles of this journal are available on ScienceDirect.

Determination of Pubertal Growth Plot Using Hand-wrist and Cervical Vertebrae Maturation Indices, Dental Calcification, Peak Height Velocity, and Menarche
Abstract
Introduction:
Pubertal growth stages are important periods in orthodontic treatment with functional appliances and orthognathic surgery. Pubertal growth prediction, which determines the amount of growth that has taken place and estimates the remaining growth, can influence diagnosis, treatment goals, treatment plans, and orthodontic treatment outcomes, especially in cases requiring growth intensity or growth completion. Determination of pubertal growth stages is more accurate when performed using physiological maturation indicators than chronological age. There are several maturation indices that can be used to predict the pubertal growth stage, such as hand-wrist maturation, cervical vertebrae maturation index (CVMS), dental calcification, peak height velocity of body height (PHV), and menarche in females. The aim of this study was to identify the differences and correlation between hand-wrist, CVMS maturation stages, peak height velocity (PHV), canine and M2 calcification stages, and menarche age (of female subjects). The study also aimed to describe the pubertal growth curve plot of female and male subjects.
Materials and Methods:
This is a retrospective study with a cross-sectional approach, which included 279 females and 144 males aged 8-17 years. Subjects had digital lateral cephalograms, hand-wrist, and panoramic radiographs. The hand-wrist maturation stage was analyzed using the Fishman method, CVMS using Baccetti et al.’s method, and the stages of dental maturation were assessed using Demirjian and Goldstein method. PHV was measured from standing height using a wall-mounted plastic stadiometer, while menarche was analyzed through interviews. Statistical analysis by ANOVA, post hoc analysis, and Spearman’s rank correlation coefficient were determined with Excel Mega Stat.
Results:
There were significant differences between females and males in CVMS and hand-wrist (P< 0.05) except for radius union (Ru). No significant differences in canine and M2 calcification between females and males were observed. PHV females increased by 7.89 cm at 11-12 years, while males increased by 9.9 cm at 13-14 years. Menarche occurred at the age of 12.2 years on average, with the oldest being 14.7 years and the youngest being 9.6 years. The correlation between females’ and males’ hand-wrist and CVMS was very high. The lowest correlation in females was between menarche and CVMS and in males, it was between PHV and canine.
Conclusion:
Maturation stages of hand-wrist, CVMS, and PHV females were earlier than males. Pubertal growth curves plot of females tended to skew to the left, demonstrating that the time from the beginning to the peak of pubertal growth is shorter than that from the peak to the end of pubertal growth, while pubertal growth curves plot of males tended to skew to the right, demonstrating that the time from the beginning to the peak of pubertal growth is longer than that from the peak to the end of pubertal growth.
1. INTRODUCTION
Orthodontic treatment patients who are in their pubertal growth period must be evaluated for individual growth stages to maximize the success of orthodontic treatment, especially in orthodontic growth modification treatment and orthognathic surgery. Pubertal growth is a specific period of human development, which is marked by rapid changes in size, shape, and body composition. The onset of puberty corresponds to a skeletal age, and this is sexually dimorphic. The pubertal growth period consists of an initial period, peak, and end; the associated changes can be gradually monitored with several signs that may become visible at the same time. Several factors influence pubertal growth, either independently or in conjunction with each other, to modify an individual’s genetic potential [1-4].
In the field of orthodontics, the growth period is the period for preventing malocclusion from becoming more severe and treating the growth modification of maxillary-mandibular disharmony with functional orthodontic appliances. On the other hand, orthognathic surgery of maxillary-mandibular disharmony can be done if the growth has been completed [5, 6]. Several factors influence pubertal growth, such as environment, genetics, gender, ethnicity, and race to modify the genetic potential, either independently or in conjunction. Therefore, the determination of the pubertal growth stage using physiological maturation is important in orthodontic treatment, which depends on the intensity of pubertal growth [6-8].
Hand-wrist radiographs, cervical vertebral maturation (CVMS) on lateral cephalograms, canine and second molar (M2) calcification, peak height velocity (PHV), and menarche are some of the physiological characteristics utilized in determining pubertal growth stages. Compared to chronological age, these are more reliable tools to identify the stages of pubertal growth [9-12]. Demirjian et al. evaluated the interrelationships between menarche, PHV, the emergence of the sesamoid of the thumb, and dental development among French-Canadian girls. They found that the average ages of maturation and correlation of inter-maturation stages were significantly different (P < 0.01) [13]. It is difficult to find in the research literature on pubertal growth using several physiological maturation indicators and obtaining a pubertal growth curve pattern based on these various physiological maturation indicators.
The aim of this study was to investigate the pubertal growth stage using hand-wrist and CVMS maturation indices, Canine, and M2 calcification, as well as PHV and menarche, to identify the differences and correlations between the inter-physiological indicators, and the last is to create pubertal growth plot separate for female and male subjects.
2. MATERIALS AND METHODS
A retrospective study design with a cross-sectional approach was adopted. The material consisted of digital hands-wrists radiograph, lateral cephalograms, and panoramic radiographs of 279 female and 144 male patients, aged 8-17 years. Each good quality radiograph was used, with a total of 1269 radiographs. All data were from orthodontics patients at Orthodontic Clinic Faculty of Dentistry, University of Padjadjaran, Indonesia. The inclusion criteria were as follows: healthy, free from systemic or serious illness, Deutero-Malay race origin, no previous history of orthodontic treatment, no history of trauma on the face, hand, and wrist, and cervical vertebrae, and no missing teeth on both sides of the mandible. Hand-wrist maturation was analyzed by the Fishman method, which consisted of four maturation stages and eleven of SMIs Figs. (1 and 2). CVMS was analyzed using the Baccetti et al. method with five stages of maturation Fig. (3). Tooth calcification was analyzed using the Demirjian and Goldstein method which consisted of eight stages of tooth calcification Fig. (4). Identification of the stage of maturation from hand and wrist, CVMS from lateral cephalogram, and tooth calcification from panoramic radiograph was performed using a computer.
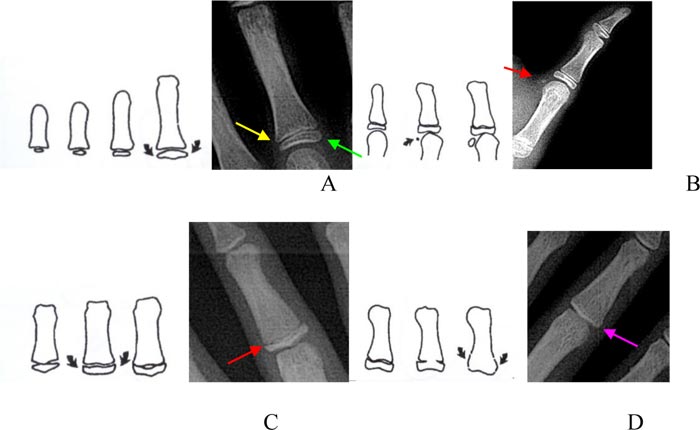
B. SMI-4: appearance adductor sesamoid of the thumb
C. SMI-5 to SMI-7: capping of epiphysis to the diaphysis
D. SMI-8 to SMI-11: the fusion of epiphysis and diaphysis [14].
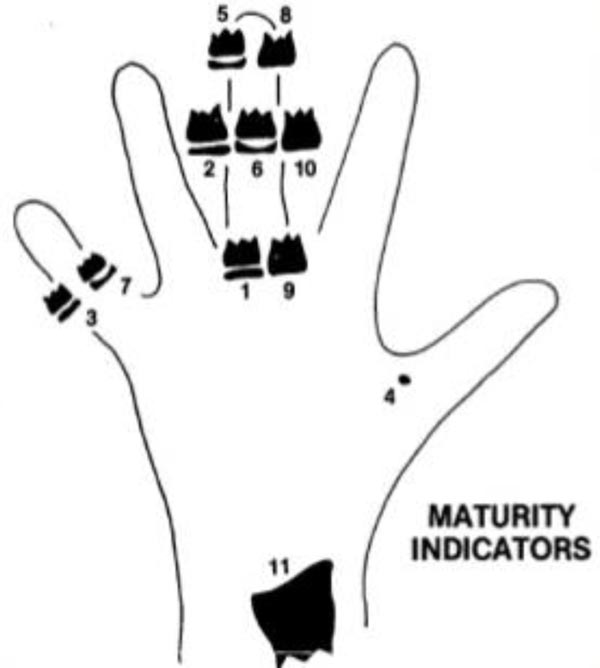
Eleven of SMIs by Fishman method:
Width of epiphysis equal to diaphysis:
SMI-1: epiphysis equal to diaphysis at proximal of the third finger
SMI-2: epiphysis equal to diaphysis at the middle phalanx of the third finger
SMI-3: epiphysis equal to diaphysis at the middle phalanx of the fifth finger
SMI-4: the appearance of the adductor sesamoid of the thumb
Capping of epiphysis to the diaphysis:
SMI-5: capping epiphysis to diaphysis distal phalanx of the third finger
SMI-6: capping epiphysis to diaphysis middle phalanx of the third finger
SMI-7: capping epiphysis to diaphysis middle phalanx of the fifth finger
Union of epiphysis and diaphysis:
SMI-8: union epiphysis and diaphysis distal phalanx of the third finger
SMI-9: union epiphysis and diaphysis proximal phalanx of the third finger
SMI-10: union epiphysis and diaphysis middle phalanx of the third finger
SMI-11: union epiphysis and diaphysis of radius
.
CVMS, according to the Baccetti et al. method [9], consists of five stages Fig. (3).
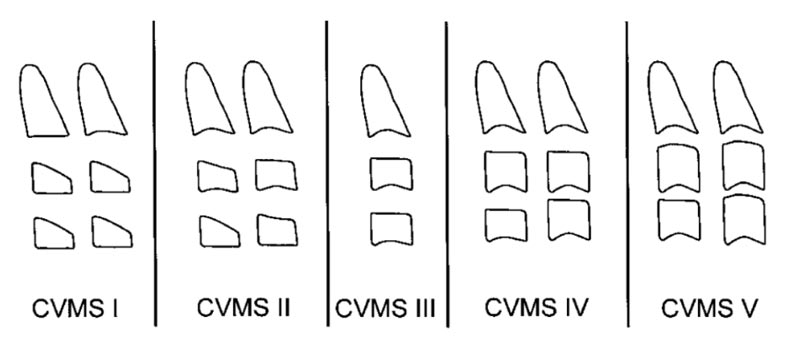
Fifth CVMS by Baccetty et al. method:
CVMS I: The lower borders of C2, C3, and C4 are flat, with the possible exception of a concavity at the lower border of C2 in almost half of the cases. The bodies of C3 and C4 are trapezoid (the superior border of the vertebral body is tapered from posterior to anterior).
CVMS II: Concavities at the lower borders of C2 and C3 are present. The bodies of C3 and C4 may be either trapezoid or rectangular horizontal in shape.
CVMS III: Concavities at the lower borders of C2, C3, and C4 are now present. The bodies of both C3 and C4 are rectangular horizontal in shape.
CVMS IV: The concavities at the lower borders of C2, C3, and C4 are still present. At least one of the bodies of C3 and C4 is squared in shape. If not squared, the body of the other cervical vertebra still is rectangular horizontal.
CVMS V: The concavities at the lower borders of C2, C3, and C4 are still evident. At least one of the bodies of C3 and C4 is rectangular vertical in shape. If not rectangular vertical, the body of the other cervical vertebra is squared [9].
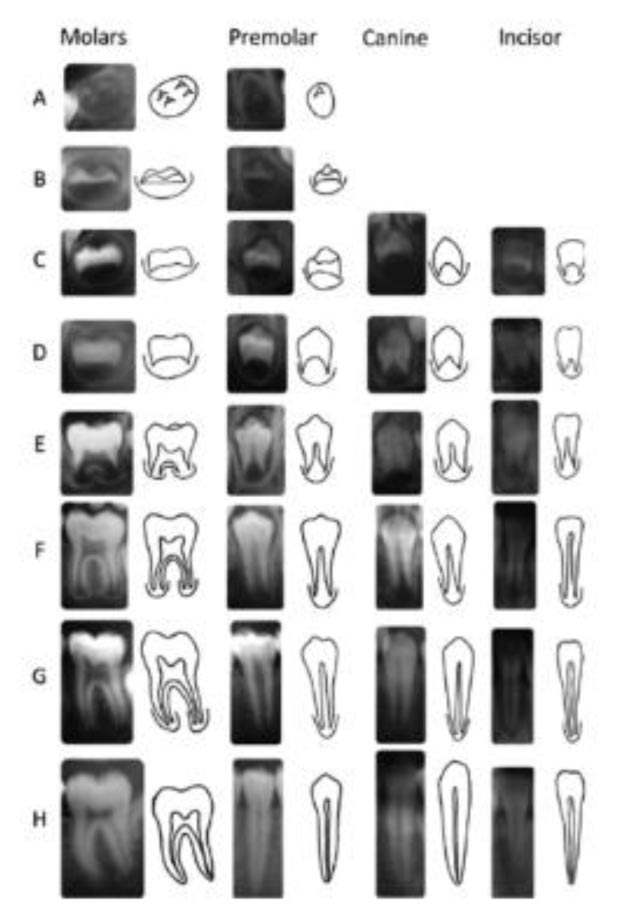
The development of canine and M2 calcification, according to the Demirjian and Goldstein method, consists of A-H stages [10].
Dental developmental stages of Demirjian and Goldstein’s method:
Stage A: Calcification of single occlusal points without fusion with different calcifications.
Stage B: Fusion of mineralization points; the contour of the occlusal surface is recognizable
Stage C: Enamel formation at the occlusal surface has been completed, and dentine formation has commenced. The pulp chamber is curved, and no pulp horns are visible
Stage D: Crown formation has been completed to the level of the cementoenamel junction. Root formation has commenced. The pulp horns are beginning to differentiate, but the walls of the pulp chamber remain curved
Stage E: The root length remains shorter than the crown height. The walls of the pulp chamber are straight, and the pulp horns have become more differentiated
Stage F: The walls of the pulp chamber now form an isosceles triangle. The root length is equal to or greater than the crown height.
Stage G: The walls of the pulp chamber now form an isosceles triangle. The root length is equal to or greater than the crown height.
Stage H: The apex of the root is completely closed with a uniform periodontal membrane surrounding the root and apex.
Determination of PHV was done from the measurement of body height of each patient at chronological age. The measurement was done using a wall-mounted plastic stadiometer simultaneously with the radiograph taken and recorded on the medical record of each patient. Plastic stadiometers consist of a ruler and a sliding horizontal headpiece, and these tools had acceptable accuracy for clinical use. The head, shoulders, and buttocks of the patient were against the stadiometer’s wall. The headboard was on the top of the head, straight ahead from the Frankfurt Horizontal plane of the patient [11]. Menarche was determined by interviewing female patients [12], and 102 female patients were able to correctly state the month and year of their menarche. Menarche data were also recorded on the medical record of each patient.
2.1. Statistical Analysis
The parametric ANOVA test was used to analyze the differences between inter-physiological indices and Spearman rank correlation coefficients to determine the correlation of inter-pubertal stages (P < 0.05). Post-hoc analysis for determination of the differences in inter-maturational indices between females and males was performed by t-test, P < 0.05, with SPSS 21 software Excel Mega Stat (IBM SPSS Statistics, IBM Corporation, Chicago, IL). The Gaussian distribution was P = 0.1231 for males and, P= 0.0956 for females. The reliability test was conducted based on 10 random hand-wrist radiograms, lateral cephalograms, and panoramic radiographs from both female and male participants. Repeated measurements were made 3 times by three researchers at 2-week intervals. The Kappa interrater coefficient showed no significant differences in hand-wrist (0.910 in females and 0.879 in males), CVMS (0.812 in females and 0.83 in males), and dental calcification (0.852 in females and 0.873 in males) measurements.
3. RESULTS
The results of this study are shown in Tables (1 and 8). The mean chronological ages of both females and males can be seen in Table (1). ANOVA of inter-maturational indices showed significant differences in females but not in males Table (2). Post hoc analysis by t-test showed differences between females and males in CVMS and hand-wrist (P < 0.05) measurements, except for radius union (Ru) Tables (3 and 4). Canine and M2 calcification stages between females and males had no significant differences. The highest canine calcification was achieved at stage H, reached by 185 females (66.30%) at 13.46 ±1.40 years, and by 65 males (45.13%) at 14.39 ±1.51 years. Stage G showed the highest M2 calcification; it was reached by 101 females (36.2%) at 12.64 ±1.55 years and 58 males (40.27%) at 13.17 ±1.50 years Table (5).
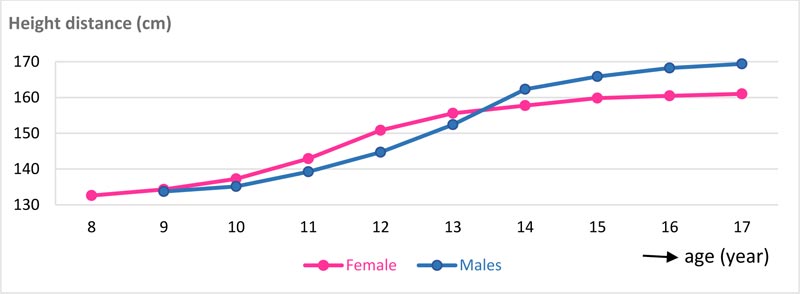
PHV of females was attained at 12 years with 7.89 cm height increases, and in males at 14 years with 9.9 cm height increases. At the end of pubertal growth, males were 8.82 cm taller than females. The velocity and distance curves of body height for females and males can be seen in Figs. (5 and 6). The average age for menarche was 12.20 ±1.1 years; the youngest menarche was 9.6 years, and the oldest was 14.7 years Table (7). The correlation of inter-maturation indices is shown in Table (8). Pubertal growth curves plot for female and male subjects are illustrated in Figs. (7 and 8).
Table 1.
| Females | Males | Difference | t | P value |
| 12.41 ± 2.36 | 12.44 ± 2.35 | 0.03 ± 2.36 | 0.12 | 0.4516 |
| SS | df | MS | F | P value | |
| Females | 4119.9 | 24 | 171.663 | 96.28 | 0.001* |
| Males | 42.6 | 15 | 2.84 | 1.54 | 0.0863 |
| Stage | n | Females | n | Males | Differences (years) | Females and Males | |
| t | P value | ||||||
| 0 | 10 | ‒ | 18 | ‒ | ‒ | ‒ | |
| PP3 | 9 | 9.00 ± 0.00 | 13 | 10.77 ± 0.08 | 1.77 ± 0.08 | 53.56 | 0.0000* |
| MP3 | 15 | 9.47 ± 0.74 | 19 | 11.63 ± 0.11 | 2.16 ± 0.11 | 57.37 | 0.0000* |
| MP5 | 13 | 10.00 ± 1.47 | 11 | 12.08 ± 0.95 | 2.08 ± 1.26 | 4.01 | 0.0003* |
| S | 39 | 10.51 ± 0.82 | 20 | 12.48 ± 1.12 | 1.96 ± 0.93 | 7.64 | 0.0000* |
| DP3cap | 19 | 10.89 ± 0.46 | 8 | 13.00 ± 0.53 | 2.11 ± 0.48 | 10.38 | 0.0000* |
| MP3cap | 14 | 11.36 ± 0.50 | 12 | 13.21 ± 0.58 | 1.86 ± 0.54 | 8.80 | 0.0000* |
| MP5cap | 19 | 12.42 ± 0.69 | 3 | 14.00 ± 0.00 | 1.58 ± 0.66 | 3.87 | 0.0005* |
| DP3u | 26 | 12.64 ± 0.86 | 5 | 14.20 ± 0.84 | 1.56 ± 0.86 | 3.73 | 0.0004* |
| PP3u | 13 | 13.08 ± 1.26 | 6 | 14.50 ± 0.84 | 1.42 ± 1.15 | 2.51 | 0.0112* |
| MP3u | 69 | 14.22 ± 1.22 | 15 | 15.00 ± 1.00 | 0.78 ± 1.19 | 2.31 | 0.0116* |
| Ru | 33 | 16.03 ± 0.81 | 14 | 16.31 ± 0.63 | 0.28 ± 0.76 | 1.14 | 0.1299 |
| Stage | n | Female | n | Males | Differences (years) | Females and Males | |
| t | P value | ||||||
| 0 | 8 | ||||||
| CVMS I | 41 | 9.46 ± 0.95 | 30 | 10.68 ± 0.75 | 1.22 ± 0.87 | 5.83 | 0.0000* |
| CVMS II | 35 | 10.00 ± 0.91 | 25 | 11.67 ± 1.31 | 1.09 ± 1.47 | 5.41 | 0.0000* |
| CVMS III | 72 | 12.07 ± 1.33 | 35 | 12.74 ± 0.01 | 1.23 ± 0.67 | 2.65 | 0.0046* |
| CVMS IV | 74 | 13.46 ± 1.40 | 21 | 14.00 ± 0.89 | 1.31 ± 0.54 | 1.67 | 0.0492* |
| CVMS V | 57 | 15.19 ± 1.46 | 25 | 15.83 ± 0.87 | 1.31 ± 0.64 | 2.04 | 0.0223* |
| 279 | 144 | *significant | |||||
| Tooth Calcification Stage | n | Female | n | Males | Diff | Female and Male | |
| t | P value | ||||||
| C-E | 6 | 8.67 ± 0.52 | 8 | 9.50 ± 0.53 | 0.83 ± 1.23 | 1.25 | 0.1181 |
| C-F | 54 | 9.81 ±1.17 | 51 | 10.31 ± 1.17 | 0.50 ± 8.56 | 0.30 | 0.3818 |
| C-G | 34 | 10.71 ± 1.07 | 20 | 12.70 ± 1.13 | 1.99 ± 6.18 | 1.14 | 0.1294 |
| C-H | 185 | 13.46 ± 1.40 | 65 | 14.39 ± 1.51 | 0.76 ± 24.97 | 0.21 | 0.4161 |
| M2-D | 10 | 8.80 ± 0.92 | 9 | 9.56 ± 1.01 | 0.76 ± 2.84 | 0.58 | 0.2853 |
| M2-E | 29 | 9.59 ± 0.95 | 25 | 9.84 ± 0.80 | 0.25 ± 5.03 | 0.18 | 0.4271 |
| M2-F | 65 | 10.88 ± 1.27 | 25 | 11.12 ± 1.33 | 0.24 ± 10.17 | 0.10 | 0.4597 |
| M2-G | 101 | 12.64 ± 1.55 | 58 | 13.17 ± 1.50 | 0.53 ± 15.50 | 0.21 | 0.4176 |
| M2-H | 74 | 15.05 ± 1.37 | 27 | 15.47 ± 1.07 | 0.41 ± 11.75 | 0.16 | 0.4381 |
| Age (years) |
Female | Male | ||
| n | Average | n | Average | |
| 8 | 5 | 132.60 ± 0.55 | - | - |
| 9 | 32 | 134.30 ± 0.68 | 19 | 133.72 ± 2.59 |
| 10 | 28 | 137.25 ± 1.27 | 21 | 135.13 ± 0.50 |
| 11 | 46 | 142.93 ± 0.77 | 15 | 139.23 ± 2.03 |
| 12 | 33 | 150.82 ± 1.01 | 15 | 144.70 ± 0.86 |
| 13 | 43 | 155.60 ± 2.03 | 26 | 152.41 ± 0.79 |
| 14 | 32 | 157.73 ± 2.79 | 18 | 162.31 ± 3.60 |
| 15 | 22 | 159.82 ± 3.00 | 11 | 165.85 ± 1.11 |
| 16 | 25 | 160.48 ± 1.98 | 13 | 168.23 ± 0.76 |
| 17 | 13 | 160.58 ± 1.73 | 6 | 169.40 ± 0.55 |
| Total | 279 | 144 | ||
| f | mean | max | min |
| 12.41 ± 2.36 | 12.2 ± 1.1 | 14.7 | 9.6 |
| Stage | Females | Males | Guilford scale | ||||
| r2 | t | P value | r2 | t | P value | ||
| Hand-wrist & CVMS | 0.774 | 30.84 | 0.000* | 0.846 | 28.17 | 0.000* | strong |
| Hand-wrist & Canine | 0.593 | 20.23 | 0.000* | 0.624 | 15.20 | 0.000* | moderate |
| Hand-wrist & M2 | 0.624 | 21.23 | 0.000* | 0.593 | 14.53 | 0.000* | moderate |
| CVMS & M2 | 0.533 | 17.52 | 0.000* | 0.608 | 14.93 | 0.000* | moderate |
| Canine & M2 | 0.578 | 19.34 | 0.000* | 0.656 | 16.37 | 0.000* | moderate |
| CVMS & Canine | - | - | - | 0.608 | 15.00 | 0.000* | moderate |
| PHV & Hand-wrist | - | - | - | 0.348 | 4.60 | 0.000* | low |
| PHV & CVMS | - | - | - | 0.314 | 4.25 | 0.000* | low |
| CVMS & Canine | 0.490 | 16.50 | 0.000* | - | - | - | low |
| PHV & Canine | 0.032 | -1.17 | 0.000* | 0.123 | 2.32 | 0.000* | very low |
| PHV & Hand-wrist | 0.048 | -1.41 | 0.000* | - | - | - | very low |
| PHV & CVMS | 0.137 | -2.56 | 0.000* | - | - | - | very low |
| Menarche & Hand-wrist | 0.20 | 1.41 | 0.081 | - | - | - | very low |
| Menarche & CVMS | 0.002 | 0.46 | 0.324 | - | - | - | very low |
| Menarche & PHV | 0.044 | 2.25 | 0.013* | - | - | - | very low |
| Menarche & Canine | 0.078 | 2.95 | 0.002* | - | - | - | very low |
| Menarche & M2 | 0.029 | 1.73 | 0.043* | - | - | - | very low |

4. DISCUSSION
Determining diagnosis and orthodontic treatment for a growing patient concerns the patient’s malocclusion, medical and dental history, social and behavioral evaluation, and also evaluation of physical growth, especially in dental-craniofacial growth. The success of orthodontic prevention or early interceptive of maxillary-mandibular disharmony with orthodontic functional appliances, tooth extraction, orthognathic surgery, or removal of orthodontics retention device are some cases that require accurate interpretation of dental-craniofacial growth and development. Growth modification treatment will fail if the treatment is done beyond the peak of the adolescent growth spurt [1, 6, 7, 15, 16].
Dental-craniofacial growth during the pubertal period is under genetic and hormonal control. Still, there are some factors that are influenced, such as race, socio-economic factors, nutrition, health status, and secular trends. The secular trend factor causes the present generation to experience earlier pubertal attainment [17-23]. Research showed that a number of dentofacial dimensions continued to change with respect to the amount and direction throughout adulthood, and these changes may be race-specific. Race was one of the factors that influenced pubertal growth patterns. Nadler (1998) suggests the need to conduct research on each population of different races in order to obtain growth data that can be used appropriately for these racial populations [19, 24].
Studies have shown that most patients seek orthodontic treatment at the period of pubertal growth, and to maximize the success of orthodontic treatment, each patient must be evaluated for individual growth patterns [25-27]. The timing and pattern of pubertal growth changed over time and varied widely between different populations [13, 28]. Studies show that from the beginning to the peak of the pubertal growth, spurt lasts for approximately 2 to 3 years. Therefore this short period of time must be identified and utilized properly in the treatment of maxillary-mandibular disharmony [7]. Otherwise, orthognathic surgery is ideally performed when the pubertal growth has been completed; therefore, identification of early, peak, and late pubertal growth is important in orthodontic treatment [1].
In this study, pubertal growth stages were analyzed using hand-wrist radiograph, CVMS from lateral cephalogram, Canine and M2 calcification stages at a panoramic radiograph, PVH, and menarche. The basis of using the hand-wrist maturation index, the cervical vertebra index, and dental calcification index during the pubertal growth period was that there were series of maturation changes that could be observed radiographically. The order of the changes was consistent for each person, but the timing varied individually. Therefore the description of changes in bone and teeth can be used as a tool to determine the maturation stage in the same population [10, 14, 29, 30]. Skeletal maturity can be determined by hand-wrist radiographs, is related to facial growth, and has a significant correlation with changes in body height and facial growth [31-33]. Hand-wrist maturation index is a complete indicator of maturity index and has become the gold standard for determining the stage of pubertal growth [14, 34-37]. The validity of the hand-wrist maturation index to assess pubertal growth has been recognized by various studies. Studies show a high correlation between the hand-wrist maturation stage with other maturation indicators such as cervical vertebrae maturation, body height (PHV), and facial growth [13, 14, 38-40]. Studies also show significant differences among the indices for females (P < 0.01) but not for males Table (2). At the beginning of pubertal growth, females were 1.77 years earlier than males (P < 0.001), and at the end of pubertal growth, females were 0.28 years earlier than males Table (3). The total length of hand-wrist maturation required 7.03 years in females and 5.54 years in males. Other studies involving hand-wrist measurements showed that females required 6.29 years and males required 6.13 years, while different researchers found that it lasts 6.13 years in females and 6.36 years in males. These differences can be attributed to sampling size, methods, race, and ethnicity [3, 13, 33].
At present, cervical vertebral maturation index was recommended as a pubertal growth indicator instead of using hand-wrist maturation [9, 29]. Maturation of cervical vertebrae on lateral cephalogram can be used to evaluate the stage of pubertal growth at the same time for cephalometric analysis and does not require additional radiation for a hand-wrist radiograph [15]. Studies have reported that the best morphological parameters for predicting pubertal growth using cervical vertebrae are based on the changes of the bodies and the concavity at the lower of the second, third, and fourth body of cervical vertebrae [30, 41-44]. A study shows that morphometric and quantitative changes of cervical vertebral are consistent in the CVMS method [45]. Cervical vertebral and hand-wrist maturation indicators are valid methods for discriminating between subjects who have not reached puberty, who are undergoing pubertal growth, and who have completed pubertal growth. CVM index is also a reproducible and reliable method [33, 46].
The results of this study showed that CVMS I to V were significantly different between females and males, as females were found to mature earlier than males Table (4). In females, CVMS1-CVMS2 was at acceleration period, and CVMS III was in between PHV and menarche. CVMS V was at a deceleration of pubertal growth and 0.84 years before radius union of the hand-wrist index. In males, CVMSI-CVMS II was at an acceleration of pubertal growth, CVMS III was almost at peak pubertal growth, and CVMSIV-V was at a deceleration period of pubertal growth. Pubertal growth with CVMS in females required 5.73 years, while in males, it required 5.15 years, consistent with the results of hand-wrist maturation measurements showing females take a longer period than males. There was a high correlation between CVMS and hand-wrist maturation, 0.846 for males and 0.774 for females Table (8). This indicated that cervical vertebrae maturation indicators could be used to identify pubertal growth stages as a substitute for hand-wrist maturation.
Dental calcification is one of the physiological maturation indicators for determining the stage of pubertal growth. There are two types of dental maturation indicators: the first is tooth eruption, and the second is the degree of tooth calcification [47]. The emergence of the tooth against the gums can be influenced by many factors such as the presence of ankylosis, persistence of primary teeth, impact, or obstruction by crowded teeth [48, 49]. The level of tooth calcification to determine the stage of pubertal growth is more precise than tooth eruption. Dental calcification has a positive and significant correlation with the hand-wrist maturation index [47, 50-55]. Other researchers show that there was a low correlation between dental calcification with other physiological indexes and the degree of this correlation was different for each race [51]. Determination of the level of dental calcification at the pubertal growth stage can be done by determining the largest percentage of tooth types with the greatest calcification rate. It is known that homologous tooth calcification is symmetrical; therefore if there is a tooth missing in one jaw, the determination of the calcification level can be replaced by the same tooth in the other jaw [10, 48]. Canines and M2 calcification stages have been extensively studied to determine their relationship with hand-wrist and cervical vertebrae maturation stages [17, 56].
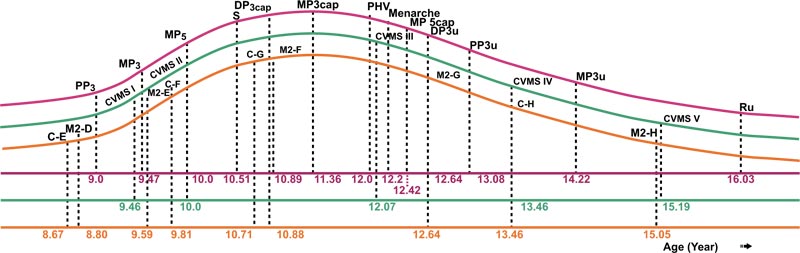
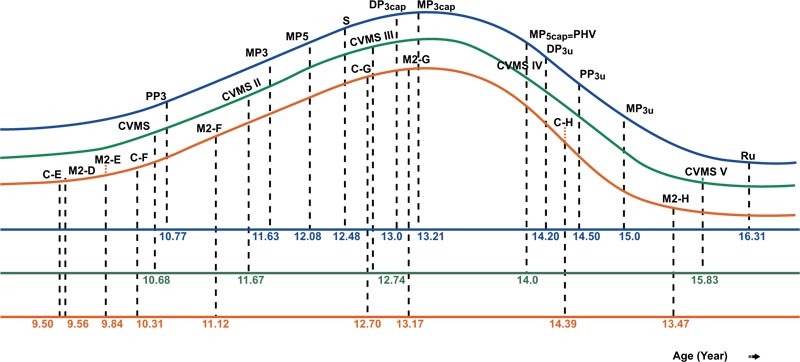
The result of this study, canine calcification stages E to H and M2 stage D to H were used, and there were no significant differences between females and males Table (5). According to the results of our study, in females, canine stages E, F, and G and stages D, E, and F of M2 were found at the acceleration stage, while canine stages H and M2 stage G, H were found at the deceleration of pubertal growth plot Fig. (7). In males, canine stages E, F, and G and M2 stages D, E, F, and G were seen at the acceleration of pubertal growth, while canine and M2 stage H were seen at the deceleration of the pubertal growth plot Fig. (8) and dental calcification in females showed a more advanced trend of than male. This result is in contrast with dental calcification in Thai as well as Italian populations, in which dental calcification in males occurred earlier than in females. There was a moderately high correlation between canine and M2 calcification with skeletal maturation, but racial variations have been noted [17, 47, 57]. A study by Lopes et al. showed that stages D, E for females and stages E,F for males served as a simple tool indicating the acceleration of growth period. Stage F or G for females and stage G for males indicated a high rate of decelerating growth period [58].
The calcification stages of the M2 provide reliable diagnostic data for identifying the pubertal growth spurt, with the highest correlation found in M2 (r = 0.725) and the lowest correlation in canines (r = 0.463, p < 0.001) [55]. In our study, for both females and males, there were moderate correlations between Canines and M2, as well as with hand-wrist and CVMS. Based on these results, Canine and M2 calcification stages can be used for the identification of pubertal growth on panoramic photographs Table (8).
One of the characteristics during the pubertal growth period is a marked increase in the body height. Before pre-pubertal period, the increase in body height is slow, and entering the pubertal period, there is a rapid increase in body height which is called an accelerated body height. The maximum increase in body height during puberty is called the peak height velocity (PHV). Research showed that there was a correlation between peak height growth PHV with skeletal maturation indicators such as the appearance of sesamoid bone adductors, menarche, and tooth maturation [17, 51, 59, 60].
Other studies show that PHV for females was at 12.1 years with 9.8 cm/year and for males at 13.7 years (11.3 cm/year) [51]. The research by Mellion et al. found that PHV occurred at ages 12 and 14 years only for males, while in females, it occurred 6 months to 1 year later from 10-12 years [61]. In this study, PHV was still in the same age range as other studies but with different body heights. In females, PHV occurred at 12 years of age, with increases of 7.89 cm to reach 150.82 cm and approximately 93.92% of final body height, whereas, in males, PHV occurred at 14 years of age, with increases of 9.9 cm to reach 162.31 cm and approximately 95.81% of final body height (Table 6, Figs. 5 and 6). In longitudinal studies, PHV in females was achieved one year before menarche, with 90% of final height [52]. In this study, PHV in females was 0.2 years before menarche, while in males, it occurred simultaneously with the stages of MP5cap and CVMS IV Figs. (7 and 8). The lowest correlation with other physiological indices for both females and males was PHV with the canine calcification stage Table (8).
Lin et al. (2006) claimed that children with faster skeletal growth tend to have a taller height than their peers. On the contrary, children with slow skeletal growth tend to have a shorter height than their group members [62]. The research by Ranjitkar et al. (2006) on body height and skeletal maturation of children and young adults in Australia showed a close correlation between height and skeletal maturation [63, 64].
The close correlation between body height growth and maturation of the hand-wrist bones is due to the fact that they both originate from the same mesodermal system where growth is regulated by the secretion of pituitary hormones and gonadal hormones. These two hormones affect epiphytic ossification of the cartilage and produce growth in long bones [13, 34]. Although body height data can only be used through a series of measurements, based on this study, it can be used as a reference that the peak height growth in females occurred at 12-13 years, and in males at 13-14 years. After PHV was achieved, the increase in height by 1 cm/year indicated that the adolescent growth is reaching its end [52].
Menstruation is a natural phenomenon for women during their reproductive years [65]. Information about menstruation is mostly obtained from mothers or school teachers [66]. Menarche is a landmark of physiological maturation and an indicator of the pubertal event in females that is easy to identify via interviews [67]. There are three methods for assessing menarche age: recall or retrospective, prospective methods, and status quo. In the recall method, data about menarche are obtained by recalling their age at first menses. The prospective method is longitudinal; it follows pre-menarche girls regularly until menarche, and they are asked at every visit if they have experienced menarche. Such studies are needed to be followed up regularly, ideally every 3 months, and subjects are asked at each visit whether they have begun to menstruate. In the status quo method, menarche is determined by interviewing a female subject and questioning about her experience at the time of assessment. The prospective method is more accurate, but most studies on menarche age were performed using the status quo or the recall methods [54]. The self-reported, recall, or retrospective method of menarche by interview is reliable and valid for epidemiologic studies [12]. Menarche is affected by many factors such as genetics, environmental conditions, nutrition, race, physical activity, urban or rural residence, health status, psychological factors, body mass index (BMI), and socio-economic status. This study only used data obtained from participants of Deutero-Malay race, urban residence, and known health status. A study done by Eastel found that the estrogen levels at menarche are associated with turnover of bone markers and affect the closure of epiphyseal growth plates as well as reduce periosteal apposition and endosteal resorption [67].
The average age of menarche was reported to be 12 years 8 months in Caucasian girls, 12 years 2 months in Black girls, 11.7 years in Taiwanese, and 12.6 years in Korean [68-70]. A national survey in Indonesia showed that the average menarche age was 12.96 years [71] In our study, the recall method was used, and the average age of menarche was 12.2 years (Table 7). This result was earlier than other studies except for the Taiwanese study. In most cases, menarche can occur after, nearly coincide, precede, or occur one year after PHV or one year after the MP3cap stage [54]. Menarche age varies and depends on the interaction between genetic and environmental factors. In our study, menarche occurred 0.2 years after PHV, 0.84 years after MP3cap stage, and 0.13 years after the CVMS3 stage Figs. (7, 8). This indicates that after PHV, MP3cap, and CVMS3, Indonesian Deutero-Malay subjects experienced menarche. There was a correlation between all the parameters, but the lower correlations in this study were different between females and males. The very low correlation in females was between menarche CVMS, while in males, it was between PHV with canine (Table 8).
Based on this study, five physiological maturation indices were plotted on the pubertal growth curve of females, which tended to skew to the left, while in males, the curve tended to skew to the right. This indicates that orthodontic treatment requires an active period of pubertal growth, such as the treatment of growth modification using the orthodontic functional appliance. Here, females have a shorter working time than males, while for orthognathic surgery using the hand-wrist indicator, the ideal time for a female is 16.03 years, and for males, it is 16.31 years. When using CVMS indicator, females were at 15.19 years and males were at 15.83; these were earlier than the results obtained using hand-wrist maturation indexes. Due to the numerous factors affecting pubertal growth, the results of this study could be different from other studies. There are a few limitations of our study. Indonesia has three major racial groups, namely Deutero-Malay, Proto-Malay, and Papua Melanesia. The samples of this study were obtained only from the Deutero-Malay racial group, which is the largest race group in Indonesia. Apart from that, the subjects of this study were patients originating from the urban city of Bandung, and may not represent the socio-economic demographics of the entire population of the Deutero-Malay race in Indonesia. The other limitation of this study was that we were unable to control the nutrition and systemic illnesses (unless based on anamnesis).
CONCLUSIONS
This study assessed the stages of pubertal growth using hand-wrist, CVMS maturation index, PHV, Canine and M2 calcification stages, and menarche.
- There were significant differences between hand-wrist, CVMS maturation, Canine, M2 calcification, PHV, and menarche in females (P < 0.001), but no significant differences between hand-wrist, CVMS maturation, Canine, M2 calcification, and PHV in males.
- PHV in females was at 11-12 years with 7.89 cm increases of body height per year while in males, it was at 13-14 years with 9.9 cm increases per year.
- Average menarche age was at 12.2 years, with the youngest being 9.6 years and the oldest being 14.7 years
- There was a high correlation between hand-wrist and CVMS maturation stages in females and males. The lowest correlation in males was PHV with canine, and in females, menarche with CVMS.
- The pubertal growth curve for the female subjects tended to skew to the left, thus demonstrating that the time from the beginning to the peak of pubertal growth is shorter than that from the peak to the end of pubertal growth. In males, it tended to skew to the right, indicating that the time from the beginning to the peak of pubertal growth is longer than that from the peak to the end of pubertal growth.
ETHICS APPROVAL AND CONSENT TO PARTICIPATE
This study was approved by the Universitas Padjadjaran, Indonesia (Protocol No.398/UN6.8.17/TU/2017).
HUMAN AND ANIMAL RIGHTS
No animals were used in this research. All human research procedures followed were in accordance with the ethical standards of the committee responsible for human experimentation (institutional and national), and with the Helsinki Declaration of 1975, as revised in 2013.
CONSENT FOR PUBLICATION
Written informed consent was obtained prior to the study.
AVAILABILITY OF DATA AND MATERIALS
The data sets analyzed during the current study are available from the corresponding author [E.M] upon reasonable request.
FUNDING
Academic Leadership Grant (ALG)Universitas Padjadjaran Indonesia ( Grant No. 2948/UN6.F/LT/2019).
CONFLICT OF INTEREST
The authors declare no conflict of interest, financial or otherwise.
ACKNOWLEDGEMENTS
The researchers are grateful to acknowledge Universitas Padjadjaran for research facilities.

