All published articles of this journal are available on ScienceDirect.

The Association between Reported Dental Pain Symptoms and Increased BMI in Indonesia: Evidence From The Indonesian Family Life Survey
Abstract
Background:
Overweight/obesity remains one of the most important health issues. Not only due to the current health consequences but also because of its long-term effect. One of the most common health problems experienced by an individual with overweight/obesity is dental problem, which can be reflected from dental pain being complained.
Objective:
The objective of the current study was to evaluate the association of overweight/obesity to be the predictor of the occurrence of dental pain.
Methods:
Data from the Indonesian Family Life Survey (IFLS) from five consecutive survey waves (1993, 1997, 2000, 2007 and 2014) that involved more than 30.000 participants and their offsprings that were grouped into three different age categories (0-4.9 years old; 5-19.9 years old; and 20-49.9 years old) were gathered and analyzed for Odds Ratio (OR) and Confidence Interval (CI). Trends of childhood overweight/obesity, the occurrence of dental pain, as well as the likelihood of individuals with childhood overweight/obesity to develop dental pain were analyzed by using STATA Data Analysis and Statistical Software version 13.
Results:
The results of the current study revealed that all age groups exhibited an increase in numbers when it comes to the prevalence of overweight/obesity from the first wave (in 1993) up to the latest wave (in 2014). It was also revealed that those who were in the 0-4.9 years old age group, were those who were more likely to develop dental pain (OR:1.12; 95% CI: 0.84-1.5; p:0.44).
Conclusion:
Despite the wave to wave variation, overweight/obesity has the potential to be associated with future dental problems, with dental pain in particular.
1. INTRODUCTION
Overweight/ obesity is an important health issue that needs to be managed comprehensively by all concerned parties due to its long term and detrimental effect [1, 2]. According to the World Health Organization (WHO), a raised body mass index (BMI) into the extent of overweight/obesity, is a major risk factor for non-communicable diseases such as cardiovascular disease (which was the leading cause of death in 2012), diabetes, musculoskeletal disorders, and certain types of cancer [3]. In 2016, more than 1.9 billion adults aged 18 years old and above were overweight, of which 650 million adults (out of the 1.9 billion) were obese [3]. As for some developing countries, the growing rate of obesity has now doubled in numbers [4]. A recent epidemiological study about childhood obesity in the coastal province of China showed that the obesity rate has increased from 12.37% (in 2005) to 18.16% (in 2014) in boys, and from 4.30% (in 2005) to 6.58% (in 2014) in girls. The growing rate for childhood overweight was found to be higher [5]. In Indonesia, the prevalence of obesity in all age groups was also reported to be rising in numbers [6].
Several factors are considered to be the cause of obesity, including genetic, physical activity, as well as dietary intake [7, 8]. It is important to note that one of the risk factors for overweight/obesity such as diet and fat content of milk is also considered as risk factors for the prevalence of dental caries [9-11] which is the most common dental problems amongst children [12-14], adolescents [15], as well as adults [16, 17]. Dental caries with dental pain being the main complaint [18, 19], has been associated with overweight/obesity in many previous studies [20-24]. Aside from dental caries, there are other oral conditions as well as diseases that have been positively associated with increased BMI, namely periodontal disease(s), teeth undergoing orthodontic treatment, and impacted teeth [25-27]. Interestingly, several studies revealed contradictory results from the above mentioned and stated that increased BMI was negatively correlated with a particular oral condition(s), including dental caries [28, 29]. This has brought the association between oral diseases and BMI remains debatable.
Even though numerous studies have been conducted to investigate the association between BMI and a particular oral or dental condition, very few studies have evaluated the association between BMI and dental pain, which is the most common dental problem. Dental pain, like any other type of pain occurring in the human body, has an impact on a person’s quality of life [30, 31] as dental pain symptoms affect eating [32] and other jaw functional activities [33, 34]. Considering the medical impact of overweight/obesity as well as dental pain symptoms, the first aim of the current study was to evaluate the current trend of overweight/obesity as well as dental pain symptoms, whilst the second aim was to evaluate the association between overweight/obesity and the occurrence of dental pain.
2. MATERIALS AND METHODS
2.1. Indonesian Family Life Survey (IFLS)
2.1.1. Data Collection
IFLS is one of the nationally-representative surveys conducted in Indonesia. Starting in the year 1993 (wave 1), this survey sampled 13 out of the 27 provinces in Indonesia with more than 30.000 participants involved. The next waves (that involved two generations) were conducted in years 1997, 2000, 2007, and 2014, aiming to trace the same families/individuals and their off-springs from wave 1 (1993). More complete and detailed information regarding the sampling method and sample collection have been published in previous papers [35-38]. In summary, the survey was conducted in 1993 using stratified random sampling to find the respondent. The survey itself comprised of questionnaires and followed by anthropometric measurements. The methods used in each following wave were similar to the one in 1993.
The data collected in the questionnaires were recorded in seven books which covered different ranges of information from individual-level information (age, sex, relationship with household head, anthropometric measures, etc.), household-level information (location of the house, economic and non-economic measures, etc.) as well as community-level information such as facilities in the area. In regards to dental pain questions (also known as toothache), this particular question was asked under the “Acute Morbidity” section. Participants were asked whether they have or had experienced toothache for the last four weeks (one question). All health-related measurements were performed by trained nurses. All of the data from the 5 waves have been publicly released. In this research, we combined all the related information from different books in each wave. One of the strengths of the IFLS is its high re-contact rate (the number of the same participants being re-contacted for the subsequent wave), as every subsequent wave can re-contact more than 90% of households and individuals from wave 1 [35-37].
2.1.2. Anthropometric Measurements
The height of participants was measured by trained nurses using Shorr measuring boards Model 420 and weight was measured using Seca Floor Model 770 scales (SECA, Los Angeles, CA, USA), with digital readout [35]. The age of children and adolescents was calculated based on dates of anthropometry examinations and birth dates. This is important for us to be able to express their body mass index (BMI; weight/ (height in m)2) as z scores using the LMS Growth program [38,39]. For children under five, we calculated their BMI z scores against the WHO Child Growth Standard [40], and for children and adolescents aged 5 - 19 years, we used the WHO Growth Reference [41]. We further cleaned the dataset by identifying and discarding biologically implausible values (discard rate < 5%) using cutoff points from the WHO Anthro software as the following: weight-for-age z score (WAZ)<-6 and WAZ>5, height-for-age z score (HAZ)<-6 and HAZ>6, BMI z score (BMIZ)<- 5 and BMIZ>5 [42]. Overweight/ obesity was defined as BMIZ>+1 according to the WHO definitions. In under-five children, we also included the ‘at-risk’ category as suggested by de Onis et al. which defined as BMIZ>+1 [43].
2.1.3. Statistical Analysis
All analyses were performed using STATA Data Analysis and Statistical Software version 13 [44]. We conducted frequency tabulations to describe distributions. The results are presented as numbers and prevalence in percent. The odds ratio of overweight/ obese children having toothache within the last four weeks was computed by dividing the probability of having toothache symptoms in overweight/ obese children to the probability of non-overweight (healthy weight and underweight combined) children. Significance level (p-value) was set at < 0.05.
3. RESULTS
We reported an increasing number of participants in each wave (Table 1). In the 0 to 4.9 years age group, there were more male participants in every wave as compared to female participants. On the contrary, in the 20 to 49.9 years age group, there were more female participants in every wave as compared to their male counterparts. In the 5 to 19.9 years age group, we found similar numbers of female and male participants in the first three waves and more male participants in the latest two waves.
In children aged 0 to 4.9 years, there was a decrease in height between the years 1993 to 2000 (7 years range), followed by an increase in the year 2007 and 2014. There was a relatively stable mean weight between years 1993, 1997, and 2000, followed by an increase in the year 2007 and 2014. The mean BMI is increasing from wave 1 (1993) to wave 5 (2014). In the 5 to 19.9 years age group, there was a relatively similar mean height from wave 1 to wave 4, followed by an increase in mean height in wave 5. The mean weight and BMI are quite similar in the first three waves and an increase in waves 4 and 5. In adults aged 20 to 49.9 years, we have an increase in height, weight, and BMI from the year 1993 to 2014.
The current study analyzed the data based on three different age groups and five waves. The first analysis revealed that there was an increase in trends when it comes to being overweight (Table 2). For example, for the 0 to 4.9 years old (children) age group, despite the growing number of those who considered being healthily weighted, yet, there was a growing percentage (18.10%, 2014) of those who were in the overweight category. When all three categories were compared, the highest growth percentage for the overweight category occurred in the 20 to 49.9 years old (adults) age group, whereas the percentage increased as much as 18.59% (15.93% in 1993 up to 34.52% in 2014).
| Characteristics | Wave 1 (1993) | Wave 2 (1997) | Wave 3 (2000) | Wave 4 (2007) | Wave 5 (2014) |
|---|---|---|---|---|---|
| Age | |||||
| 0 to 4.9 years | 1,644 | 2,432 | 3,850 | 4,481 | 5,386 |
| 5 to 19.9 years | 3,667 | 5,851 | 7,347 | 7,866 | 10,116 |
| 20 to 49.9 years | 8,571 | 11,252 | 18,791 | 19,531 | 21,773 |
| Sex (number [%]) | |||||
| 0 to 4.9 years | |||||
| Male | 874 (53.16%) | 1,223 (50.29%) | 1,967 (51.09%) | 2,299 (51.31%) | 2,811 (52.19%) |
| Female | 770 (46.84%) | 1,209 (49.71%) | 1,883 (48.91%) | 2,182 (48.69%) | 2,575 (47.91%) |
| 5 to 19.9 years | |||||
| Male | 1,829 (49.88%) | 2,983 (50.97%) | 3,737 (50.86%) | 4,019 (51.09%) | 5,196 (51.36%) |
| Female | 1,838 (50.12%) | 2868 (49.03%) | 3,610 (49.14%) | 3,847 (48.91%) | 4,920 (48.64%) |
| 20 to 49.9 years | |||||
| Male | 3715 (43.34%) | 4,896 (43.51%) | 8,905 (47.39%) | 9,253 (47.38%) | 10,198 (46.84%) |
| Female | 4856 (56.66%) | 6,356 (56.49%) | 9,886 (52.61%) | 10,278 (52.62%) | 11,575 (53.16%) |
| Anthropometry (mean [95% CI]) | |||||
| 0 to 4.9 years | |||||
| Mean height | 83.56 (82.96-84.17) | 82.88 (82.32-83.44) | 82.33 (81.88-82.93) | 83.53 (83.12-83.95) | 83.58 (83.20-83.96) |
| Mean weight | 10.87 (10.72-11.01) | 10.97 (10.83-11.12) | 10.81 (10.70-10.92) | 11.23 (11.13-11.34) | 11.27 (11.17-11.37) |
| Mean BMI | 15.38 (15.29-15.47) | 15.85 (15.70-15.99) | 15.66 (15.60-15.73) | 15.85 (15.78-15.91) | 15.86 (15.80-15.93) |
| 5 to 19.9 years | |||||
| Mean height | 127.40 (126.89-127.91) | 127.43 (127.00-127.86) | 127.22 (126.85-127.59) | 127.83 (127.47-128.20) | 129.76 (129.43-130.08) |
| Mean weight | 26.82 (26.49-27.16) | 26.97 (26.71-27.23) | 26.66 (26.43-26.90) | 27.66 (27.41-27.91) | 29.25 (29.01-29.48) |
| Mean BMI | 15.96 (15.86-16.07) | 15.97 (15.91-16.04) | 15.85 (15.80-15.91) | 16.28 (16.21-16.36) | 16.65 (16.58-16.71) |
| 20 to 49.9 years | |||||
| Mean height | 154.75 (154.58-154.92) | 155.29 (155.14-155.44) | 156.41 (156.29-156.53) | 156.21 (156.06-156.36) | 157.27 (157.15-157.38) |
| Mean weight | 52.25 (52.05-52.44) | 53.02 (52.84-53.20) | 53.72 (53.58-53.86) | 55.91 (55.75-56.06) | 58.61 (58.45-58.77) |
| Mean BMI | 21.80 (21.72-21.89) | 21.96 (21.90-22.03) | 21.96 (21.90-22.02) | 23.48 (23.32-23.65) | 23.70 (23.64-23.76) |
| Category | Wave 1 (1993) | Wave 2 (1997) | Wave 3 (2000) | Wave 4 (2007) | Wave 5 (2014) |
|---|---|---|---|---|---|
| 0 to 4.9 years | |||||
| Underweight | 136 (8.27%) | 234 (9.62%) | 326 (8.47%) | 383 (8.55%) | 404 (7.50%) |
| Healthy weight | 1,319 (80.23%) | 1,782 (73.27%) | 2,904 (75.43%) | 3,166 (70.65%) | 4,007 (74.40%) |
| Overweight | 189 (11.50%) | 416 (17.11%) | 620 (16.10%) | 932 (20.80%) | 975 (18.10%) |
| 5 to 19.9 years | |||||
| Underweight | 1,620 (44.18%) | 656 (11.21%) | 835 (11.37%) | 836 (10.63%) | 913 (9.03%) |
| Healthy weight | 1,999 (54.51%) | 4,847 (82.84%) | 6,092 (82.92%) | 6,207 (78.91%) | 7,746 (76.57%) |
| Overweight | 48 (1.31%) | 348 (8.95%) | 420 (5.72%) | 823 (10.46%) | 1,457 (14.40%) |
| 20 to 49.9 years | |||||
| Underweight | 1,114 (13.0%) | 1,407 (12.50%) | 2,591 (13.79%) | 2,175 (11.14%) | 1,978 (9.08%) |
| Healthy weight | 6,092 (71.08%) | 7,922 (70.41%) | 12,889 (68.59%) | 12,322 (63.09%) | 12,279 (56.40) |
| Overweight | 1,365 (15.93%) | 1,923 (17.09%) | 3,311 (17.62%) | 5,034 (25.77%) | 7,516 (34.52%) |
The next analysis performed was on those in every age group that complained about dental pain in the last four weeks of the survey period (Table 3). In line with the increasing trend of being overweight, this part of the analysis showed that, as the year progressed, more people complained about experiencing dental pain. There was a decrease in percentage in all age groups in the fourth wave (2007), but the percentage went right back up for all age categories in 2014, with the highest percentage exhibited by those in the children and adolescents (5 to 19.9 years old) age group.
When the two variables were associated (Table 4), it showed that the 5 to 19.9 years old (children adolescent) age group had the highest percentage of individuals complaining of dental pain as compared to those who did not by the fifth wave of the survey period (the year 2014). In regard to the complaint of dental pain, it is interesting to note that in 2007, every age category showed a decrease as compared to the previous wave (the year 2000), and has an increase in percentage in the fifth wave (the year 2014).
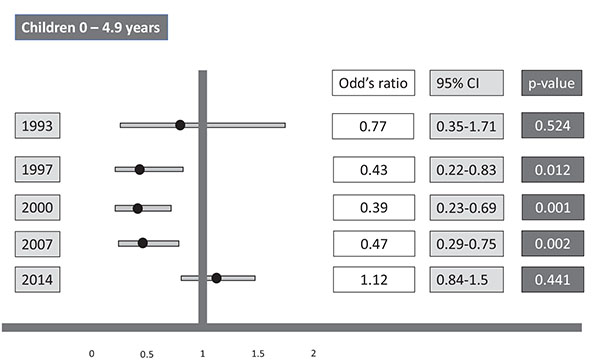
The next analysis of the current study evaluated the odds ratio for overweight children to experience dental pain as compared to non-overweight children in 0 - 4.9 years old (Children) age group (Fig. 1). Despite the inconsistency of the odds ratios throughout the five survey periods, the latest survey (wave 5, the year 2014) revealed that children with the overweight problem had 1.12 times the odds of having dental pain as compared to non-overweight children (95% CI: 0.84-15, p = 0.44). It was also revealed that the lowest odds ratio exhibited by the participants was the one in the year 2000, whereas participants “only” had 0.39 times the odds of having dental pain (95% CI=0.23 - 0.69, p = 0.001).
| Category | Wave 1 (1993) | Wave 2 (1997) | Wave 3 (2000) | Wave 4 (2007) | Wave 5 (2014) |
|---|---|---|---|---|---|
| 0 to 4.9 years | 76 (4.62%) | 119 (4.89%) | 1.91 (4.96%) | 178 (3.97%) | 309 (5.74%) |
| 5 to 19.9 years | 332 (9.05%) | 800 (13.67%) | 1,026 (13.96%) | 967 (12.29%) | 1,793 (17.72%) |
| 20 to 49.9 years | 907 (10.58%) | 1,673 (14.87%) | 2,539 (13.51%) | 2,280 (11.67%) | 3,118 (14.32%) |
| Category | Wave 1 (1993) | Wave 2 (1997) | Wave 3 (2000) | Wave 4 (2007) | Wave 5 (2014) | |||||
|---|---|---|---|---|---|---|---|---|---|---|
| Toothache symptoms | Toothache symptoms | Toothache symptoms | Toothache symptoms | Toothache symptoms | ||||||
| Yes | No | Yes | No | Yes | No | Yes | No | Yes | No | |
| 0 to 4.9 years | ||||||||||
| Underweight | 7 | 129 | 12 | 222 | 12 | 314 | 13 | 370 | 29 | 375 |
| Healthy weight | 62 | 1,257 | 97 | 1,685 | 165 | 2,739 | 145 | 3,021 | 219 | 3,788 |
| Overweight | 7 | 182 | 10 | 406 | 14 | 606 | 20 | 912 | 61 | 914 |
| 5 to 19.9 years | ||||||||||
| Underweight | 149 | 1,471 | 96 | 560 | 120 | 715 | 102 | 734 | 200 | 713 |
| Healthy weight | 178 | 1,821 | 664 | 4,183 | 855 | 5,237 | 784 | 5,423 | 1,419 | 6,327 |
| Overweight | 5 | 43 | 40 | 308 | 51 | 369 | 81 | 742 | 174 | 1,283 |
| 20 to 49.9 years | ||||||||||
| Underweight | 130 | 984 | 208 | 1,199 | 368 | 2,223 | 282 | 1,893 | 297 | 1,681 |
| Healthy weight | 651 | 5,441 | 1,187 | 6,735 | 1,746 | 11,143 | 1,399 | 10,923 | 1,728 | 10,551 |
| Overweight | 126 | 1,239 | 278 | 1,645 | 425 | 2,886 | 599 | 4,435 | 1,093 | 6,423 |
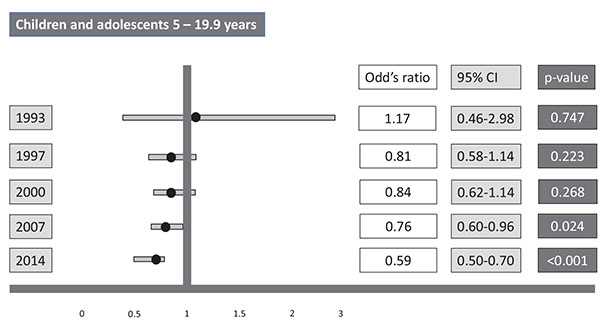
Fig. (2) exhibited the odds ratio of individuals who were overweight and belonged to the 5 to 19.9 years old (Children and adolescents) age group from experiencing dental pain as compared to their non-overweight counterparts. In this particular group, the odds ratio of having dental pain is getting smaller as time progressed (from 1.17; 95% CI: 0.46-2.98; p = 0.75 to 0.59; 95% CI: 0.50 - 0.70; p < 0.001). There was an increase in the odds between wave 2 and wave 3, yet the overall trends in this particular group were to decrease.
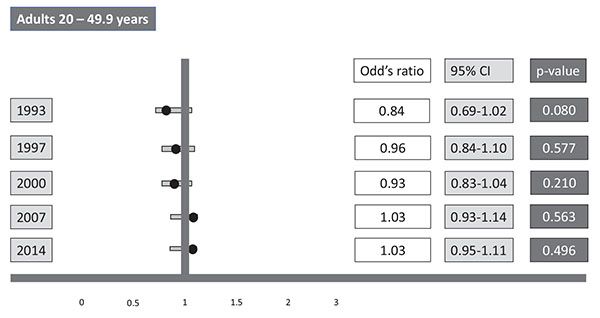
The last analysis of the current study was the odds ratio for those who were in 20 to 49.9 years old (Adult) age group and overweight, having dental pain as compared to individuals who were in this age group without being overweight (Fig. 3). In contrast with the previous group, this particular group showed an increase in its overall trends. If the odds ratio for individuals in this category was 0.84 (95% CI: 0.69-1.02; p = 0.08) in the first wave, it increased up to 1.03 (95% CI: 0.95-1.11; p = 0.50) in the last wave, showing an increase as much as 0.19 in odds ratio.
4. DISCUSSION
In regard to the results obtained in the current study, previous studies that evaluated the correlation between dental problems and nutritional status usually exhibited the correlation between dental caries and underweight conditions [45-47]. There is a lack of attention on the correlation between the most complained dental problem, which is dental pain [18, 19, 48, 49], and nutritional status. The current study evaluated the association between dental pain and overweight/obesity status in the Indonesian sample to analyze whether this particular nutritional condition can be used as a predictor for future dental problems. To do this, the first analysis performed aimed at observing the trend of overweight/obesity in the Indonesian sample. The analysis revealed how overweight/obesity seemed to increase as time progressed. This particular result is in line with a review study conducted by Reilly et al. (2012), stating that the prevalence of obesity in all age categories tends to increase as time progresses [50]. Another study conducted by Wang et al. (2008) in the United States also revealed the increasing trend of obesity amongst the population [51].
Several reasons might act as the cause of this phenomenon, such as environmental factors, lifestyle, cultural environment, eating habits, and genetics [7, 8]. An analysis of the prevalence of dental pain also showed an increasing trend as time progressed. Our literature study found no record of a cohort study that recorded the prevalence of dental pain over time. Yet, our literature study recorded several previous studies that recorded the high prevalence of dental pain as well as related factors. Most of these studies correlated the high prevalence of dental pain to low socio-economic status [52-54], yet, a study by Escoffié-Ramirez et al. (2017) provided a rather interesting result, whereas their study correlated high prevalence of dental pain with higher economic status [55]. This particular result fits the first part of the result of our study, of which the increasing trend of overweight/obesity was correlated with higher monthly family income [56].
Our study also revealed the association between overweight/obesity and the occurrence of dental pain, whereas overweight/obese children (aged 0 to 4.9 years old) had 1.12 the odds of experiencing dental pain as compared to their counterparts. A study by Lemes et al. (2015) that was conducted on the 2 to the 4-year-old group of children revealed that one of the factors that were significantly related to the occurrence of dental pain was the consumption level of artificial powder juice containing sugar [57]. Even though the type of diet was not evaluated in the current study, yet, the result revealed by Lemes et al. (2015) in their study might have provided us with the evidence of how this particular type of childhood diet might be one of the reasons that children who are overweight/obese have bigger odds on having dental pain symptoms. As previous studies have indicated how sugary beverages were significantly associated with overweight/obesity [58-60] and the increased prevalence of dental caries [61-63], which is the main cause of dental pain [64, 65].
CONCLUSION
To conclude, despite the age-related variation, overweight/obesity has the potential to be the predictor for the occurrence of dental problems with dental pain symptoms in particular.
ETHICS APPROVAL AND CONSENT TO PARTICIPATE
Not applicable.
HUMAN AND ANIMAL RIGHTS
No animals/humans were used for studies that are the basis of this research.
CONSENT FOR PUBLICATION
Not applicable.
AVAILABILITY OF DATA AND MATERIALS
The data supporting the findings of the article are available at the RAND Corporation website and can be downloaded through the following link: http://www.rand.org/ labor/FLS/IFLS.html.
FUNDING
None.
CONFLICT OF INTEREST
The authors declare no conflict of interest, financial or otherwise.
ACKNOWLEDGEMENTS
None stated.

