All published articles of this journal are available on ScienceDirect.

Effect of Zirconia and Alumina Fillers on the Microstructure and Mechanical Strength of Dental Glass Ionomer Cements
Authors Info & Affiliations
Abstract
Background:
Glass-ionomer cements perform a protective effect on the dentin-pulp complex considering the F ions release and chemical bonding to the dental structures. On the other hand, those materials have poor physic-mechanical properties in comparison with the restorative resin composite. The main aim of this work was to evaluate the influence of zirconia and/or alumina fillers on the microstructure and strength of a resin modified glass-ionomer cement after thermal cycling.
Methods:
An in vitro experimental study was carried out on 9 groups (n = 10) of cylindrical samples (6 x 4 mm) made from resin modified glass-ionomer (Vitremer, 3M, USA) with different contents of alumina and/or zirconia fillers. A nano-hybrid resin composite was tested as a control group. Samples were mechanically characterized by axial compressive tests and electron scanning microscopy (SEM) coupled to energy dispersive X-ray spectrophotometry (EDS), before and after thermal cycling. Thermal cycling procedures were performed at 3000, 6000 and 10000 cycles in Fusayama´s artificial saliva at 5 and 60 oC.
Results:
An improvement of compressive strength was noticed on glass-ionomer reinforced with alumina fillers in comparison with the commercial glass ionomer. SEM images revealed the morphology and distribution of alumina or zirconia in the microstructure of glass-ionomers. Also, defects such as cracks and pores were detected on the glass-ionomer cements. The materials tested were not affected by thermal cycling in artificial saliva.
Conclusion:
Addition of inorganic particles at nano-scale such as alumina can increase the mechanical properties of glass-ionomer cements. However, the presence of cracks and pores present in glass-ionomer can negatively affect the mechanical properties of the material because they are areas of stress concentration.
1. INTRODUCTION
In dental practice, glass-ionomer cements are commonly used for dental restorations, preventive sealing of occlusal fissures or cementing prosthetic structures. However, the mechanical strength of glass-ionomer cements is low for posterior teeth areas in the oral cavity. Thus, technological developments are in progress to improve their properties leading to the modification of the chemical composition of those materials by adding inorganic reinforcement particles or resin monomers [1-3].
Glass ionomer cement (GIC) is the generic name for a group of classifying materials originally produced from glass calcium fluoro-aluminosilicate powder mixed with an aqueous solution of alkenoic acids [3, 4]. The powder of the ionomer glass is formed by fusion of its main components (SiO2, Al2O3 and CaF2) at a temperature between 1100 and 1500 °C to form a homogeneous calcium fluoro-aluminosilicate glass [4, 5]. Silica and alumina are responsible for the mechanical strength of the material while calcium fluoride will contribute to F ions release at the surrounding media [6, 7]. Additionally, the material properties of GIC are dependent on the type of alkenoic acid selected by the manufacturer. There is a consensus that high molecular weight acids increase the mechanical strength of the cement although they increase the viscosity of the bulk material [7, 8]. Also, the carboxylic groups present in the acidic liquid are responsible for the chemical adhesion of the material to the dental structures [5].
The major disadvantages of glass ionomers are their low mechanical strength and high occlusal wear rate when compared to recent amalgam or resin composites [4, 6, 9]. For instance, a laminating technique involving resin composite coating the glass ionomer base is applied to associate high mechanical strength, chemical adhesion to tooth structures and release of F ions. Resin composites are materials with higher strength and resistance to wear compared to GIC. In these circumstances,GIC acts as a base or liner which is protected against surface wear and chewing forces as they are provided for posterior restorations [4, 10].
The cements modified by metallic fillers emerged from the original idea of adding silver alloy fillers into the generic GIC composition [8, 9]. The conventional ionomer cements modified by the addition of light-cured resin monomers (hydroxyethyl methacrylate) are commonly classified as resin-modified glass ionomer cements [4, 5, 8]. Modification of glass ionomer cement adding resin content has improved its mechanical and optical properties [1-3, 8].
Considering the previous pathways to improve strength by modifying the composition of the materials, the aim of this study was to evaluate the influence of the addition of zirconia and alumina fillers on the microstructure and mechanical strength of modified resin glass ionomer cements after thermal cycling.
2. MATERIALS AND METHODS
2.1. Synthesis of the Modified Glass-ionomer
In this study, commercial resin-modified glass ionomer cement (GIC) (Vitremer, 3M, ESPE), named as VT , was used to synthesize a novel reinforced glass ionomer containing fillers based on yttria stabilized zirconia (Sigma- Aldrich) and aluminum oxide (Sigma- Aldrich), named as VTZ and VTA respectively from now on.
The commercial GIC (VT) was mixed in a ratio of 2.68 g/ml on a glass plate and injected into a polytetrafluoroethylene mold using a Mark II Snap-fit syringe (Centrix, USA) (Fig. 1). The matrix had a capacity to produce six cylindrical samples (6 x 4 mm) simultaneously. The samples were covered with an acetate tape during the light-curing for 40 s using a Coltolux 75 (Coltène/Whaledent, Altstätten, Switzerland) cure device (Fig. 1C). The samples were produced by a single operator according to the manufacturer's recommendations.
Reinforced GIC (VT) formulations were prepared by adding different amounts of zirconia (VTZ) and/or alumina (VTA) nano-fillers into the commercial GIC (VT) composition (Table 1). The cylindrical specimens of the reinforced GIC were prepared following the same method described for the commercial GIC (VT). A resin composite nano-hybrid (Great, VOCO; Germany), named GD from now on, was used in order to establish terms of comparison with the GIC (VT) tested . The cylindrical composite samples were prepared according to the manufacturer's instructions. A total of 210 cylindrical specimens were synthesized and divided into 9 groups (Table 1).
2.2. Mechanical Strength
At first, 90 specimens were evaluated by compressive tests (n = 10) before thermal cycling tests. Then, 5 groups (VT, VTA, VTZ, VTZA and GD) consisting of a total of 120 samples were assessed by compressive tests before and after thermal cycling. Compressive tests were performed at 25 °C by using a universal mechanical testing machine (Instron 8874, MA, USA) with a 25 kN load cell. The tests were monitored using the Trapezium software. Test were carried out at a speed of 1 mm/min. A number of 10 specimens of each condition were tested in order to obtain mean values of the compressive force.
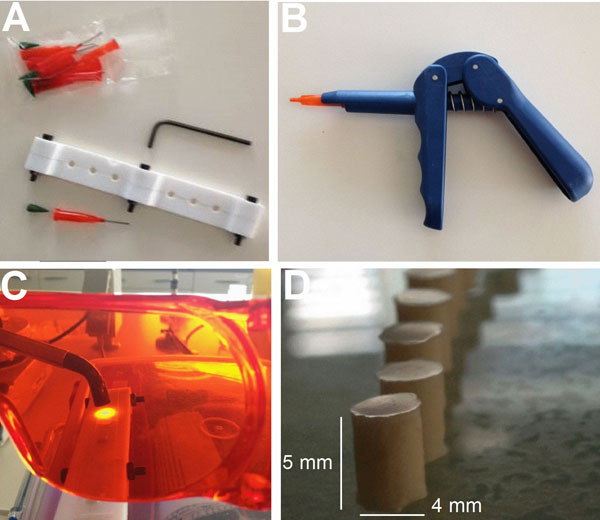
(A) Polytetrafluoroethylene mold and (B) Mark II Snap-fit syringe. (C) Light-curing of (D) the cylindrical specimens.
2.3. Thermal Cycling
Thermal cycling is an experimental method of simulating the effect of temperature variations on restorative materials as found in the oral cavity [11]. For thermal cycling, the samples were immersed in two consecutive containers containing artificial saliva at 5 ± 3 °C and 60 ± 3 °C. The immersion time in each container was 15 s with a transfer time of 15 s between containers. A total of 40 specimens from 3 groups (VT, VTA, GD), making a total of 120 samples, were divided into 10 samples for each condition (n = 10) of thermal cycling: C0 - before thermal cycling; C1 - 3000 cycles; C2 - 6000 cycles; C3 - 10 000 cycles). Within the particle-reinforced GIC (VT), only VTA was selected for the thermal cycling test due to the best result obtained in the mechanical strength tests. The thermal cycling tests were carried out by immersing the samples in a Fusayama´s artificial saliva solution [23]. The composition of the Fusayama saliva is shown in Table 2. The pH of the artificial saliva solution was approximately 5.5.
2.4. Microscopic and Chemical Analyses
Two specimens of each group were prepared for field emission guns scanning electron microscopy (FEG-SEM). Specimens were wet-ground on SiC abrasive papers down to 1200 mesh. After griding, the specimens were cleaned in distilled water using an ultrasonic bath and then polished with a diamond (1 µm) paste. After preparation, the specimen´s surfaces were sputter coated with carbon to be analyzed by FEG-SEM (FEI NOVA 200; USA).
The microstructure of these materials was analyzed before and after thermal cycling at magnifications between 200x and 10000x under secondary (SE) and backscattered electron (BSE) under voltage of 5-15 kV. The chemical analysis was performed in specific areas of the organic matrix and inorganic nano-particles by energy dispersive spectroscopy (EDAX Pegasus X4M; USA).
2.5. Statistical Analyses
The results of the compressive tests of the different types of samples and after different thermal cycling conditions were analyzed by analysis of variance (ANOVA) using Origin software (8.5.1 OriginPro, OriginLab Corporation, MA, USA). Shapiro-Wilk Test assessed the normality of the population. The difference between the mean values for each group was considered statistically different when p < 0.05. The Tukey multiple comparisons test was used to compare the results with each other.
Information on the diferent materials used in this study: composition, particle size and weight.
| Material | Composition (% wt.) | Particle size (µm ou nm) | mass (g) |
|---|---|---|---|
| Glass ionomer (Vitremer, 3M, ESPE, USA) (VT) | Liquid: Canforoquinone, HEMA, alquenoic acid, water (28%) Powder: fluoraluminumsilicate glass (SiO2, Al2O3, CaF2, AlF3,AlPO4,ZrO2 (72%) | Comercial powder particles: 12.5 µm | 0 |
| Glass ionomer reinforced with Alumina (VTA1) | Liquid: Canforoquinone, HEMA, alquenoic acid, water (27.2%) Powder: fluoraluminumsilicate glass (68.9%), Nano-particles (3.9%) | Comercial powder particles: 12.5 µm Al2O3 nano-fillers: < 50 nm | 0.008 |
| Glass ionomer reinforced with Alumina (VTA2) | Liquid: Canforoquinone, HEMA, alquenoic acid, water (26.8%) Powder: fluoraluminumsilicate glass (67.1%), Al2O3 Nano-particles (6.1%) | Comercial powder particles: 12.5 µm Al2O3 nano-fillers: < 50 nm | 0.0130 |
| Glass ionomer reinforced with Alumina (VTZ1) | Liquid: Canforoquinone, HEMA, alquenoic acid, water (27%) Powder: fluoraluminumsilicate glass (68.3%), Al2O3 nano-particles (4.7%) | Comercial powder particles: 12.5 µm ZrO2 nano-fillers: <50 nm | 0.0097 |
| Glass ionomer reinforced with Zircónia (VTZ2) | Liquid: Canforoquinone, HEMA, alquenoic acid, water (25.6%) Powder: fluoraluminumsilicate glass (65%), Nano-partículas de ZrO2 (9.4%) | Comercial powder particles: 12.5 µm ZrO2 nano-fillers: <50 nm | 0.0207 |
| Glass ionomer reinforced with Zircónia (VTZ3) | Liquid: Canforoquinone, HEMA, alquenoic acid, water (25.5%) Powder: fluoraluminumsilicate glass (63.5%), ZrO2 nano-particles (11%) | Comercial powder particles: 12.5 µm ZrO2 nano-fillers: < 50 nm | 0.0255 |
| Glass ionomer reinforced with zircónia (VTZ4) | Liquid: Canforoquinone, HEMA, alquenoic acid, water (23.9%) Powder: fluoraluminumsilicate glass (60.3%), nano-fillers ZrO2 (15.8%) | Comercial powder particles: 12.5 µm ZrO2 nano-fillers: < 50 nm | 0.0373 |
| Glass ionomer reinforced with zirconia and alumina (VTZA) | Liquid: Canforoquinone, HEMA, alquenoic acid, water (25%) Powder: fluoraluminumsilicate glass (65.7%), ZrO2 and Al2O3 nano-fillers (9.3%). | Comercial powder particles: 12.5 µm ZrO2 nano-fillers: < 50 nm Al2O3 nano-fillers: < 50 nm | 0.0128; 0.0077 |
| resin composite (GrandioSO, Voco, Germany) | Organic matrix: BISGMA, TEGDMA, BISEMA (11%) | Coloidal sílica nano-fillers 20-40 nm; Barium glass fillers: 1 µm | 0.092 |
Composition of the Fusayama’s artificial saliva used as electrolyte solution of pH 5.5 in this study.
| Compounds | (g/l) |
|---|---|
| NaCl | 0.4 |
| KCl | 0.44 |
| CaCl2.2H2O | 0.795 |
| Na2S.9H2O | 0.005 |
| NaH2PO4.2H2O | 0.69 |
| Urea |
3. RESULTS
3.1. Microscopic and Chemical Analyses
FEG-SEM images recorded on glass-ionomer surfaces are shown in Figs. (2A-D). The distribution of inorganic fillers in the commercial GIC matrix is noticed in Fig. (2A), in which Zone “Z1” is identified for chemical analyses. Pores were noticed in the GIC (VT) microstructure by FEG-SEM analyses as shown in Fig. (2B). The results of chemical analysis by X-ray spectroscopy revealed the composition of the first zone “Z1” (Fig. 2A) having the highest intensity peaks corresponding to the following chemical elements: Si (15.8% wt); Al (14.5% wt); and O (22.8% wt). Furthermore, less intense peaks are found for Sr (34% wt) and F elements. Those results allow us to confirm this area as being part of the glass particles.
The distribution of the glass particles can be noticed on the GIC reinforced with alumina (VTA) (Fig. 2C) or zirconia (VTZ) (Fig. 2E). The results of chemical analysis by X-ray spectroscopy recorded on zone “Z1” shown in Fig. (2C) showed the presence of a higher proportion of elements Al (19.1%wt) and O (39.5% wt), which allows us to identify this particle as alumina (Al2O3) added to the commercial composition of GIC to synthesize a reinforced material on the VTA group. Chemical analysis by X-ray spectroscopy performed on zones “Z1” and “Z2” indicated in Fig. (2E) revealed a higher proportion of Zr (60.5% wt), O (16.8% wt) and Y (12.3% wt). That indicated fillers composed of ytria-stabilized zirconia in reinforced GIC on the VTZ group. The size of zirconia particles (agglomerates) was larger than 50 μm. The micrograph shown in Figs. (2D) and (2F) reveals the presence of pores and cracks in the microstructure of the reinforced GIC. That was similar to that noticed on the commercial composition (Fig. 2B).
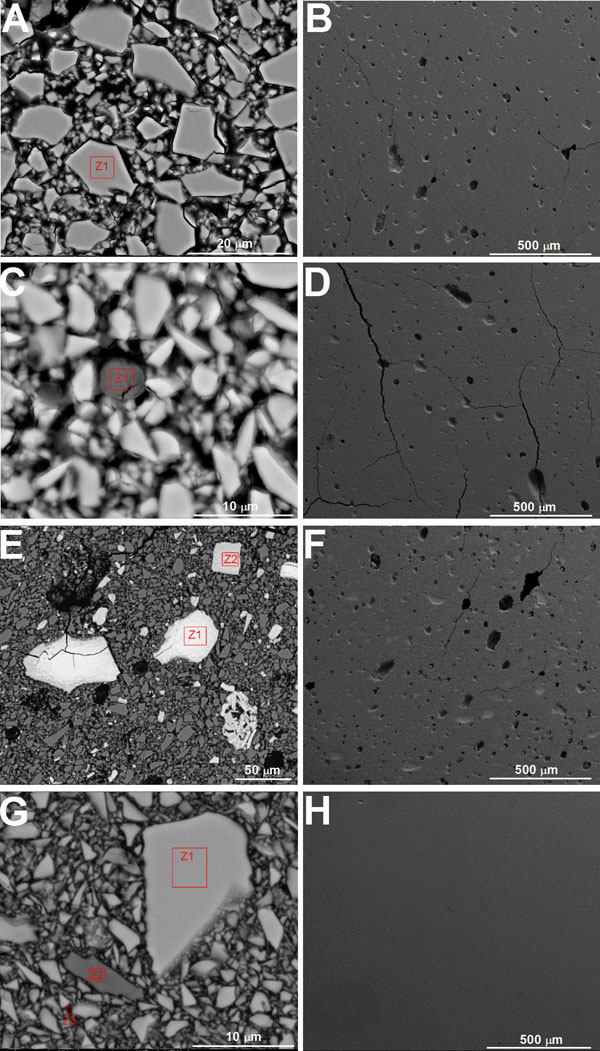
FEGSEM images on (A-F) glass-ionomer and (G,H) resin composites. (A-B) Commercial glass-ionomer and glass-ionomer reinforced with (C,D) alumina or (E,F) zirconia. Images obtained by (A,C,E,G) backscattered or (B,D,F,H) seconday electrons mode at 15 kV.
On the other hand, the microstructure of resin composite is revealed in Fig. (2G). Chemical analysis by X-ray spectroscopy performed in the selected areas (Fig. 2H) revealed the presence of Si (29.89% to 42.79 %) and O (60-65%) on zone “Z1”. On zone “Z2” in Fig. (2H), the following elements were detected: Ba (18.51% to 25.40%), Si (20%), Al (17%) and O (35%). Those results suggested two different inorganic fillers based on colloidal silica and barium glass. Zone 3 was chosen in an attempt to acquire results for the matrix composition. No morphological changes were observed by scanning electron microscopy as a result of thermal cycling (Fig. 4). Also, a degradation of GIC or resin composite could not be detected by scanning electron microscopy performed after thermal cycling.
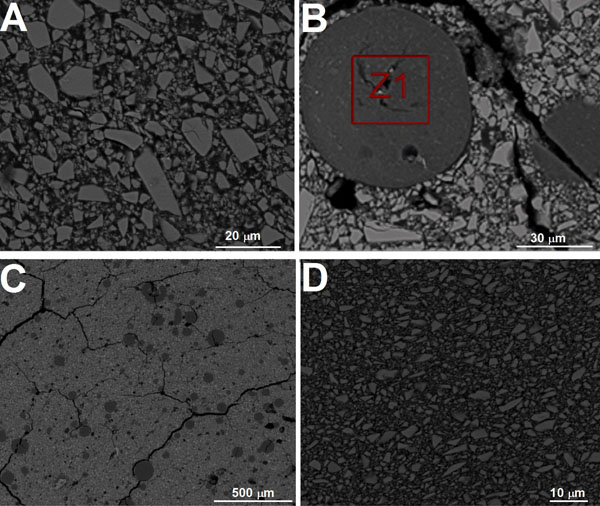
FEG-SEM images on glass-ionomer reinforced with alumina before thermal cycling tests. Images obtained by backscattered mode at 15 kV.
3.2. Compressive Strength Before and After Thermal Cycling
Results obtained by axial compressive tests recorded for commercial or reinforced GIC before thermal cycling are shown in Fig. (3). Statistical analysis showed a significant difference in the mean values of compressive strength between the commercial and reinforced GIC groups (p < 0.05) (Table 2). Results showed that alumina particles fillers (VTA1 and VTA2 groups) increase mechanical strength of the commercial glass-ionomer cement (VT). However, the addition of zirconia particles (agglomerates) was found to have a negative impact on the strength of the glass-ionomer material. A Tukey analysis (Fig. 3) showed a significant statistical difference (p < 0.05) between GIC reinforced with alumina particles (VTA1 and VTA2) and the two compositions of GIC with a higher percentage of zirconia particles (VTZ3 and VTZ4). The experimental formulation with simultaneous reinforcement of alumina and zirconia (VTAZ) exhibited similar mechanical strength to that of the GIC containing only alumina (VTA1 and VTA2). GIC containing alumina and zirconia (VTAZ) has also shown a more statistically significant compressive strength (p < 0.05) than the formulations with higher amounts of zirconia (VTZ3 and VTZ4) (Fig. 3 and Table 2). The highest mean values of compressive strength were recorded for resin composite (326.5 ± 45.3 MPa) when compared to resin-modified glass ionomer (174.2 ± 17 MPa) and conventional glass-ionomer (78.78 ± 13.3 MPa).
Analysis of variance (ANOVA) of the maximum axial compressive load values recorded for comercial and reinforced Vitremer glass ionomer.
| DF | SS | MS | F | p value | |
|---|---|---|---|---|---|
| Model | 7 | 1.96E6 | 281186.15 | 6.40 | 7.86E-6 |
| Error | 70 | 3.07E6 | 43917.33 | ||
| Total | 77 | 5.04E6 |
Statistically significant at a level of p<0.05. DF: Degrees of freedom; SS: Sum of squares; MS: Mean square; F: F-ratio; p: p-value
Analysis of variance (ANOVA) of the maximum axial compressive load values recorded for the comercial glass ionomer.
| DF | SS | MS | F | p value | |
|---|---|---|---|---|---|
| Model | 3 | 64138.75 | 21379.58 | 0.68 | 0.57 |
| Error | 32 | 1.00E6 | 31543.22 | ||
| Total | 35 | 1.073E6 |
Statistically significant at a level of p<0.05. DF: Degrees of freedom; SS: Sum of squares; MS: Mean square; F: F-ratio; p: p-value
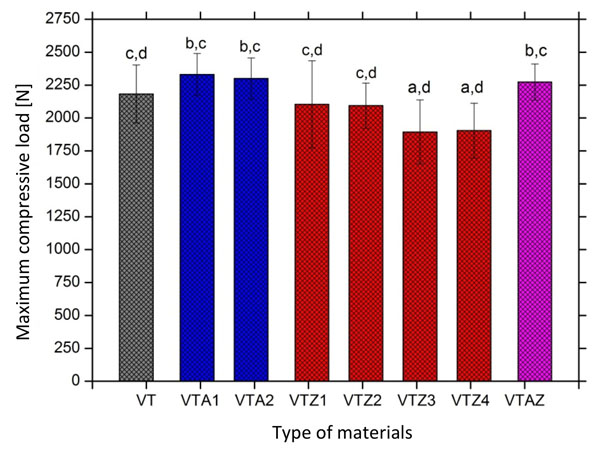
Mean values and standard deviation of compressive load recorded on commercial and reinforced glass-ionomer groups before thermal cycling tests.
Analysis of variance (ANOVA) of the maximum axial compressive load values recorded for the comercial glass ionomer reinforced by alumina particles.
| DF | SS | MS | F | p value | |
|---|---|---|---|---|---|
| Model | 3 | 174856.22 | 58285.40 | 2.30 | 0.09 |
| Error | 30 | 758210.02 | 25273.66 | ||
| Total | 33 | 933066.24 |
Statistically significant at a level of p<0.05. DF: Degrees of freedom; SS: Sum of squares; MS: Mean square; F: F-ratio; p: p-value
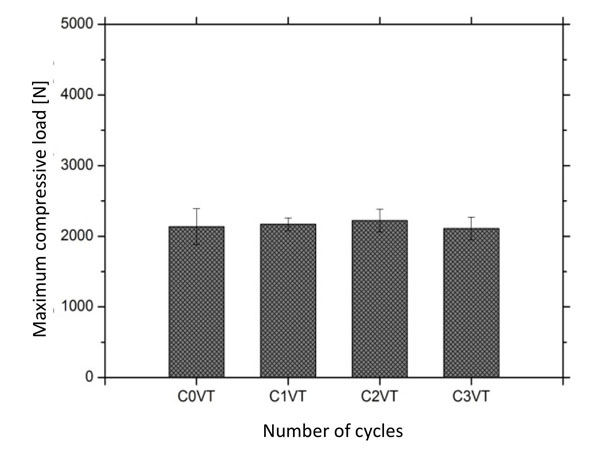
Mean values and standard deviation of compressive load recorded on commercial glass-ionomer after different cyclic thermal conditions: C1, 3000 cycles; C2, 6000 cycles; C3, 10000 cyclos and C0, control group (free of thermal cycling).
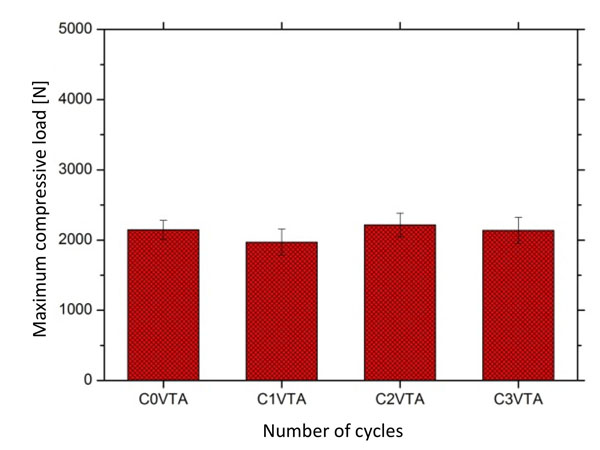
Mean values and standard deviation of compressive load recorded on glass-ionomer reinforced with alumina after different cyclic thermal conditions: C1, 3000 cycles; C2, 6000 cycles; C3, 10000 cyclos and C0, control group (free of thermal cycling).
Analysis of variance (ANOVA) of the maximum axial compressive load values recorded for the nano-hybrid resin composite.
| DF | SS | Quadrados médios | F | p value | |
|---|---|---|---|---|---|
| Model | 3 | 2.35E7 | 783403.75 | 1.32 | 0.28 |
| Error | 32 | 1.89E7 | 591574.72 | ||
| Total | 35 | 2.12E7 |
Statistically significant at a level of p<0.05. DF: Degrees of freedom; SS: Sum of squares; MS: Mean square; F: F-ratio; p: p-value
After thermal cycling, results of the maximum compressive strength for commercial and reinforced GIC are shown in Figs. (5) and (6). Mean values of compressive strength recorded on the specimens revealed that thermal cycling did not cause a significant deterioration of glass-ionomer or resin composite materials (Fig. 7). The compressive strength values recorded on the materials in different conditions of thermal cycling did not vary significantly (p > 0.05) when compared to those before thermal cycling (see Tables 3, 4, 5, and 6).
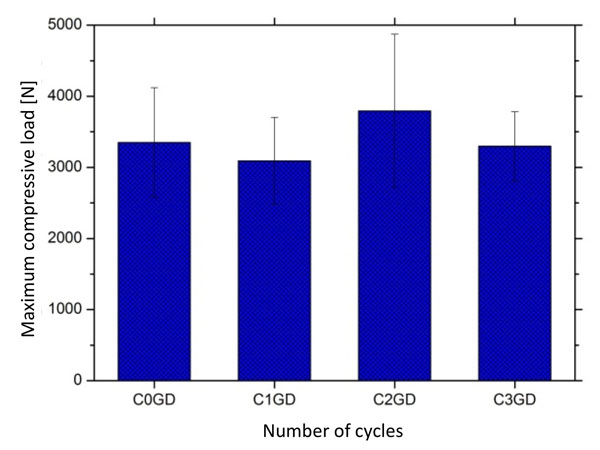
Mean values and standard deviation of compressive load recorded on resin composites after different cyclic thermal conditions: C1, 3000 cycles; C2, 6000 cycles; C3, 10000 cyclos and C0, control group (free of thermal cycling).
4. DISCUSSION
In the present study, the composition of commercial glass-ionomer cement was modified by adding different contents of alumina or zirconia fillers in order to improve mechanical properties of the material. The addition of alumina fillers increased the compressive strength of glass-ionomer cements although such mechanical strength was still lower than that recorded on resin composites. Scanning electron microscopy revealed significant pores and cracks in the microstructure of glass-ionomer cements that can influence of mechanical strength of such materials. Thermal cycling tests did not significantly affect the mechanical strength of glass-ionomer or resin composite tested in this study.
The mean values of compressive strength recorded on the commercial glass-ionomer and resin composite were close to those reported in literature [3, 12, 13]. Previous studies reported compressive strength values for glass-ionomer ranging from ranged from 117 up to 184 MPa [2, 12, 14] in comparison to those on resin composites that ranged from 250 up to 390 MPa [13, 15]. Such mechanical strength noticed on resin composite provides enough strength for their application in dental restorations in all areas of the oral cavity [16]. Thus, differences found in compressive strength values can occur due to operating sensitivity as well as differences in chemical composition of glass-ionomers and resin composites [15]. In our study, the highest mean values of compressive strength were found in glass-ionomer containing nano-particles of alumina. The addition of larger particles of alumina or zirconia induced a slight loss of mechanical properties of the glass-ionomer. In fact, it is known that the use of alumina or zirconia nano-particles results in improvement of mechanical properties of glass ionomer cements [3, 17, 18].
Considering thermal cycling, there is a wide variation in temperature amplitude (e.g. 15 - 45 °C, 4 - 60 ºC or 5 - 55 ºC) as well as in number and duration of elected cycles (ranging from 500 to 5 million cycles) in several studies [12]. Some authors reported degradation of glass-ionomer after thermal cycling tests [19, 20] while others did not find degradation effects using such experimental simulation method [14]. In the present study, the thermal cycling procedure did not affect the mechanical strength of glass-ionomer and resin composites.
However, the presence of pores and cracks in the microstructure of glass-ionomer (Fig. 2) can decrease its mechanical strength. Fleming et al. (2003) attributed the cause of pores in the glass ionomer cements due to the incorporation and trapping of air bubbles during the manipulation of the material [15]. In addition, the water in the glass-ionomer composition is sensitive to environment conditions leading to desiccation and syneresis of the material in the initial reaction period. As the set reaction progresses, the matrix is hydrated by water [4]. There is evidence that some of the water is strongly linked to the structure of the material during set reaction while most of the other molecules does not participate in the set reaction, that is susceptible to removal by syneresis [4, 21]. Furthermore, this drying process can be intensified during microscopic analyses as referred in the study of Xie et al. (2000) [3]. Cracks can also be explained by the polymerization shrinkage of the resin matrix during polymerization, generating residual stresses between the organic matrix and inorganic particles [22]. The micrographs in Figs. (2G-H) reveals significant lesser amount of pores in the microstructure of resin composite compared with those of commercial or reinforced glass-ionomer. The lowest amount of pores is resultant from the presentation of material as a viscous paste that does not require any mixing of powder and liquid as used in glass-ionomer cement. No cracks were observed in the micrographs obtained on resin composite by microscopic analyses.
CONCLUSION
The addition of alumina and zirconia fillers in glass-ionomer cements was assessed in this study. Within the limitation of this work, we consider the following conclusions:
- A significant difference was found in the mean values of compressive strength between commercial glass-ionomer cement (GIC) and GIC formulated with different contents of alumina and zirconia;
- The addition of alumina fillers promoted a higher increase in mechanical strength of the commercial GIC;
- The presence of zirconia particles (agglomerates) above 50 μm was detected in the microstructure of the GIC. The addition of larger inorganic particles to the commercial GIC was found to have a negative impact on compressive strength of the material;
- On microscopic analysis, a high degree of porosity and cracks was noticed in the microstructure of commercial GIC and GIC reinforced with nano-particles. These defects can affect the mechanical properties of the material because they are areas of stress concentration;
- The group of nano-hybrid resin composite samples tested in this study showed substantially higher values of compressive strength when compared to commercial GIC and GIC reinforced with nano-particles. A lesser degree of porosity was observed in the microstructure of the composite as a result of its viscous paste commercial presentation.
CONFLICT OF INTEREST
The authors confirm that this article content has no conflict of interest.
ACKNOWLEDGEMENTS
The authors acknowledge the financial support provided by Foundation for Science and Technology (SFRH/BPD/87435/2012; EXCL/EMS-TEC/0460/2012; UID/EEA/04436/2013) and CAPES/CNPq (Brazilian funding).

