All published articles of this journal are available on ScienceDirect.

Torque Loss After Miniscrew Placement: An In-Vitro Study Followed by a Clinical Trial
Authors Info & Affiliations
Abstract
To evaluate torque loss a week after insertion, both in an in vivo and an in vitro experimental setup were designed. In the in vivo setup a total of 29 miniscrews were placed in 20 patients who underwent orthodontic treatment. Maximum insertion torque (MIT) was evaluated at insertion time (T1). A week later, insertion torque was measured again by applying a quarter turn (T2); no load was applied on the screw during the first week. In the in vitro setup a total of 20 miniscrews were placed in pig rib bone samples. MIT was evaluated at insertion time (T1). Bone samples were kept in saline solution and controlled environment for a week during which the solution was refreshed every day. Afterwards, torque was measured again by applying a quarter turn (T2). The comparison of MIT over time was done calculating the percentage difference of the torque values between pre- and post-treatment and using the parametric two independent samples t-test or the non-parametric Mann–Whitney test. After a week unloaded miniscrews showed a mean loss of rotational torque of 36.3% and 40.9% in in vitro and in in vivo conditions, respectively. No statistical differences were found between the two different setups. Torque loss was observed after the first week in both study models; in vitro experimental setup provided a reliable study model for studying torque variation during the first week after insertion.
INTRODUCTION
Most of orthodontic treatment plans require some form of anchorage. A variety of intra-and extra-oral appliances are used for this purpose, but these treatment mechanics cannot always guarantee “absolute” anchorage and outcomes frequently depend on the collaboration of patients. Miniscrews do not have these limitations [1-4], but their stability is not always reliable [5-7]. Different approaches exist to obtain measurements of miniscrew connection with the bone, among these maximum insertion torque (MIT), resonance frequency analysis (RFA), and maximal removal torque (MRT) [8-10].
Stability is particularly compromised during the first week after implant insertion [11] as a result of active bone remodeling in the peri-implant tissues. This process is identical to the normal wound healing phases of bone and includes necrosis of the traumatized area and subsequent bone reabsorption. Osteogenesis also begins within the first week following implant insertion.
Recipient bone is a biphasic material, which presents viscoelastic properties [12, 13]: once a device is inserted in it, a mechanical relaxation process occurs, leading to a loss of tensile strength. Since in dentistry implant stability is generally assessed through insertion torque, which is considered the “reference” standard, the short time mechanical response of native bone to unloaded mini-screws can be described by torque recordings.
The hypothesis of the present study was that primary torque loss in the short time (first week after placement) is mainly a mechanical reply of the bone due to its viscoelastic characteristics. To test this hypothesis, we conducted a parallel study on torque measures both in in vivo and in in vitro conditions, and we recorded torque values twice: at the time of insertion and seven days after insertion, which is the time-point for osteoid appearance according to the literature [14]. Torque differences between these two recordings were calculated in order to answer to the primary aim of this study.
The effect of implant design on these measures was assessed in order to answer to the secondary aim of this study. In fact, insertion torque might be associated with some of the geometrical characteristics of the implant, such as its diameter [15], thread depth [16], tapering of the shaft [17], longitudinal fluting [18], and pitch [19]. In this study we aimed to compare torque recordings in two screw designs differing mainly in shaft conical shape.
To avoid replication of what is already known, we conducted a variety of literature searches for both randomized and non-randomized clinical studies on our research questions. A broad spectrum search strategy was defined with the following subject headings and keywords: orthodontics, torque, mini implant, micro implant, microimplant, screw, mini screw, miniscrew, micro screw, microscrew, and temporary anchorage device. These search terms were individualized for the following electronic databases: PubMed (MEDLINE), EMBASE, CENTRAL, and Google Scholar B. The latter search engine was consulted for Grey literature. These databases where then searched independently by two of the authors (SD and MM).
These researches showed that currently no studies or systematic reviews have addressed our clinical questions. Undertaking this research study was therefore deemed appropriate.
Our primary objectives are defined and summarized in the following PICO (Participants, Interventions, Comparisons, Outcomes) questions: what is the difference in maximum torque values (O) recorded at the time of miniscrew insertion (C) and those measured 1 week after miniscrew placement (I) in adolescent and adult patients in need of stationary anchorage during orthodontic tooth movement (P)? What is the difference in torque loss (O) between Group 1 screws (I) and Group 2 screws (C) in adolescent and adult patients in need of stationary anchorage during orthodontic tooth movement (P)? For the latter, investigating the role of miniscrew design in torque loss, i.e. the difference in maximum insertion torque between days number 0 and number 7, we compared two different types of miniscrews.
Furthermore, we will assess the adverse effects of these interventions.
Secondary Objective
To assess the relaxation prediction capability of an in vitro experimental study model, i.e. to evaluate the correlation between the maximum insertion torque loss that we recorded in vivo at day 7 and those of the same miniscrews placed in pig rib bone samples kept in saline solution for a week.
MATERIALS AND METHODOLOGY
This study was conducted according to the Declaration of Helsinki principles. The protocol study was evaluated and accepted by the Health Science Department Council of the University of Genova with the approval number 741. All the participants filled in an informed consent form for participation in research. Two different miniscrew were used: ORTHOImplant (3M Unitek, Monrovia, California), 1.8 mm diameter and 8 mm length (Group 1), and OrthoEasy (Forestadent, Pforzheim, Germany), 1.7 mm diameter and 8 mm length (Group 2). Both devices were scanned by a 20.00 kV scanning electron microscope (model S-2500; Hitachi, Tokyo, Japan), to obtain images on a micrometric scale. Images were obtained at 20 and 80 times magnifications (Fig. 1) and were then uploaded on ImageJ software (version 1.47b, National Institutes of Health, Maryland, USA). Geometrical aspects of both screws are reported in Table 1. (Fig. 1) represents a scanning electron microscope image of the two devices, with a sketch to measure their conical length (which is the length from the tip of the screw to the first thread having a diameter equal to the largest diameter of the threaded part).
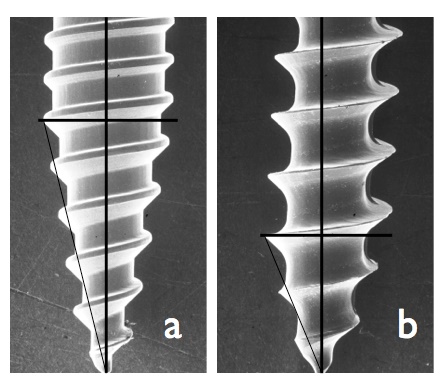
Scanning electronic microscope images of the two miniscrew tested and geometrical sketch of their conical tip. a) ORTHOImplant (3M Unitek): Group 1, b) OrthoEasy (Forestadent): Group 2.
Screws geometrical characteristics.
| Group 1 | Group 2 | |
|---|---|---|
| Depth (mm) | 0.111 | 0.327 |
| Screw Pitch (mm) | 0.573 | 0.837 |
| External Diameter (mm) | 1.797 | 1.770 |
| Initial Conical Length (mm) | 3.647 | 1.961 |
| Thread Opening Angle | 67° | 52° |
In Vivo Study Model
The study was designed as a randomized clinical trial (Fig. 2). Participants were 20 patients (mean age: 17.6 years; 13 females and 7 males). Inclusion criteria were the following: complete dentition, no systemic disease, no alteration of bone metabolism, orthodontic treatment need.
A randomization list was created for the miniscrew type with an allocation ratio of 1:1 in respect of the patient by a dedicated software (GraphPad Software Inc., La Jolla, California). Blinding placement with respect to the miniscrew was not possible since the operator knew what device was used.
Orthodontic treatment and miniscrew placement were performed by an expert clinician (MM) at the School of Dentistry - Orthodontics Department, University of Genova. The two different miniscrews were placed without predrilling under local anaesthesia, a circular lancet was used prior the miniscrews insertion; insertion was performed avoiding that the neck of the device was in contact with the cortical plate at the end of placement, thus allowing the further turn a week later.
Descriptive analysis of miniscrews placed in vivo.
| TABLE 2 | |||||||
|---|---|---|---|---|---|---|---|
| In vivo | Maxilla | Mandible | Treatment time (days) | Failures | Unsucessfull screw duration (days) | Success rate (%) | |
| Group 1 | 15 | 7 | 8 | 159.0 | 0 | - | 100 |
| Group 2 | 14 | 5 | 9 | 219.6 | 3 | 65 (*) | 78.6 |
| Tot | 29 | 12 | 17 | 183.2 | 65 | 89.3 | |
| *: 1 failure in the mandible; 2 failures in the maxilla | |||||||
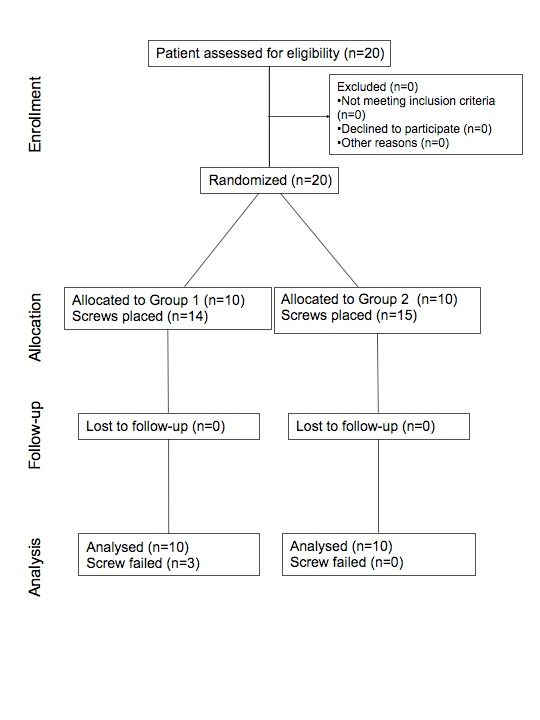
CONSORT flow chart.
A total of 29 screws were placed in 20 orthodontic patients. Descriptive analysis of miniscrews insertion sites is showed in Table 2.
Maximum insertion torque (MIT) was measured twice: at the placement time (MIT-T1) and a week later (MIT-T2) applying a quarter of a turn to the screw; it was measured in Ncm with two adapted tips applied to a torque wrench (model TT50 SD, MHH Engineering, Bramley, United Kingdom). Previous observations in clinical practice suggested us that a torque peak is often registered in the final part of the insertion, so that it seemed reasonable to leave a non-screwed quarter of turn and to compare the two time-points torque recordings as a measure of the loss of bone-to-screw tensile holding.
During the first seven days no orthodontic loads were applied on the screws. When miniscrews were removed the maximum removal torque (MRT) was measured.
The operator collected clinical data and these were blindly sent to the Health Science Department, section of Biostatistic, University of Genova, for the elaboration.
In Vitro Study Model
Mediotoracic ribs of a ten months old male pig were obtained the day of the experiment; a total of 20 specimen 30 mm long were cut from the diaphysis. Pig ribs have weaker bone characteristics than the human mandible, and they show heterogeneity in terms of bone density, but they were chosen for the homogeneity of their cortical thickness, which is even more significant for this kind of test. Ten Group 1 and ten Group 2 miniscrews were used. Each specimen received one screw that was inserted directly through the cortical bone without predrilling. All the screws were placed by the same operator who inserted the miniscrews in the in vivo setting, using a digital screwdriver measuring in continue mode the insertion torque (Cedar DID-4, Imada, Northbrook, Illinois): output data were collected by the SW-1SV-USB data acquisition software (Imada, Northbrook, Illinois). Placement was performed avoiding that the neck of the device was in contact with the cortical plate at the end of placement, thus allowing the further turn a week later. After insertion bone samples were stored in a saline solution maintained at 27 °C in an environment controlled for humidity and temperature. Saline solution was fully changed every 24 hours, and no loads were applied to the screws.
Seven days later the same operator used the same screwdriver to apply a quarter of turn on every miniscrew to register the new maximum torque (MIT-T2).
The experiment took place at the Department of Civil, Chemical and Environmental Engineering, University of Genova.
Statistical Analysis
All characteristics, both at baseline and after one week, were summarized using mean (±standard deviation), median (with interquartile range), or frequencies (with percentages).
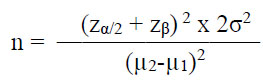
An a priori sample size (n) calculation, with the insertion torque as the main outcome, was performed, fixing a power (β) of 95% (zβ=1.64) and an α of 5% (zα/2=1.96), considering clinically significant a difference of 2.5 in the means (µ) of the outcomes between the two groups, with a standard deviation (σ) of 1.5 estimated from a previously performed pilot study, using the following formula:
Normality of variables was assessed by graphical methods (mean of histograms) and confirmed by the Shapiro - Wilk’s normality test and Levene’s test of homogeneity of variance.
Data which did not fulfill normality assumptions were rank transformed for the non parametric analyses.
A first separate analysis of both implants (in vitro and in vivo) was performed.
A paired sample t test was used to verify differences in the MIT over time, respectively for in vivo and in vitro samples.
The comparison of MIT at baseline was computed applying the parametric two independent samples t-test.
The comparison of MIT over time was done calculating the percentage difference of the torque values between pre- and post-treatment and using the parametric two independent samples t-test and the non-parametric Mann–Whitney test. First, the analysis was executed on all samples, and then comparing separately the different subtypes of implant (Group 1 and Group 2).
Statistical significance was assessed at a level of 0.05 (2-tailed) and all analysis were performed using SPSS v.20.
Both for in vivo and in vitro samples statistically significant differences (p<0.05) were verified over time, considering each time point of torque measurement (Table 3). In vivo samples were analyzed using parametric tests. In vitro samples were investigated both with parametric and non-parametric tests. Statistical analyses performed on all 49 samples together used non-parametric tests.
Overall differences overtime.
| Model | Baseline (T1) |
T2 | End of the treatment (T3) |
p value |
|---|---|---|---|---|
|
In vivo (Ncm) |
15.81 ± 5.61 | 9.65 ± 4.15 | 11.92 ± 5.84 | 0.031 (T3 vs T2) <0.001 (T3 vs T1) <0.001 (T2 vs T1) |
|
In vitro (Ncm) |
12.50 (18.75 - 10.00) | 8.00 (11.50 - 5.00) | <0.001 |
RESULTS
In Vivo Samples
Group 1 and Group 2 implants revealed statistically significant differences in their MIT at baseline (Group 1: 19.27 ± 3.28; Group 2: 10.71 ± 4.75, p<0.001), but not in their percentage trend over time (Table 4).
Differences between types of implants. Torque values are expressed in Ncm.
| Model and type of implant |
At baseline (T1) |
p value |
Over time (T2-T1 %) |
p value |
Over time (T3-T2 %) |
p value |
Over time (T3-T1 %) |
p value |
|
|---|---|---|---|---|---|---|---|---|---|
|
In vivo (29 samples) |
Group 1 | 19.27 ± 3.28 | <0.001* | 41.86% ± 12.48 | 0.705 | 34.58% ± 50.46 | 0.885 | 24.36% ± 24.03 | 0.798 |
| Group 2 | 10.71 ± 4.75 | 39.74% ± 17.22 | 31.36% ± 62.03 | 21.61% ± 30.12 | |||||
|
In vitro (20 samples) |
Group 1 | 17.00 (25.75 - 12.00) | 0.011* | 22.24% ±11.78 | <0.001* | ||||
| Group 2 | 10.50 (14.00 - 8.50) | 49.71%±13.28 | |||||||
* statistically significant (p < 0.05)
In Vitro Samples
A statistically significant difference (p = 0.011) in MIT was noticed at baseline between Group 1 (17.00 [25.75 – 12.00]) and Group 2 (10.50 [14.00 – 8.50]). In addition, the percentage reduction of the MIT value over time differed significantly between the two types of implant (Group 1: 22.24% ±11.78; Group 2: 49.71%±13.28, p <0.001) (Table 4).
Differences between in vivo and in vitro models. Torque values are expressed in Ncm.
| Model | At baseline (T1) | p value | Over time (T2-T1 %) | p value | ||
|---|---|---|---|---|---|---|
| In vivo | 16.00 (20.00 - 11.00) | 0.521 | 40.84% ± 14.67 | 0.313 | ||
| In vitro | 12.50 (18.75 - 10.00) | 35.97% ± 18.65 | ||||
| Group 1 | In vivo | 20.00 (22.00 - 17.00) | 0.765 | 41.86% ±12.48 | 0.001 | |
| In vitro | 17.00 (25.75 - 12.00) | 22.24% ± 11.78 | ||||
| Group 2 | In vivo | 11.00 (14.50 - 7.50) | 0.977 | 39.74% ± 17.12 | 0.139 | |
| In vitro | 10.50 (14.00 - 8.50) | 49.71% ±13.28 | ||||
Statistical Analysis on all 49 Samples Together
At baseline in vivo and in vitro implants did not show any statistically significant difference in MIT (p = 0.521). No differences were also evidenced between the two models (in vivo and in vitro) over time (p = 0.313) (Table 5).
No significant differences between in vitro and in vivo samples were also found considering separately the two types of implant (Group 1 and Group 2) at baseline (p = 0.765 for Group 1 and p = 0.977 for Group 2), and over time for Group 2 implant (p = 0.139). Otherwise, a statistically significant difference (p = 0.001) in time trend of Group 1 implants was shown between in vivo (41.86% ±12.48) and in vitro models (22.24% ± 11.78) (Table 5).
No side effects were observed after T2 torque registration in orthodontic patients. No dropouts were observed in the clinical study.
DISCUSSION
Torque Loss
Torque loss a week after miniscrew placement showed a mean value of -6.16 Ncm in vivo and -4.50 Ncm in vitro. This difference was not significant and demonstrate the possibility to have a good in vitro model for bone mechanical response evaluation in the first seven days, before new woven bone deposition has started [20]. The study of primary stability should not be focused only on miniscrews placement time-point, but it should consider all the events occurring until the biological reply of the bone becomes predominant. In the first week we observed no difference in torque changes among the two experimental setups. This could suggest that the first phenomena after miniscrews placement are primarily mechanical and not biological, thus related to bone viscoelastics properties and to the damage induced by screw placement.
Stability Over Time
According to the literature, maximum insertion torque is related to screw design, such as to bone characteristics [21, 22]. Particularly, Group 2 screws have a larger depth, which should count for higher MIT [23]; on the other hand they have a larger pitch and a smaller conical length, which are factors decreasing insertion torque [24, 25]. According with what was observed in a previous experimental study involving the same two groups [26], Group 2 screws showed a smaller mean MIT. This might be a consequence of their reduced conical part, which their increased thread depth cannot compensate.
The in vivo study indicates that the torque’s decrease percentage a week after placement (40.9%) is not different among the devices, as well as the difference observed between T3 (screw removal) and T2, and between T3 and T1; this could suggest that all initial differences between the devices in the bone-screw interface did not affect the remodeling rate after the relaxation process.
From a biological point of view, at one week after insertion, the bone-screw interface is in a phase of osteoclastic activity [27] and the bone-screw contact presents a reduced surface.
From a mechanical point of view, the propagation of microcracks produced during insertion might compromise the stability of the mini-implant, so that the differences between the implant types in placement torque and its absolute decrease during the first week could be related to the influence of the depth and shape of the threads and other design variables on the amount of linear microdamage, which is even believed to have a role in targeting active resorption in the cortical bone [28]. This would confirm that the device characteristics play a crucial role in the bone/screw interface, which guarantees primary stability.
The overall tendency of the screw/bone contact tensile force during showed a decrease after a week (T1), and an increase between T2 and T3, when the biological effects become predominant. Nevertheless, the removal torque showed a lower value when compared to the maximum initial torque, but higher than the value observed at T2. The mean maximum removal torque (MRT) had a value of 11.92 Ncm: this means that in our study, at the end of treatment, torque values showed a mean percentage reduction of 23%.
Insertion Torque Graphs
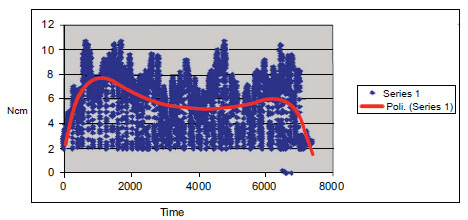
The use of a digital torque sensor and a dedicated software in the in vitro experimental set up allowed us not only to detect MIT, but also to collect data in a continuous mode and to represent them over a graph. Fig. (3) shows a dispersion graph of relative maximum torque values registered during the insertion of a miniscrew.
CONSORT flow chart.
Some variations may be due to differences in the recipient bone block, but the graph pattern we found was qualitatively the same for each group, as well as the way the MIT is reached. Particularly, the initial torque increase is almost linear, but the steepness of the slope could change according to the implant type and bone quality; this may reveal differences in the way the peri-screw bone is compressed by the threads. Moreover, we believe that also the amplitude of the torque oscillations following the linear phase may have a role in describing bone stress. Another interesting finding we observed is when the maximum torque value has been recorded: the highest average torque was not at the end of the placement but in the initial part of the slope. Presumably, this value was reached when the maximum external diameter of the screw engaged the cortical layer; beyond this point no difference in the screw geometry occurred, and the overall torque value constantly decreased. In some cases, a torque peak was registered in the final part of the insertion, probably due to the generated bone compression.
Some clinical considerations could be taken from this preliminary study: considering the loss of stability of unloaded screws after a week, no load should be applied on those miniscrews with low placement torque. Moreover, since insertion torque significantly depend on the miniscrew type, in clinical use some devices exceed Motoyoshi's range [29] and still remain successful. Limitations of this study have to be taken into account, considering that absolute torque values depend on many bone and screw variables, so that there is no evidence to prescribe torque ranges for higher success rates [30]; on the other hand, information on torque percentage reduction is much more a description of bone response. Moreover soft tissue thickness should be measured at the time of insertion in order to guarantee the same insertion depths of all mini-implants. Absolute expected torque values could be used as a reference in clinical practice only if extracted by a database organized according to the screw and bone type. More studies with different study design, latency duration and applied load will be useful.
CONCLUSION
The present study led to the following conclusions:
- Torque loss after miniscrew placement in the first week was observed both in vivo and in vitro.
- The two different miniscrew types that we tested showed a different initial insertion torque, but in vivo the percentage torque loss a week after placement was similar.
- There were no statistically significant differences in torque variations compared to removal day between the two types of miniscrew in the in vivo setting.
- There were no statistically significant differences in insertion torque and in torque loss after the first week between in vivo and in vitro settings.
AUTHORS’ CONTRIBUTIONS
All authors read and approved the final manuscript. Marco Migliorati and Armando Silvestrini Biavati coordinated the study development, participated in its design, performed the experimental part, and wrote the paper. Domenico Dalessandri and Sara Drago participated in drafting the paper and performed the experimental part. Irene Schiavetti was involved in selecting and performing statistical analysis. Fabrizio Barberis and Marco Migliorati were involved in interpreting data and revised the paper critically for important intellectual content. Stefano Benedicenti conceived the study, participated in its design and making substantial contributions to interpretation of data.
CONFLICT OF INTEREST
The authors confirm that this article content has no conflict of interest.
ACKNOWLEDGEMENTS
Declared none.

