
Salivary Biomarkers and their Relationship with Periodontal Clinical Parameters: A Cross-Sectional Study
Authors Info & Affiliations
Abstract
Background:
Traditionally, periodontal clinical parameters are used to diagnose and design standardized treatment plans. The scientific literature has not widely reported the inclusion of salivary biomarkers in this diagnostic and therapeutic process.
Objectives:
To analyze the correlation between salivary biomarkers and periodontal clinical parameters of a group of patients undergoing the periodontal maintenance phase in a private dental office located in the southwest of Colombia.
Material and Methods:
A cross-sectional study was carried out. A sample of 92 patients undergoing the periodontal maintenance phase was analyzed. Conventional periodontal parameters were determined, and salivary biomarkers were measured by chromatography (cariogenic bacteria, acidity, buffering capacity, blood, and erythrocytes). To determine its correlation, a bivariate statistical analysis was developed.
Results:
According to Spearman's correlation matrix, among the periodontal clinical parameters, there were statistically significant correlations between the extension and severity of the complete and proximal attachment loss (r=0.93) and between the bleeding on probing (BOP) and the plaque index (PI) (r= 0.37). Within the salivary biomarkers, a statistically significant correlation was found between acidity and the buffering capacity of saliva (r= -0.54); between buffering capacity and proteins (r=0.36); between blood and erythrocytes (r=0.42); between blood and proteins (r=0.58), and between erythrocytes and proteins (r=0.48). Finally, a statistically significant correlation between periodontal parameters and salivary biomarkers was observed between teeth lost due to periodontal disease and acidity (r=0.26) and between teeth lost and buffer capacity (r=0.30).
Conclusion:
Periodontal parameters and salivary biomarkers correlate with variables of the same group to which they belong. Still, only the variable teeth lost due to periodontal disease correlates with acidity and buffer capacity. The findings suggest that both periodontal parameters and salivary biomarkers should be evaluated throughout the periodontal process. It is possible that both parameters could express different moments of the pathophysiology of the disease.
1. INTRODUCTION
Periodontal disease is an inflammatory process, commonly chronic, that affects the supporting tissues of the teeth and can manifest as gingivitis or periodontitis. Periodontitis is an inflammation of the gingiva, with the presence of periodontal pockets and loss of bone support and clinical attachment. This inflammatory process is triggered by the formation of microbial biofilms inside the gingival sulcus. However, the presence of these biofilms is necessary but not sufficient for the development of the disease [1].
After dental caries, also known as tooth decay, periodontitis is the second most common oral disease and the sixth most prevalent medical condition among 291 health conditions evaluated worldwide. In addition, its prevalence increases with age and in lower-income populations [2]. In Europe, about 50% of adults over 30 years of age suffer or have suffered from some form of periodontitis, and more than 10% have severe chronic periodontitis [3], while in Colombia, the latest National Oral Health Study conducted in 2015, showed a prevalence of periodontal disease in more than 60% of the adult population, a number higher than the prevalence found and reported worldwide [4].
Regarding the approach of periodontal disease, the diagnosis is usually made by the periodontist based on the measurement of periodontal clinical parameters, such as bleeding on probing (BOP), clinical probing depth (CPD), the number of teeth with periodontitis, and the clinical attachment level (CAL). However, the assessment of other biological markers is not part of the regular clinical practice and their use could be of great relevance [5]. The National Institutes of Health (NIH) has defined the term “biomarker” as an objectively measurable biological, physiological, or biochemical characteristic capable of identifying physiological or pathological processes or a response to a therapeutic intervention [6].
Taking into account what has been said above, saliva could be an adequate biological matrix to measure prognostic biomarkers, understood as those that could determine the future course of a condition or disease, likewise, measure predictive biomarkers of response to treatment, which could provide additional information on the state of the pathophysiological process [7] and the effect of the implemented therapeutic strategy. This is due to the ease of obtaining the samples and their representativeness of the oral ecosystem, as well as the possibility of using devices that allow obtaining an immediate result of the salivary biomarkers in the dental office [8].
Recent reports have identified different salivary biomarkers, mainly proinflammatory cytokines, associated with fibrillar collagen degradation and bone resorption, which could provide relevant information on the periodontal condition of patients [9-12]. However, the predictive potential of salivary biomarkers contrasted with periodontal clinical parameters has not been evaluated [13]. The objective of this cross-sectional study was to establish the relationship between salivary biomarkers and periodontal clinical parameters in a group of patients undergoing the periodontal maintenance phase, treated at a private health institution in Sabaneta (Colombia) between 2021 and 2022 to determine the potential that both groups of markers (salivary and periodontal clinical parameters) could contribute to the development of more customized therapeutic alternatives.
2. MATERIALS AND METHODS
An observational cross-sectional study was carried out. It was submitted and approved by the Human Research Ethics Committee of the CES University through Act 149 of July 22, 2020, in conformity with the criteria established by the declaration of Helsinki.
Patients included in the study.
For the present study, 92 patients were recruited at a private health institution in the city of Sabaneta (Latitude: 6.13882045; Longitude: -75.6097499686678), located in the department of Antioquia – Colombia. These patients attended a periodontal maintenance program and were monitored every three months. To be included, patients had to be adults (18 years of age or older) and have completed their active periodontal treatment appointments (scaling and root planing) at the same health institution as the study. Patients who were not periodontally controlled and those who received complete antibiotics treatment in the last three months were excluded. To enter the study, the patients signed an informed consent which was approved by the ethics committee of CES University. They underwent supragingival periodontal scaling, plaque control, and reinforcement in oral hygiene techniques. Additionally, for those patients who presented clinical probing depths (CPD) ≥ 4mm, scaling and root planing were performed in the affected sites. The included patients had different degrees of disease severity, but all had shown a positive response to initial active treatment before entering the maintenance program. The sample size was calculated taking into account a confidence level of 95%, a type I error of 5% for finite populations, and was expanded by 10% to consider possible patient losses [14]. The sample size calculation is shown below:
n= N. Z2(1-a/2).p.q___
e2(N-1)+Z2(1-a/2).p.q
n= ____120. (1.96)2 . (0.50) (0.50)______
(0.05)2 . (120-1)+ (1.96)2 . (0.50) (0.50)
n= 91,61
n= 92
N= Population
n= sample
p= Estimated proportion of the dependent variable
q= 1-p
e= Maximum permissible error
Z= Confidence coefficient
2.1. Measurement of Periodontal Parameters and Salivary Biomarkers
For the measurements, an intra- and inter-examiner standardization was performed, considering the measurements of an experienced periodontist as a reference. From this analysis, an acceptable weighted kappa index of 0.79 was obtained. The 92 patients attended a periodontal assessment at the dental health institution. Periodontal clinical parameters were measured (bleeding on probing, the extent and severity of proximal attachment loss, the extent and severity of complete attachment loss, teeth lost due to periodontal disease, and plaque index). Clinical parameters were evaluated using a periodontal probe designed by the University of North Carolina (UNC-15) and the data was recorded in the medical records of each participant. Through a complete periodontogram, the clinical probing depths, the clinical attachment level, dental mobility, furcation involvement, the amount of keratinized gingiva, and bleeding on probing were recorded. Subsequently, the plaque index (PI) adapted from O'leary was determined, and the patients were instructed on the Bass oral hygiene technique and the modified Stillman technique [15].
| Salivary biomarker | Score to define the level of risk | ||
| Low | Moderate | High | |
| Proteins(score) | 0-35 | 36-50 | 51≤ |
| Buffer Capacity(score) | 0-27 | 28-47 | 48≤ |
| Cariogenic Bacteria(score) | 0-30 | 31-49 | 50≤ |
| Acidity(score) | 0-35 | 36-52 | 53≤ |
| Blood(score) | 0-13 | 14-29 | 30≤ |
| Erythrocytes(score) | 0-35 | 36-60 | 61≤ |
Additionally, the evaluated salivary biomarkers were: buffering capacity, acidity, proteins, blood, erythrocytes, and cariogenic bacteria. The measurements were made using chromatography test strips containing three measurement panels: Dental health (cariogenic bacteria, acidity, and buffering capacity); ammonia, and gingival health (presence of blood, leukocytes, and proteins). For this, the “Salivary Testing Instrument” SiLLHa, designed and validated by the North American company Arkray, was used, following the manufacturer's instructions available at https://www.arkrayusa.com/sites/arkrayusa.com/files/SiLL-Ha_Operating_Manual [16]. At each appointment, patients received 3ml of catalyst solution to rinse their mouth for 10 seconds to later deposit their saliva in a container marked with their name and identification. A dropper was used to apply a sufficient amount of solution on the test strip, which allowed the seven previously described elements to be measured simultaneously. The instrument generated a report in five minutes consisting of a radial diagram and a table specifying the value obtained for each parameter, as well as the level of risk for each biomarker established by the device (high, moderate, or low). The ranges that define the risk for each salivary parameter are shown in Table 1.
2.2. Statistical Analysis
To establish the relationship between periodontal clinical parameters and salivary biomarkers, first, a descriptive analysis was performed. For this, descriptive measures of frequencies (absolute and relative) and central tendency (dispersion and position) were used to characterize the patients. For the representation of the data, frequency histograms were used. The distribution of the quantitative data was verified using the Shapiro-Wilks normality test. In cases where the data distribution was not parametric, the Kruskall-Wallis test and Dunn's post-hoc test with Bonferroni correction were used.
To identify groups that would allow differentiating the behavior of salivary biomarkers and periodontal clinical parameters, a canonical discriminant was used to determine which variables explain the difference between the sample groups, such as gender. The Candisc R statistical package was used to perform the discriminant model [17].
Finally, the level of correlation of the variables was evaluated through a range analysis using the Spearman correlation method due to the non-parametric distribution of the data. The variables were uploaded into the model, and according to the significance level, significant correlations were established for p values <0.05. For the presentation of the correlation matrix, the R Performance Analitycs package was employed [18]. Likewise, the Principal Component Analysis (PCA) was used, under a confirmatory factor analysis, to identify how the variables carry each of the selected components and their level of correlation. All other statistical analyzes were run in the R Stats software and the PlotsR and StatR packages [19].
3. RESULTS
Sociodemographic characteristics of the evaluated patients
The sample consisted of 67% women, while the average age of the participants was 59.1 years (SD 11.2 years). 48% completed technical and professional education, while 32% concluded high school.
3.1. Periodontal Parameters and Salivary Biomarkers
A first illustration of the periodontal parameters and the salivary biomarkers of the patients included in the study is presented in Table 2. Within the periodontal parameters are the extent and severity of complete attachment loss, extent and severity of proximal attachment loss, BOP (bleeding on probing), and PI (plaque index). Regarding the salivary biomarkers, the variables observed are buffering capacity, acidity, blood, erythrocytes, and proteins. Other biological variables, such as Body Mass Index (BMI) and sociodemographic variables, such as age, were considered. The ammonia variable was excluded from the analysis because the software update by the device manufacturer during the study prevented its measurement in some patients.
| Descriptive analysis of the Base-Line | Shapiro-Wilk | ||||||
| Variable | Median | IQR | Min | Max | CV (%) | W | p |
| Periodontal Parameters | - | - | - | - | - | ||
| Severity of complete attachment loss (mm) | 2.96 | 0.685 | 1.52 | 4.83 | 21.52 | 0.94 | <.001 |
| Severity of proximal attachment loss (mm) | 2.94 | 0.678 | 1.55 | 5.70 | 23.06 | 0.91 | <.001 |
| BOP (%) | 10.00 | 15.53 | 0.00 | 61.10 | 100.00 | 0.87 | <.001 |
| PI (%) | 15.00 | 10.7 | 0.00 | 45.10 | 64.10 | 0.97 | 0.03 |
| Teeth lost due to periodontal disease (#) | 4.00 | 4.63 | 0.00 | 19.00 | 100.00 | 0.88 | <.001 |
| Salivary Biomarkers | - | - | - | - | - | - | |
| Buffering capacity (score) | 35.00 | 29.25 | 0.00 | 100.00 | 66.47 | 0.96 | 0.00 |
| Blood(score) | 35.50 | 33.50 | 0.00 | 96.00 | 62.79 | 0.95 | 0.00 |
| Erythrocytes (score) | 60.00 | 29.25 | 4.00 | 93.00 | 37.26 | 0.96 | 0.01 |
| Proteins(score) | 65.00 | 34.00 | 20.00 | 100.00 | 30.96 | 0.97 | 0.02 |
| Acidity(score) | 65.50 | 21.01 | 0.00 | 100.00 | 32.08 | 0.97 | 0.02 |
| Patient characteristics | - | - | - | - | - | - | |
| BMI | 25.00 | 5.13 | 17.60 | 33.90 | 14.87 | 0.99 | 0.49 |
| AGE(Years) | 60.00 | 13.5 | 22.00 | 80.00 | 18.75 | 0.97 | 0.07 |
According to the Shapiro-Wilks normality test, most of the variables showed non-parametric behaviors, except for the variables BMI and age, which is why medians are presented as measures of position and interquartile ranges (IQR) as measures of dispersion. In the same way, the coefficient of variation was calculated to explore possible behaviors that would indicate the need to discriminate the sample by groups. Those variables that presented coefficients of variation (CV) greater than 30% showed heterogeneous distribution. This is the case of the BOP and the PI in the periodontal parameters and the variables buffer capacity, erythrocytes, and blood in the salivary biomarkers. Likewise, the scores obtained for the salivary biomarkers show a high risk of periodontal disease and caries in the evaluated patients, except in the buffering capacity, in which the risk was moderate according to the interpretation of the results obtained by the salivary analysis device (Radial model of risk). Regarding the severity of periodontal disease, it was found that the severity parameters of complete and proximal attachment loss showed medians of 2.96 and 2.94, respectively. On the other hand, it was found that approximately 50% of the sample suffers from stage II periodontitis according to the 2018 classification of periodontal and peri-implant diseases [20].
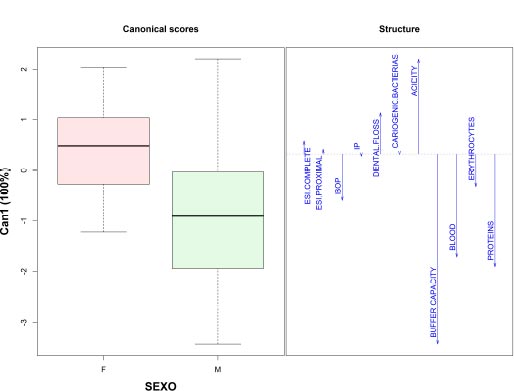
It was observed that the high coefficients of variation registered for the periodontal parameters BOP and PI (100% and 64%, respectively) are explained by an asymmetric distribution of the data. Thus, variables such as socioeconomic level and gender were included in the discriminant analysis, finding that only the gender variable was able to adequately discriminate patients, taking into account clinical parameters and salivary biomarkers (Fig. 1).
The discriminant analysis managed to classify 100% of the female patients and differentiate them from the males, with an explained variance of 100%. Other behavioral and biological variables were included during the exploration. Female patients had higher acidity values, used dental floss more frequently, had higher fasting blood glucose values, and had a tendency to obesity due to higher BMI values according to gender. On the other hand, men presented higher values in the variables buffer capacity, blood, and salivary proteins, as well as a higher frequency of smoking and alcohol consumption.
In this way, the buffering capacity and blood variables differed according to gender, showing that men had higher values for both salivary parameters. Table 3 shows the behavior of all the variables analyzed according to the gender of the patients.
| 95% CI | Shapiro-Wilk | Significant Diff. | |||||||
| Variable | Gender | Med. | IQR | LI | LS | W | p | Test | p |
| Severity of complete attachment loss (mm) | F | 3.01 | 0.70 | 2.93 | 3.26 | 0.95 | 0.011 | Kruskall-Wallis | 0.82 |
| M | 2.90 | 0.56 | 2.85 | 3.28 | 0.90 | 0.007*** | |||
| Severity of proximal attachment loss (mm) | F | 2.95 | 0.73 | 2.93 | 3.28 | 0.92 | <.001*** | Kruskall-Wallis | 0.74 |
| M | 2.91 | 0.46 | 2.89 | 3.31 | 0.87 | 0.002 | |||
| BOP(%) | F | 9.95 | 15.48 | 9.50 | 14.95 | 0.85 | <.001*** | Kruskall-Wallis | 0.44 |
| M | 10.65 | 15.73 | 9.67 | 16.87 | 0.88 | 0.003 | |||
| PI(%) | F | 14.50 | 9.53 | 12.70 | 17.78 | 0.96 | 0.04 | Kruskall-Wallis | 0.49 |
| M | 17.20 | 9.30 | 12.71 | 18.74 | 0.95 | 0.142 | |||
| Teeth lost due to periodontal disease (#) | F | 4.00 | 6.00 | 4.37 | 6.81 | 0.89 | <.001*** | Kruskall-Wallis | 0.43 |
| M | 4.00 | 3.00 | 3.12 | 6.12 | 0.85 | <.001*** | |||
| Cariogenic bacteria(score) | F | 25.00 | 32.00 | 22.86 | 34.37 | 0.93 | 0.002*** | Kruskall-Wallis | 0.9 |
| M | 31.00 | 45.50 | 19.23 | 37.83 | 0.90 | 0.008*** | |||
| Acidity(score) | F | 71.00 | 26.50 | 63.76 | 72.63 | 0.98 | 0.249 | Kruskall-Wallis | 0.13 |
| M | 64.00 | 29.25 | 49.54 | 67.86 | 0.95 | 0.194 | |||
| Buffering capacity(score) | F | 32.00 | 20.00 | 28.67 | 36.33 | 0.99 | 0.69 | Kruskall-Wallis | 0.01** |
| M | 54.00 | 35.25 | 44.66 | 65.47 | 0.96 | 0.276 | |||
| Blood(score) | F | 33.50 | 27.75 | 29.88 | 40.05 | 0.95 | 0.016 | Kruskall-Wallis | 0.04*** |
| M | 42.00 | 34.50 | 37.30 | 54.77 | 0.95 | 0.177 | |||
| Erythrocytes(score) | F | 59.00 | 27.25 | 47.87 | 58.75 | 0.96 | 0.027 | Kruskall-Wallis | 0.57 |
| M | 61.00 | 32.25 | 47.10 | 64.03 | 0.95 | 0.171 | |||
| Proteins(score) | F | 62.00 | 28.25 | 57.69 | 67.22 | 0.97 | 0.192 | Kruskall-Wallis | 0.01** |
| M | 80.50 | 33.50 | 66.59 | 81.08 | 0.93 | 0.037 | |||
| BMI | F | 24.20 | 4.78 | 23.59 | 25.41 | 0.98 | 0.425 | T-test | 0.55 |
| M | 26.75 | 4.93 | 25.72 | 28.12 | 0.98 | 0.881 | |||
3.2. Correlation between Periodontal Parameters and Salivary Biomarkers
The salivary biomarkers buffer capacity, blood, and proteins showed a statistically significant difference between genders, with male patients showing higher average values compared to females. It was also observed that some of the variables (severity of complete attachment loss in men, the severity of complete attachment loss in women, BOP in women, and teeth lost and cariogenic bacteria in men and women) showed a parametric distribution with the Shapiro-Wilk test. Regarding salivary biomarkers, these always displayed higher values in men than in women. The BMI did not show a statistical difference between genders. For example, according to the buffering capacity of saliva, the risk of periodontal disease was moderate in women and high in men, as for the other biomarkers, the risk was high regardless of gender according to the interpretation of the values of the SillHa device.
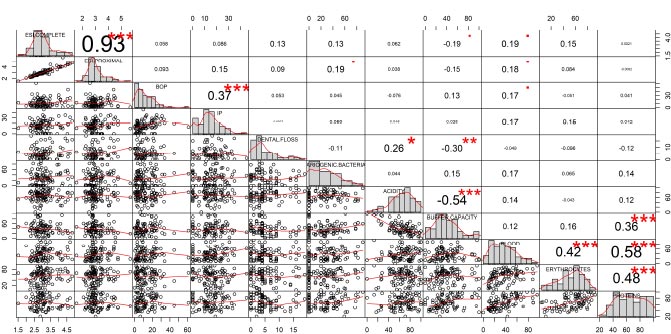
Fig. (2) shows the results of the Spearman correlation matrix. Among the periodontal clinical parameters, there were statistically significant correlations between the severity of complete and proximal attachment loss (r=0.93) and between bleeding on probing (BOP) and plaque index (PI) (r= 0.37). Within the salivary biomarkers, a statistically significant correlation was found between acidity and the buffering capacity of saliva (r= -0.54); between buffering capacity and proteins (r=0.36); between blood and erythrocytes (r=0.42); between blood and proteins (r=0.58) and between erythrocytes and proteins (r=0.48). Finally, between periodontal parameters and salivary biomarkers, a statistically significant correlation was observed between teeth lost due to periodontal disease and acidity (r=0.26) and between teeth lost and buffer capacity (r=0.30).
The salivary biomarker Cariogenic bacteria was the only one that did not show a correlation with any of the other variables included in the analysis.
Finally, to confirm the possibility of some kind of relationship between periodontal parameters and salivary biomarkers, a principal component analysis (PCA) was performed using the VARIMAX rotation. Table 4 shows the discrimination of the variables into two components established by the software, taking into account the factor loading of each variable. It was observed that the variables analyzed in the periodontal parameters were grouped into the same component (PC1), and the variables described as salivary biomarkers were grouped into a second component (PC2), reaffirming that due to the information provided by each variable, there is a tendency to group them according to their nature.
| Component | |||
| Variable | 1 | 2 | Uniqueness |
| Severity of complete attachment loss (mm) | - | 0.78 | 0.383 |
| Severity of proximal attachment loss(mm) | 0.766 | 0.408 | |
| BOP(%) | - | 0.66 | 0.56 |
| PI(%) | - | 0.453 | 0.79 |
| Teeth lost due to periodontal disease(#) | - | - | 0.92 |
| Acidity(score) | - | - | 0.982 |
| Buffer Capacity(score) | 0.514 | - | 0.735 |
| Blood(score) | 0.714 | - | 0.488 |
| Erythrocytes(score) | 0.68 | - | 0.528 |
| Proteins(score) | 0.845 | - | 0.285 |
| Cariogenic bacteria(score) | 0.306 | 0.847 | |
4. DISCUSSION
This study presents an innovative approach to periodontal research by proposing the inclusion of salivary biomarkers within the diagnosis, the prediction of periodontal disease treatment, and its follow-up. To the knowledge of the authors, this is one of the first reports that seek to establish whether there is a correlation between periodontal clinical parameters and salivary biomarkers in patients undergoing periodontal maintenance, to understand whether the information provided by these biomarkers is similar or not to the information provided by the periodontal clinical parameters traditionally used.
The findings reported here are related to those proposed by other authors, such as Baliga et al., who evaluated the salivary pH of 300 patients with different periodontal health statuses (healthy, with gingivitis, and with periodontitis) in a cross-sectional study, reporting that patients with gingivitis had a more alkaline salivary pH, whereas periodontitis patients had a more acidic salivary pH. Given this, salivary pH could identify which patients with periodontitis might be more susceptible to developing dental caries [21]. Similarly, in this study, acidity was negatively correlated with saliva's buffering capacity (r= -0.54), which may increase susceptibility to dental caries. In the study conducted by Shaila et al., salivary biomarkers were evaluated in healthy patients, patients with gingivitis, and patients with periodontitis. The authors reported that the concentration of proteins and albumin was higher in patients with periodontitis and lower in healthy patients [22]. In the same way, the present study found that the proteins in saliva were positively correlated with blood (r= 0.58), evidencing that the patient with more proteins is more likely to display blood in saliva. However, it is important to note that the patients in this study were in a periodontal maintenance program. Therefore, they are expected to maintain low levels of periodontal parameters such as PI and BOP.
Saliva is a fluid that is easy to obtain and useful for determining the levels of salivary biomarkers. Several authors have mentioned the relevance of evaluating these biomarkers in patients with periodontitis due to the alteration that occurs in their levels as the inflammatory process characteristic of periodontitis increases [23]. On the other hand, it has been suggested that volatile compounds such as ammonium, produced by bacterial metabolism, may be found to be increased in patients with periodontal pockets [24], likewise, the presence of blood may be associated with ulcerations of the gingival sulcus epithelium [25]. In this study, ammonium had to be excluded due to errors in the test strips of the first batch used, so this comparison was not made, but the literature recognizes the importance of the information that this biomarker could provide for the prediction of response to periodontal treatment.
The use of salivary biomarkers in clinical practice represents an approach to precision medicine [26] since it promotes the individualization of the diagnosis and the design of treatment plans for periodontal patients, different from the standardized treatment. The present study recognizes certain methodological limitations, such as the difficulty of measuring specific salivary biomarkers of the inflammatory process, also, the high costs of laboratory tests that make this field of research difficult in developing countries. Further studies that can assess specific biomarkers are required. It would also be of great value for government entities and health institutions to recognize the contributions of cell and molecular biology in non-communicable chronic diseases, within which periodontal disease can be included [27].
This study had limitations, such as not including the clinical probing depth (CPD) as an independent variable in the analysis. Only the severity of the complete and proximal clinical attachment loss (history of the disease) was considered. Likewise, the analysis of ammonium as a salivary biomarker was not possible, and this variable could be representative due to its high capacity to provide relevant information on bacterial activity and metabolism.
CONCLUSION
The findings of this study indicate that periodontal parameters and salivary biomarkers correlate with variables of the same group to which they belong but not with each other, indicating that both salivary biomarkers and periodontal parameters should be evaluated during different stages and degrees of the periodontal process since they express different moments of the pathophysiology of the disease.
ETHICS APPROVAL AND CONSENT TO PARTICIPATE
It was submitted and approved by the Human Research Ethics Committee of the CES University through Act 149 of July 22, 2020.
HUMAN AND ANIMAL RIGHTS
No animals were used in this research. All procedures performed in studies involving human participants were in accordance with the ethical standards of institutional and/or research committees and with the 1975 Declaration of Helsinki, as revised in 2013.
CONSENT FOR PUBLICATION
Informed consent was obtained from all participants.
STANDARDS OF REPORTING
STROBE guidelines were followed.
AVAILABILITY OF DATA AND MATERIALS
The data supporting the findings of the article is available in the Ces University repository at https://repository.ces.edu.co/
FUNDING
Latin American oral health association (LAOHA).

