
Roughness and Microhardness of Demineralized Enamel Treated with Resinous Infiltrants and Subjected to an Acid Challenge: An in vitro Study
Authors Info & Affiliations
Abstract
Background:
Resinous infiltrating has proven effective in arresting incipient caries lesions.
Objective:
This study aimed to assess the penetration depth of an experimental resin-infiltrant (75% - TEGDMA, 25% - Bis-EMA, 1% - EDAB, 0.5% camphorquinone), compare it with commercial infiltrant Icon®, and analyze the surface-roughness and microhardness of the resin-materials infiltrated into tooth specimens, before and after pH cycling.
Methods:
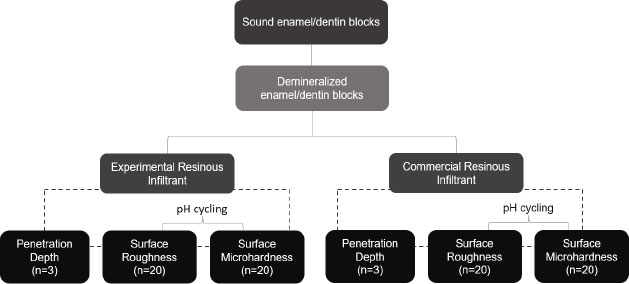
To assess penetration depth, sound third molar specimens were submitted to ten de-remineralization cycles for incipient carious lesion induction and were then randomly divided into 2 groups (n=3): (I) Experimental Infiltrant (EI) and (II) Commercial Infiltrant Icon (CI). After resin infiltration into specimens, qualitative Confocal Fluorescence Microscopy images were captured. For roughness and microhardness assessment, new specimens were demineralized, then randomly divided into two groups (n=20): (I) Experimental Infiltrant (EI) and (II) Commercial Infiltrant Icon (CI) and submitted to roughness and microhardness readouts at the following time-intervals: (T1) sound tooth, (T2) white-spot caries lesion, (T3) resin material that infiltrated, and (T4) resin material that infiltrated and was exposed to pH-cycling. In statistical analyses, generalized linear models of repeated measures in time were applied, with a significance level of 5%.
Results:
The experimental infiltrant penetrated the carious lesion and exhibited lower roughness values after its application, even after pH cycling, similar to the CI. The microhardness value of the EI group was significantly lower in the last three-time intervals evaluated compared to CI.
Conclusion:
Experimental resin infiltrant was efficient in penetrating white spot lesions and reducing surface roughness; however, it did not increase surface microhardness.
1. INTRODUCTION
Up to now, dental caries continues to be considered a multifactorial chronic disease that affects the majority of children and a large portion of the adult population [1, 2]. Moreover, control or elimination of this disease is directly related to dietary control, biofilm removal, and the use of fluoride [3]. Daily use of fluoride present in toothpaste has been considered the main strategy for the decline in caries in recent decades [4]. Furthermore, other methods, such as varnishes, mouthwashes, and fluoride gels, have been widely used in the prevention and remineralization of carious lesions [5]. In all of these strategies, the goal is to interrupt caries lesion progression [5]. However, non-invasive treatments normally require multiple sessions and stricter follow-up in the long term, involving patient cooperation to a large extent, which is sometimes difficult to obtain [5].
Based on the previous data, with the aim of achieving a therapeutic intervention for incipient caries lesions, performed as quickly and efficiently as possible, thereby promoting maintenance of the tooth structure integrity, the infiltrative technique with a light polymerizing resin agent known as resin infiltrant was implemented [5]. This technique is indicated for application in incipient caries lesions, up to the external third of dentin, present in the smooth surfaces of primary and permanent teeth [5]. In addition, this infiltrant can also be applied to fluorotic, hypomineralized, or hypoplastic white spots for the purpose of masking and improving the esthetic appearance of teeth [5]. The material used in this approach was developed by researchers in Berlin, Germany, and sold under the name of Icon (DMG America Company, Englewood, NJ) [1, 5].
The infiltrant is known as a low-viscosity resin with a high penetration coefficient (> 200 cm/s). Its resin matrix is based on the triethylene glycol dimethacrylate (TEGDMA) monomer, in addition to the initiators and additives (according to the manufacturer) [5]. Its mechanism of action occurs by perfusion of porous enamel using capillary forces so that the pores of the body of the carious lesion are filled, thus interrupting the demineralization and ensuring stabilization of this lesion [5]. However, in spite of the high degree of fluidity of this material, a characteristic that guarantees greater penetration depth into the lesion body, this is a highly hydrophilic type of monomer that tends to generate low mechanical properties. This may lead to a high level of hydrolytic degradation in the oral environment and polymerization shrinkage due to its low molecular weight [6]. Considering this, new studies have been conducted and have suggested changes in the chemical structure of experimental resin infiltrants, with the purpose of achieving enhanced properties of the material, without compromising the fluidity of the composite [5, 7, 8].
Monomers, such as bisphenol A-glycidyl methacrylate (BisGMA) or ethoxylatedbisphenol A dimethacrylate (BisEMA), have been added to the composition of experimental resin infiltrants in conjunction with TEGDMA, with the aim of reducing its hydrophilicity, making it more hydrophobic, and improving its mechanical properties [1, 6, 9-11]. BisEMA has a molecular structure that is very similar to that of BisGMA, with the only difference being the absence of hydroxyl groups, which lowers its molecular weight when compared with BisGMA. This could be the reason for choosing it for association with TEGDMA [6]. However, both have a higher molecular weight than TEGDMA, therefore promoting a reduction in polymerization shrinkage of the material [6, 11].
Furthermore, the oral environment is considered a very dynamic environment since there are constant changes in salivary flow, enormous microbiological diversity, and variations in pH [12]. Even if caries white spot lesions are infiltrated with resin materials, thereby halting them, the above-mentioned variations lead to posing constant physicochemical challenges to both the teeth and restorative materials, capable of causing structural changes in both substrates. These factors can promote changes in the surface roughness and microhardness of the tooth and restorative material, compromising its protective action, thus favoring the accumulation of biofilm and, consequently, recurrent carious lesions [12]. Therefore, pH cycling models are used to mimic these changes in the pH of the oral environment for the purpose of assessing the resin infiltrant resistance to acid challenge [12].
The efficacy of resin infiltrant is directly related to its ability to penetrate the body of the carious lesion. Despite knowing that the resinous material is capable of penetrating the pores of the demineralized enamel and promoting the protection of the area affected, there are still few studies on the depth of infiltration reached by the resin infiltrant and its behavior when faced with pH variations. Therefore, this study aimed to assess the penetration depth of an experimental resin infiltrant compared with the commercial infiltrant Icon® and analyze the surface roughness and microhardness of resin materials infiltrated into dental fragments before and after pH cycling. The null hypotheses tested in this study were: (I) There would be no difference between experimental and commercial resin materials, (II) There would be no difference between the time intervals: (T1) sound tooth, (T2) white spot caries lesion, (T3) resin material that infiltrated and (T4) resin material that infiltrated and was exposed to pH cycling, and (III) there would be no interaction between the material and time.
2. METHODOLOGY
2.1. Sample Reparation and Induction of Artificial White Spot Caries Lesions
Sound human third molars were collected after obtaining approval from the Research Ethics Committee of the School of Dentistry of Piracicaba (No. CAAE 23041019.7.0000.5418). After selecting the teeth, they were cleaned using a scalpel blade (Lamedid, São Paulo, Brazil) and a Robson brush (Microdont, São Paulo, Brazil) with pumice stone paste (AAF do Brasil, Londrina, Brazil) and water, so that debris was removed. Subsequently, the teeth were stored in 0.1% thymol solution (Sigma Aldrich, Steinheim, Germany) until they were fragmented. After extracting their roots, the teeth were sectioned longitudinally in the mesio-distal direction by means of a precision cutter (Buehler LTD., Lake Bluff, IL, USA). Then, they were polished in a metallographic polisher (Arotec, São Paulo, Brazil) with water abrasive paper grit 600, 1200, and 2000 (Sandpaper sheets, Norton, Guarulhos, Brazil) and felt disk and diamond solution (1µm; Buehler), under cooling. Afterward, an area of 4x4 mm was demarcated in the region of the polished tooth enamel, and all other surfaces of the specimens were covered with acid-resistant varnish (Colorama®, São Paulo, Brazil). After preparation, the specimens were randomly divided into two groups: (I) Experimental Infiltrant (EI) and (II) Commercial Infiltrant Icon (CI), for the analyses of penetration depth (n=3), qualitatively, and roughness and microhardness (n=20), quantitatively. For the qualitative analyses, the sample size of 20 specimens in each group provided a test power of at least 80% (β=0.20), with a significance level of 5% (α=0.05) and minimum detectable effect size d=0.91. The calculations were performed in the G*Power program (version 3.1.9.7), released on January 17th, 2020.
For induction of the artificial carious lesions, all specimens were immersed daily in 50 mL of a demineralizing solution composed of 0.075 M CH3COOH, 1.0 mM CaCl2, 2.0 Mm KH2PO4, pH 4.4, for a period of 6 h. After this, they were removed and washed with deionized water for 10 s and then placed in 25 mL of a remineralizing solution composed of 150 mM KCl, 1.5 mM CaCl2, 0.9 mM KH2PO4, NH2C(CH2OH)3 20 Mm, pH 7.0, for a period of 18 h, totaling ten cycles of de-remineralization, considering a cycle of 24 h. This protocol of white spot lesion induction was based on the study of Al-Obaidi et al., where different amounts of de-remineralization cycles were evaluated, and it was observed that with 7 or 8 cycles, it was possible to visualize changes in the dental enamel [13]. After de-remineralization cycles, the specimens were stored in Eppendorf tubes under relative humidity at 37 ºC. Fig. (1) shows the experimental design of this study.
2.2. Manipulation of the Experimental Infiltrant
For manipulation of the experimental infiltrant, the base monomers composed of BisEMA and TEGDMA were used and incorporated into a photoinitiator system composed of camphorquinone (CQ) and the tertiary amine (Dimethylamino)ethyl benzoate (EDAB). This composition was based on a previous study conducted by Gaglianone et al. [9], in which good performance of the resin material was observed with respect to penetration depth and degree of conversion, for example, when compared with the commercial infiltrant and other experimental compositions. The material was manipulated in a dark laboratory room, under yellow lighting, at controlled temperature and humidity. The concentration of each component is described in Table 1. A high-precision analytical balance (Shimadzu, São Paulo, Brazil) was used to weigh the materials during the manipulation process. After mixing all the previously weighed components, the container containing the mixture was taken to the analog magnetic stirrer (7Lab, Rio de Janeiro, Brazil) for 30 min to homogenize the resin material. Afterward, the experimental resin infiltrant was kept under refrigeration at 4 ºC until the sample infiltration stage was performed.
| Resin Infiltrants | Composition |
| Experimental Resin Infiltrant | 75% TEGDMA 25% BisEMA 1% EDAB 0.5% CQ |
| Icon® Resin Infiltrant | TEGDMA, initiators and additives |
| TEGDMA: Triethylene Glycol Dimethacrylate; Bis-EMA: Bisphenol Hydroxyethyl Methacrylate - resin monomers. EDAB: Ethyl 4-dimethylaminobenzoate; CQ: Canphoquinone - Photoinitiator system. | |
2.3. Penetration Depth Assessment
After the formation of white spot caries lesions, the specimens were submitted to commercial (Icon®, lot:214202) (n=3) and experimental resin infiltration (n=3). Thus following the manufacturer's guidelines (Icon® Etch, DMG, Hamburg, Germany), the specimens were initially conditioned with 15% hydrochloric acid for 2 min. Afterward, they were washed with a jet of water for 30 s and immersed in an ethanol solution of 0.1% rhodamine B (Sigma Aldrich, Steinheim, Germany) for 12 h in order to fill the accessible pores (after de-remineralization) with rhodamine B for later visualization under confocal microscopy. After 12 h, these specimens were removed from the dye solution, washed with a jet of water for 30 s, and dried with a jet of air for another 30 s. In the next steps, Icon® Dry (99% ethanol) was applied for 30 s, and the infiltrants were applied for 3 min and light-cured for 40 s using an LED light-curing device (Valo, Ultradent, São Paulo, Brazil). In accordance with the manufacturer's recommendation, the infiltrants were re-applied for another 1 min and then lighted cured for 40 s. The experimental infiltrant was applied to the free surfaces of the tooth by using a 5 mL plastic syringe protected from light with black insulating tape and an applicator tip that was provided with the Icon® kit.
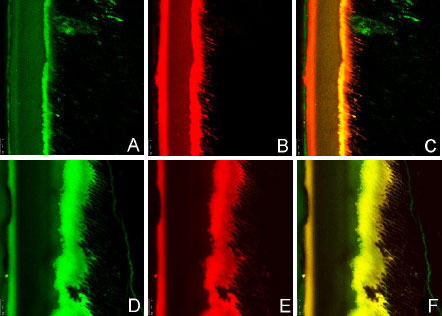
All specimens infiltrated with the resinous materials were subsequently sectioned into slices perpendicularly to the lesion surface using a diamond disc adapted to a metallographic cutter. The specimens were initially polished with water abrasive paper grit 600, 1200, and 2000, under cooling, and subsequently, by hand until a thickness of 100 µm was reached. To remove rhodamine B not adhering to the tooth structure, the slices were immersed in 30% hydrogen peroxide for 12 h, as the protocol for confocal microscopy analysis. Afterward, for the purpose of analyzing the regions of the lesion where no infiltration had occurred, the slices affected were immersed in an ethanol solution of sodium fluorescein at 100 µm (NaFl; Sigma Aldrich, St. Louis, USA) for 3 min. After washing with deionized water for 10 s, these slices were examined with a Confocal Fluorescence Microscope (Leica, TCS NT; Leica, Heidelberg, Germany) with a 63x 1.4NA objective and immersion in oil, in dual fluorescence mode, in which fluorescence could be detected simultaneously (Rhodamine B: Ex 568 nm, at 590 nm lon pass filter; sodium fluorescein Ex 488 nm, 520/50 nm bond pass filter). The penetration depth of resin infiltrates was qualitatively evaluated from the images obtained.
2.4. Surface Roughness and Microhardness of the Material Infiltrated
For analysis of the surface roughness and microhardness, new tooth specimens were used, which had previously been approved by the Research Ethics Committee of the School of Dentistry of Piracicaba (No. CAAE 23041019.7.0000.5418). Preparation of the specimens and induction of the artificial white spot caries lesions were performed in the same way as described in Item 2.1. After preparation, the specimens were randomly divided into two groups: (I) Experimental Infiltrant (EI) (n=20) and (II) Commercial Infiltrant Icon (CI) (n=20) (lot:214202). The specimens were measured using a rugosimeter (Surfcorder model SE1700, Kosaka corp, Tokyo, Japan) after previously being fixed with pink wax 7 (Lysanda, São Paulo, Brazil) to an acrylic plate to stabilize during the readout procedure. Three surface roughness readouts were taken, and the mean values were obtained. In the rugosimeter, the cut-off (distance over which the data were collected traveled by the pen) was 0.25 mm, and the reading length was 1.25 mm. The radius from the point of tracing was 2 μm under a force of 0.75 mN at a speed of 0.1 mm/s [12]. Subsequently, the same sound tooth specimens were examined using a microdurometer (Shimadzu HMV-2000), where 3 indentations were made in the center of the sound enamel surface, with a distance of 100 nm between them, using a Knoop indenter under a load of 50 g, in a time of 5 sec. After measuring the roughness and microhardness of the sound tooth, these specimens were submitted to the formation of the incipient caries lesions. Then, they were analyzed for surface roughness and microhardness again, but this time, in the demineralized region.
After this, these specimens were infiltrated according to their groups, in accordance with the instructions of the Icon® resin infiltrant manufacturer, as follows: the specimens were initially conditioned with 15% hydrochloric acid for 2 min. Afterward, they were washed with water and dried for 30 s at each step. In the next steps, Icon® Dry (99% ethanol) was applied for 30 s, and the infiltrants were applied for 3 min and light-cured for 40 s using the LED light-curing device (Valo, Ultradent, São Paulo, Brazil). In accordance with the manufacturer's recommendation in each group, the infiltrants were re-applied for another 1 min and then light-cured for 40 s. The experimental infiltrant was applied to the free surfaces of the tooth by using a 5 mL plastic syringe, protected from light with black insulating tape and an applicator tip that was provided with the Icon® kit.
After infiltration of resin materials, all specimens were again submitted to surface roughness and microhardness analysis. This time, the white spot caries lesion was infiltrated with resin materials. In the next step, the same specimens had half of the infiltrated area protected with acid-resistant varnish and were subjected to the same pH cycling (described before) that initially generated the artificial white spot caries lesions in order to evaluate the behavior of materials infiltrated when faced with the acid challenge, commonly found in the oral environment. After the period of 10 alternative pH cycles, these specimens were, once again, used for surface roughness and microhardness analyses, but now the factor in question was the assessment of the white spot caries lesions infiltrated with the resin materials and exposed to the acid challenge. Thus, the surface roughness and microhardness values were obtained at four different time intervals.
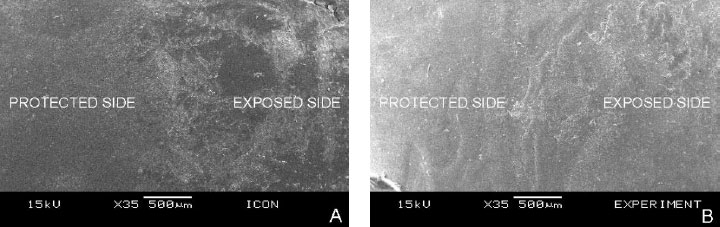
2.5. Scanning Electron Microscopy (SEM)
Specimens of each group (Icon® and experimental) were fixed to a round acrylic plate using double-sided adhesive tape. Then, they were sputtered-coated with gold (Bal-tec SCD050) and examined by a scanning electron microscope (JEOL JSM 5600PV, Tokyo, Japan) for analysis and comparison of the roughness of the infiltrated surfaces protected from, and infiltrated surfaces exposed to acid challenge, at 35x magnification of the most representative area of the samples.
2.6. Statistical Analysis
The analyses were performed with the R* Program [14]. Initially, descriptive and exploratory data analyses were performed. As the data did not meet the assumptions of an analysis of variance (ANOVA), generalized linear models for repeated measures over time were applied. In all analyses, a significance level of 5% was considered.
3. RESULTS
3.1. Depth of Penetration of Infiltrants
The qualitative images of the penetration depth of the Icon (CI) and Experimental (EI) resin materials infiltrated into the white spot caries lesions, captured by confocal fluorescence microscopy, are shown in Fig. (2). From the representative images, it is possible to observe that both groups were able to infiltrate into the artificially induced white spot caries lesions. The images referring to the Icon Group demonstrated a denser layer of resin material when compared with the Experimental Group. However, the experimental infiltrant exhibited better homogenization within the porous body than the commercial infiltrant.
3.2. Surface Roughness and Microhardness of the Material Infiltrated
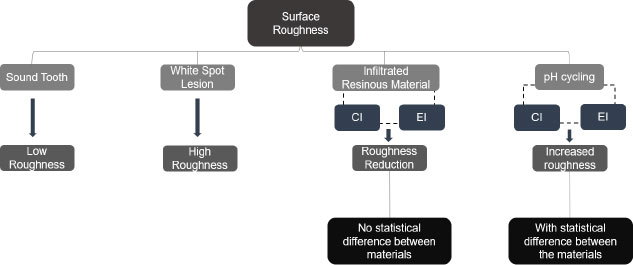
The surface roughness differed significantly in the three-time intervals evaluated (Table 2 and Fig. 3). Higher surface roughness values can be observed in time interval 2 (T2) (white spot caries lesion) for both groups. In time interval 3 (T3), after infiltration of the resin materials tested, a significant reduction in these roughness values can be seen compared with time interval 2 (T2). Whereas in time interval 4 (T4), once again, there is an increase in surface roughness in comparison with time interval 3 (T3), but smaller when compared with the values in time interval 2 (T2), that is, in the roughness of carious lesion. As regards the materials analyzed, both were able to reduce the surface roughness of the demineralized area after infiltration, with no statistical difference between them. In time interval 4, however, the roughness values were significantly higher for the group experimental infiltrant, thus verifying a significant interaction between the material and time factors for roughness.
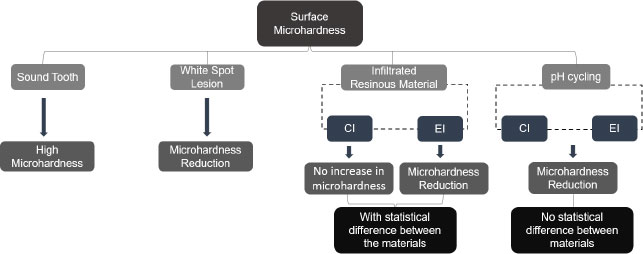
Table 3 and Fig. (4) show the results obtained by analyzing the surface microhardness data, indicating a significant interaction between material factors and time. In time interval 2 (T2) (white caries lesion), the microhardness values were observed to be statistically similar between the groups. In time interval 3 (T3), the statistical difference could be observed only for the experimental infiltrant, showing a lower microhardness value when compared with the value in time interval 2 (T2). Whereas in time interval 4 (T4), the surface microhardness value was significantly reduced for the two groups tested. Regarding the materials studied, in the Group Icon, there was no statistical change in the microhardness of the demineralized area after it had been infiltrated (time interval 3 [T3]). Whereas in the Experimental Group, a significantly lower microhardness value was obtained after infiltration was performed compared to Group Icon. For the Icon infiltrant, microhardness values were significantly lower in time interval 4 (T4) than in the other time intervals. Whereas the experimental infiltrant showed a significant decrease in microhardness values over time.
| Time | Material | |||
|---|---|---|---|---|
| Infiltrant Icon | Experimental Infiltrant | |||
| Mean (Standard Deviation) | Median (Minimum and Maximum Value) | Mean (Standard Deviation) | Median (Minimum and Maximum Value) | |
| Time Int. 1 Time Int. 2 Time Int. 3 Time Int. 4 |
0.57 (0.81) Ac 2.66 (0.74) Aa 0.54 (0.13) Ac 0.83 (0.32) Bb |
0.31 (0.18; 3.80) 2.61 (1.43; 4.45) 0.56 (0.23; 0.78) 0.70 (0.46; 1.42) |
0.37 (0.22) Ad 3.05 (0.8) Aa 0.65 (0.36) Ac 1.30 (0.57) Ab |
0.35 (0.22; 1.25) 3.36 (1.36; 4.77) 0.52 (0.25; 1.49) 1.16 (0.41; 2.73) |
| Time | Material | |||
|---|---|---|---|---|
| Icon Infiltrant | Experimental Infiltrant | |||
| Mean (Standard Deviation) | Median (Minimum and Maximum Value) | Mean (Standard Deviation) | Median (Minimum and Maximum Value) | |
| Time Int. 1 Time Int. 2 Time Int. 3 Time Int. 4 |
284.22 (41.89) Aa 125.54 (38.51) Aa 140.86 (50.67) Aa 79.77 (16.86) Ab |
294.36 (214.52; 345.13) 122.84 (69.94; 184.30) 123.35 (85.94; 252.83) 80.03 (54.44; 130.26) |
275.95 (42.74) Aa 150.41 (42.28) Aa 95.41 (37.66) Bb 74.47 (16.15) Ac |
275.15 (208.54; 349.280) 151.99 (75.56; 247.76) 79.68 (55.30; 174.79) 74.87 (53.24; 103.27) |
3.3. Scanning Electron Microscopy (SEM)
Representative images of the roughness pattern of infiltrated enamel-protected and infiltrated enamel exposed to pH cycling are shown in Fig. (5). The qualitative images suggest a change in the surface for the two groups of resin materials evaluated when the protected and exposed sides of the samples analyzed were compared. Fig. (5A), representing the Icon group, demonstrates an extensive change in the surface when the protected and exposed sides were compared. Whereas in Figure B, referring to the Experimental group, little difference is noted between the two sides evaluated.
4. DISCUSSION
The experimental infiltrant was capable of penetrating the artificially induced white spot lesion, and so was the commercial infiltrant, corroborating a previously published study on the penetration depth of infiltrants in different compositions by Gaglianone et al. [9]. The literature reported that the role played by prior acid etching was to help penetration of the resin material into the body of the white spot lesion by making the pseudo-intact surface layer of enamel more porous [15-17]. This step may have contributed to the penetration of both resin infiltrants into the white spot caries lesions in this study. Furthermore, both the experimental resin and icon infiltrants evaluated contained a large amount of TEGDMA in their respective compositions, thereby increasing their fluidity, which positively contributed to the penetration of the infiltrants [18].
Resin infiltration into white spot caries lesions is known to result in a hybrid enamel with the presence of resin tags that impregnate into and interlock with the interprismatic enamel, thereby reinforcing the tooth enamel [19, 20]. In this study, the images captured by confocal microscopy showed that the CI exhibited a thicker layer of resin material. This may have been associated with the fact that the composition of the icon is based on the monomer TEGDMA only (according to the manufacturer), which confers greater fluidity and lower contact angle on the product compared to the characteristics of the experimental infiltrant. These properties are considered important for a greater degree of penetration of the product [9, 21]. Resin materials with a lower contact angle are known to be more likely to penetrate the porous body of the carious lesion [10]. Although the EI contained 75% of TEGDMA, it also contained the monomer BisEMA which has a higher molecular weight and, consequently, higher viscosity than TEGDMA [22]. This fact may have contributed to lower perfusion of the experimental infiltrant within the body of the white spot caries lesions. Nevertheless, despite the thinner layer of infiltrant, it was noted that both the experimental infiltrant and icon penetrated homogeneously into the incipient carious lesion, thereby interrupting communication between the internal (porous body of the lesion) and the external environments.
When considering the roughness and microhardness of the resin materials tested, the rejection of all three of the null hypotheses of this study could be affirmed. The behavior of the materials studied differed from each other, and they showed differences not only between the time intervals evaluated but also relative to the interaction between material and time for the properties of both roughness and surface microhardness analyzed. Application of the EI reduced the roughness of the region treated in a manner similar to that of the CI, with no significant difference between the groups evaluated. Hence, the experimental infiltrant proved to be no less effective than the icon infiltrant in terms of reducing roughness by providing a smoother surface compared to the surface of the untreated white spot lesion.
This reduction in roughness values may have been due to impregnation of the material into the enamel irregularities formed after the loss of minerals during the demineralization process [23]. Thus, the resin material filled the enamel pores that resulted from mineral loss and left the surface more uniform and smoother [15]. Patients are generally known to perceive tooth surface roughness when the Ra value is higher than 0.5 µm [15, 24]. In the present study, the resin infiltrants exhibited roughness values of 0.54 µm (Icon infiltrant) and 0.65 µm (Experimental infiltrant), with no statistical difference between them. Moreover, in this study, the infiltrated region was not submitted to polishing, as indicated by the manufacturer of the commercial infiltrant, due to difficulty with standardizing this procedure, which is a limitation of the proposed methodology. This may have influenced the roughness values immediately after infiltration; however, it has previously been observed that the use of finishing strips after resin infiltration was not considered advantageous in comparison with the surface roughness of the treated region that was not submitted to polishing [17].
However, after the infiltrated teeth were exposed to an acid challenge, the roughness value of the experimental group increased once again and did not differ from that of the icon group, which also attained a higher roughness value. This may have occurred due to changes in the polymeric chain of the infiltrating materials when faced with an acidic environment [12]. Furthermore, the resin materials tested contained a large quantity of the monomer TEGDMA, which is highly hydrophilic, making them prone to water sorption, solubility, and consequently, chemical degradation in an aqueous medium [12, 15]. The fact that the material degrades in an aqueous medium can lead to new irregularities forming on the surface of the infiltrated teeth; the material no longer fills the micro spaces that were previously filled [12].
Considering the materials, the EI exhibited a higher surface roughness value after it had been exposed to an acidic challenge when compared with the CI. This may be related to the higher viscosity of the experimental infiltrant, and consequently, to a lower degree of penetration into the lesion body [25]. This may have contributed to greater retention of the EI on the enamel surface, and consequently, greater degradation and formation of new surface irregularities [12]. Another point to be considered is that the complete composition of the CI is still unknown. Although the product manufacturer reported the presence of the monomer TEGDMA, no details have been provided about other components that may possibly contribute to the product's performance. The roughness value reached by the experimental group after exposing the material to the acid challenge was, however, still lower than that observed in the untreated white spot lesion. Moreover, reducing the surface roughness value is important since it tends to diminish the change in color and brightness of the tooth surface [26], in addition to reducing the accumulation of biofilm, another important factor for the prevention of caries and gingivitis [27].
In the representative SEM images of this study, both the EI and the CI demonstrated a change in the specimen surface on the side exposed to pH cycling when compared with their infiltrated-protected surfaces that were more uniform and smoother. The images were compatible with the quantitative results, in which an increase in roughness was observed for both materials after exposure to pH cycling. However, this increase remained lower than the roughness value of the untreated white spot lesion. These results were in agreement with the literature since a reduction in the surface roughness of the white spot caries lesion was observed after the application of the commercial resin material [17, 28]. In another previous study, however, the roughness values increased after the material was exposed to an acidic challenge, which, according to the authors, was attributed to the chemical degradation of the polymeric chain of the material in an acidic environment [12].
Regarding surface microhardness, after the application of the EI or the CI, neither product was able to increase this value. The experimental infiltrant showed lower performance than icon after its infiltration into the white spot caries lesion, demonstrating significantly lower microhardness values than that achieved for untreated white spot caries lesion microhardness. This value also differed statistically from that of the commercial infiltrant. This may have occurred due to the additional demineralization promoted by acid etching prior to infiltration (of the white spot lesion). When performing acid etching with 15% hydrochloric acid, the amount of enamel structure removed is known to be about 40 μm [29, 30]. Moreover, this etching leads to a more extensive opening of the lesion pores [31]. In addition, poor penetration of the experimental resin material into the body of the lesion may have occurred due to its higher viscosity. Therefore, there may have been an increase in enamel mineral loss that was not properly replaced by the infiltrant [25]. Hence, the difference in microhardness values found in this study could be explained by the difference in the composition of the materials tested [23].
Similarly, CI was incapable of significantly increasing the microhardness of the demineralized enamel after it was applied. According to the literature, a polymeric chain is not always formed throughout the entire lesion after the application of the resin infiltrant [30, 32]. Therefore, the sum of an insufficiently strong intermolecular bond together with the possibility that the resin did not infiltrate into the entire white spot lesion may have contributed to the failure to recover the enamel microhardness (140.86 kg/mm2) [30, 32]. Furthermore, polymerization shrinkage of the resin material itself could cause unfilled regions of demineralized enamel, and this could contribute to the manifestation of lower microhardness values [12, 23, 33].
Then, after exposure to pH cycling of the infiltrated samples, the microhardness values were even lower for both the EI and CI, with no statistical difference between them; however, the two groups of infiltrants exhibited a statistically significant difference in terms of microhardness recorded, shortly after they were infiltrated into the white spot lesions. This may have been associated with the degradation and dissolution of the resin material in an aqueous medium after the periods of pH cycling [34]. The large quantity of monomer TEGDMA in the composition of resin infiltrants makes them highly hydrophilic; thus, they have less resistance to deterioration in aqueous media [32]. Moreover, there may also have been further dissolution of regions within the body of the carious lesion, in which the infiltrant had not been fully incorporated into these regions of the lesion [32]. In the literature, there are some controversial studies on the change in microhardness after the application of the commercial infiltrant icon [23, 30, 35]. In a similar manner, other studies have shown different results on the resistance of the cited product to new acidic challenges [12, 25].
For conducting future studies, considering the results obtained, improvement of the experimental infiltrant could possibly be contemplated, with the aim of achieving lower viscosity and more extensive penetrability into the carious lesion. In addition, it may be interesting to perform the sectional microhardness test [17, 25, 36], with the goal of assessing the entire extension of the demineralized and infiltrated region, for the purpose of confirming the reinforcement of tooth structure promoted by the resin material. In vitro studies are important since they enable new materials to be studied and developed, thus leading to efficiency and safety in the further stages of research involving human beings. Additional clinical studies are, however, necessary since the conditions for conducting in vitro and in vivo studies differ. In the present study, for example, certain clinical circumstances, such as the presence of saliva and temperature fluctuations, were not evaluated. Furthermore, previous studies have found that resin infiltration contributes positively to the treatment of white spot caries lesions by preventing wear of the tooth structure, stabilizing incipient carious lesions, and preventing their progression [17, 37-39]. Consequently, these measures delay the need for restorative treatment and provide good esthetic results [25, 40].
Finally, this study indicated that the experimental infiltrant was able to penetrate white spot caries lesions and was efficient in reducing the surface roughness of demineralized enamel when compared with the commercial infiltrant. Nevertheless, the experimental resin agent, as was the case with Icon, did not increase the surface microhardness of the treated enamel. These results concluded that despite the failure to restore the surface microhardness of tooth enamel, the experimental resin material was shown to be an effective choice in cases in which the desire is to halt the carious lesion and reduce the surface roughness of the area affected, to prevent biofilm accumulation and progression of the carious lesion.
CONCLUSION
Based on the results presented, the experimental resin infiltrant was shown to act positively in the treatment of artificially induced caries white spot lesions when compared to the commercial infiltrant. Such results showed the potential of the experimental resin material in stabilizing incipient carious lesions besides favoring the reduction of biofilm accumulation in the treated region.
LIST OF ABBREVIATIONS
| EI | = Experimental Infiltrant |
| CI | = Commercial Infiltrant Icon |
| TEGDMA | = Triethylene Glycol Dimethacrylate |
| BisGMA | = Bisphenol A-glycidyl Methacrylate |
| BisEMA | = Ethoxylatedbisphenol A Dimethacrylate |
| CQ | = Camphorquinone |
| Dimethylamino | = Tertiary Amine |
| EDAB | = Ethyl Benzoate |
| SEM | = Scanning Electron Microscopy |
ETHICS APPROVAL AND CONSENT TO PARTICIPATE
This study was approved by the Research Ethics Committee of the School of Dentistry of Piracicaba (FOP-UNICAMP) - CAAE: 23041019.7.0000.5418.
HUMAN AND ANIMAL RIGHTS
No animals were used in this research. All procedures performed in studies involving human participants were in accordance with the ethical standards of institutional and/or research committee and with the 1975 Declaration of Helsinki, as revised in 2013.
CONSENT FOR PUBLICATION
Informed consent was obtained from all participants.
STANDARDS OF REPORTING
STROBE guidelines were followed in this study.
AVAILABILITY OF DATA AND MATERIAL
The authors state that the data supporting the findings of this study are available from the corresponding author, [de Cerqueira, GA], upon special request.
FUNDING
This study was funded by the São Paulo State Research Foundation with a Master's scholarship (case no. 2019/13621-0) and a financial aid (case no. 2019/25093-8).
CONFLICT OF INTEREST
The authors declare that they have no known competing financial interests or personal relationships that could have appeared to influence the work reported in this paper.
ACKNOWLEDGEMENTS
The authors would like to thank the Central Laboratory for High-Performance Technologies in Life Sciences (LacTAD) for their contribution to Confocal Fluorescence Microscopy images.

